


My kids could make more at Target, and they’d get Christmas off.’ Why 2,800 dairy families are making the hardest decision.
EXECUTIVE SUMMARY: At kitchen tables across dairy country, third and fourth-generation families are asking whether they should be the ones to step away. While Agriculture Secretary Rollins proclaimed a ‘golden age’ for dairy Monday, 2,800 farms will close in 2025 as margins compress to $11.55/cwt—down from $15.57 just six months ago. A typical 300-cow Wisconsin operation that netted $10,000 annually is now losing $61,000 after June’s make allowance changes shifted $82 million from producers to the processors industry-wide. USDA’s four-pillar response—dietary guideline updates, being ‘more vocal’ on interest rates, facilitating processor investments, and export expansion—offers no direct relief while processors invest $11 billion in facilities optimized for mega-dairies. Mid-sized operations face an 18-month decision window: gamble $2-3 million on expansion, pursue increasingly scarce niche markets, or execute an orderly exit while equity remains. The math increasingly points to one conclusion: the economics of their scale no longer work in a system optimized for different objectives.

You know, the conversations we’re having around kitchen tables these days are different from those we had even five years ago. I’m talking with third and fourth-generation producers who are looking at their numbers and wondering if maybe—just maybe—they should be the ones to step away. That’s a hard conversation, and it’s happening more than you’d think.
When Agriculture Secretary Brooke Rollins stood up at the National Milk Producers Federation meeting in Arlington on Monday, she spoke of a “golden age” for dairy and outlined a four-pillar action plan. But here’s what’s interesting—and I’ve been hearing this from producers all week—the view from the barn looks pretty different from the view from that podium.
The latest numbers from Rabobank and what we’ve been tracking suggest we’re looking at about 2,800 dairy farms closing in 2025. That’s somewhere between 7 and 9 percent of what’s left. Meanwhile, if you’re following the Dairy Margin Coverage program like most of us are, margins are sitting at $11.55 per hundredweight as of March, down from that nice $15.57 we saw back in September.
What I’ve found is we’re not just going through another rough patch here. This feels different. The gap between what’s being announced in Washington and what’s happening in the milk house…well, it’s pretty wide.
Let’s Talk Numbers

So I’ve been sitting down with producers, running through their books, and the pattern is remarkably consistent. Take your typical 300-cow Wisconsin operation—and there are still a lot of them out there.
The 300-Cow Reality Check: Annual P&L Breakdown
| Revenue & Expenses | Amount |
| Gross Milk Revenue (8.2M lbs @ current prices) | $1,480,000 |
| Feed Costs ($10.45/cwt DMC calculation) | -$857,000 |
| Labor (family plus hired help) | -$240,000 |
| Debt Service (2010s expansion loans) | -$112,000 |
| Operating Expenses (vet, supplies, utilities, repairs, insurance, property tax) | -$261,000 |
| Net Farm Income | $10,000 |
| After Make Allowance Increases (June 2025 FMMO changes) | -$61,000 |
“My kids could make more at Target, and they’d get Christmas off.”
— Minnesota dairy producer, 400 cows
And here’s where it gets really tough. Those Federal Milk Marketing Order changes that kicked in June 1st—the make allowance increases that processors can deduct from our checks—are another 85 to 90 cents per hundredweight gone. For that 300-cow operation? We’re talking $71,000 less per year. The Farm Bureau calculated it out, and industry-wide, that’s $82 million moving from producers to processors.
Breaking Down the Four Pillars
Let’s look at what Secretary Rollins is actually proposing here.
Pillar 1: Dietary Guidelines—Playing the Long Game
The idea is that updating the Dietary Guidelines for Americans will boost consumption. Current guidelines already recommend three servings of dairy daily for adults. Problem is—and the National Dairy Council has documented this—only about 12 percent of Americans actually follow those recommendations.
Key trend: USDA’s Economic Research Service shows we’ve gone from 247 pounds of fluid milk per person back in 1975 to about 128 pounds in 2023. That’s a 48 percent drop, despite dietary guidelines supporting dairy the whole time.
The Whole Milk for Healthy Kids Act letting whole milk back into schools? That’s positive. But school lunch participation is still down by 2.2 million kids from 2013, according to USDA data. Those are milk drinkers who just aren’t there anymore.
Pillar 2: Input Costs—Good Intentions, Limited Tools
Secretary Rollins acknowledging input cost pressures—that’s important. Since 2020, NASS data shows:
- Seed costs: Up 18%
- Fuel: Up 32%
- Fertilizer: Up 37%
- Interest expenses: Up 73% (the real killer)
When they asked for specifics at the NMPF meeting, the response was that Secretary Rollins would “be more vocal” with the Federal Reserve about interest rates. A producer with 400 cows in Minnesota summed it up: “Being vocal doesn’t pay the feed bill.”
Pillar 3: Processing Investments—Complicated Picture
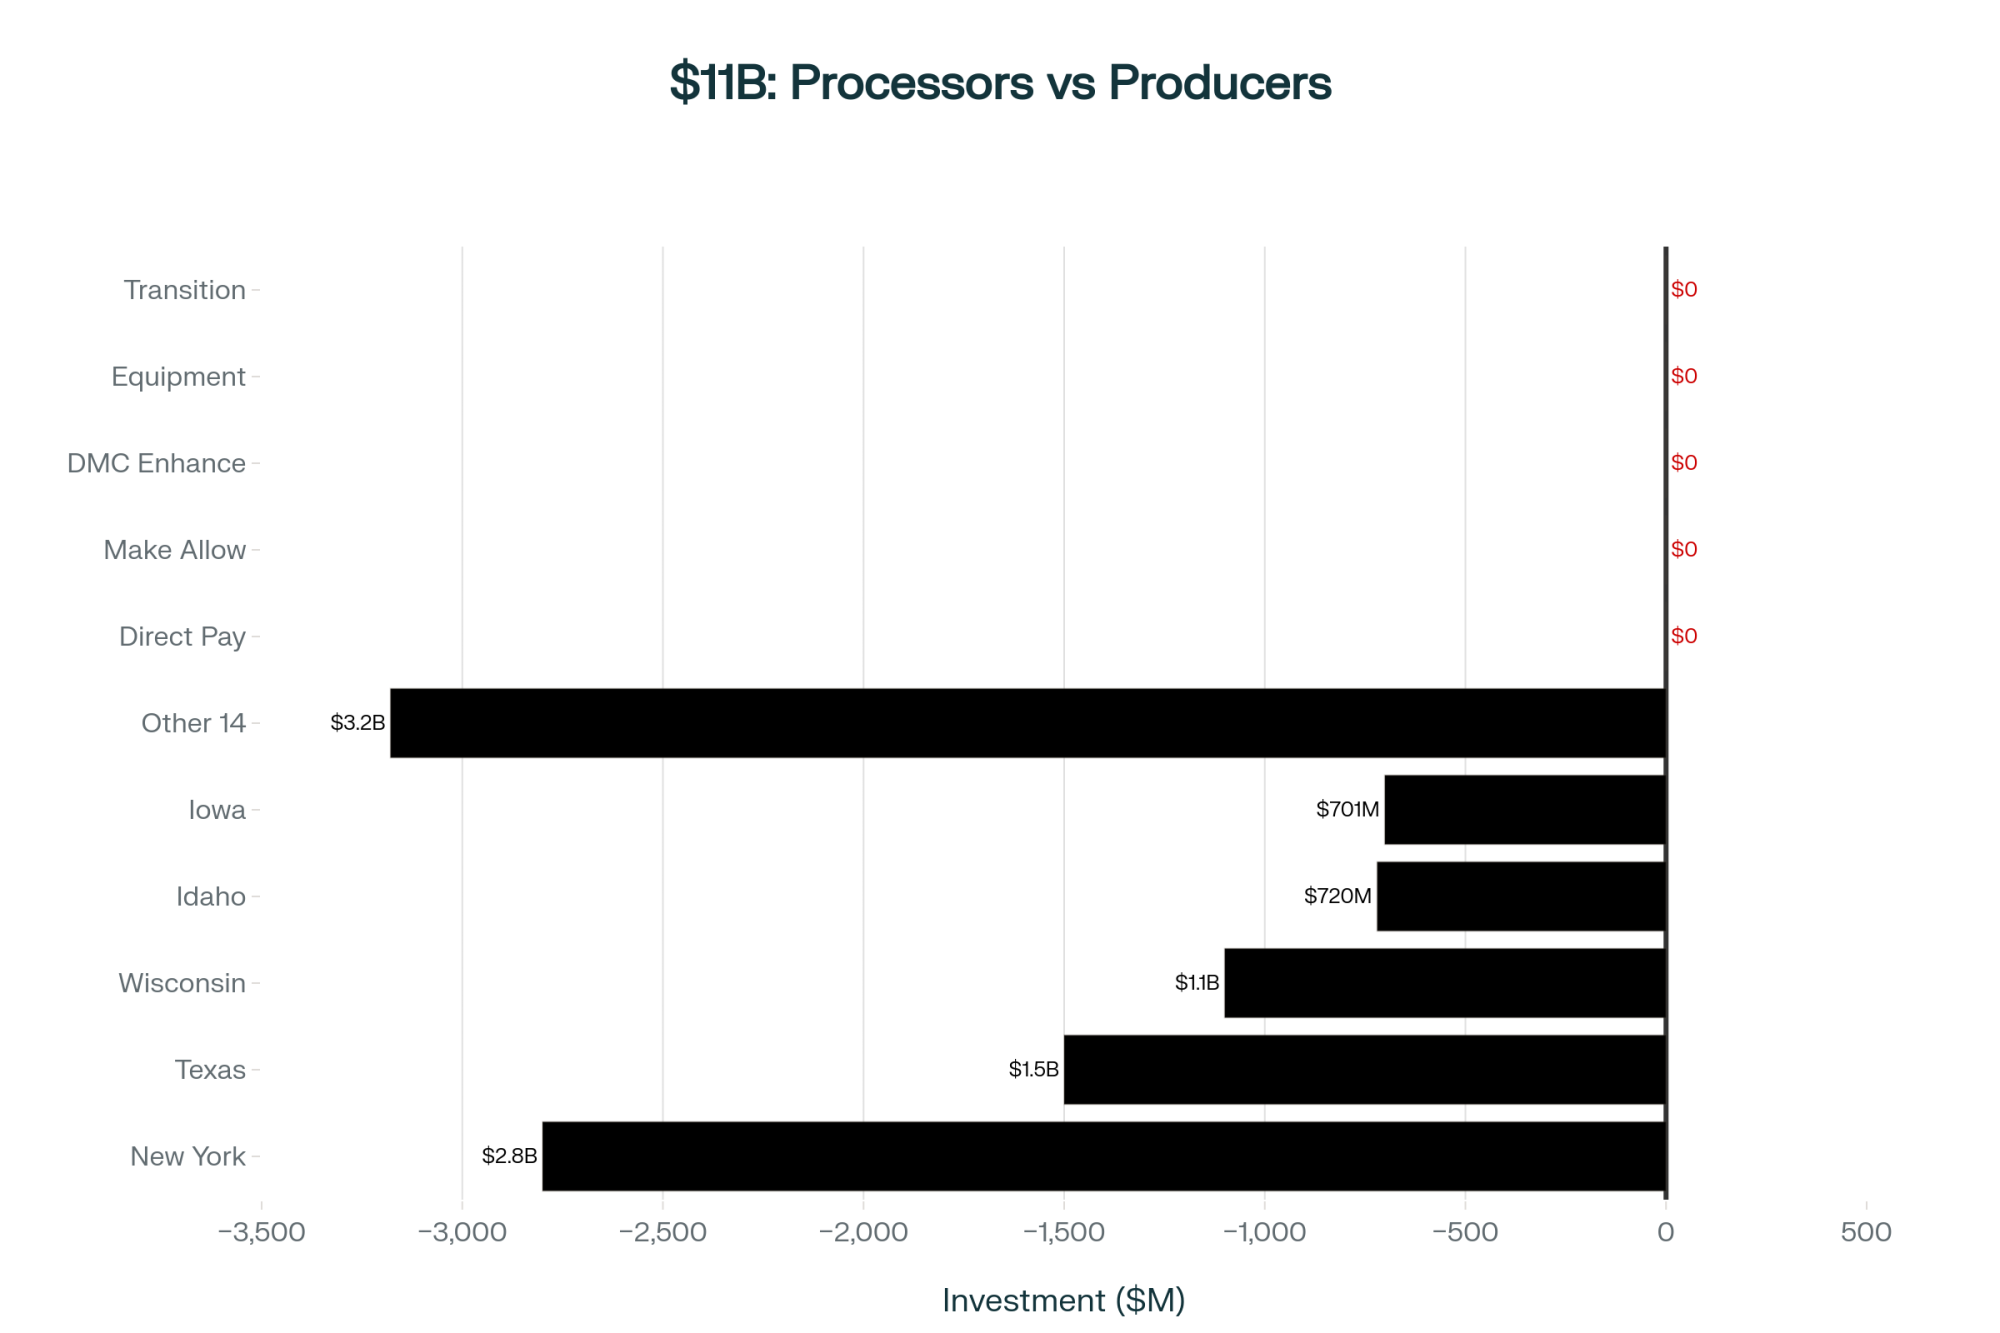
The International Dairy Foods Association announced $11 billion in processing investments across 19 states through early 2028. New infrastructure, expanded capacity—sounds great.
But these announcements came right after processors secured those make allowance increases worth $82 million annually. Hard not to connect those dots.
“These plants are being built for tomorrow’s farms, not today’s. And tomorrow’s farms don’t look like most of my members.”
— Wisconsin cooperative manager
What concerns me for mid-sized operations is the nature of these investments. A new cheese plant designed to handle 2 million pounds daily? They want five operations milking 2,000-plus cows each, not 50 different 300-cow farms.
Pillar 4: Export Markets—Progress with Risk
Exports are showing real growth. U.S. Dairy Export Council reports:
- Volume: Up 2% year-to-date
- Value: Up 16% year-to-date
- Indonesia: Now the 7th-largest market at $246 million
But China still has retaliatory tariffs on our products. Mexico takes nearly 40 percent of our cheese exports—that’s a lot riding on one relationship with the USMCA review coming in 2026.
The View from Up North
You know what Secretary Rollins didn’t mention? What’s happening in Canada. Their Dairy Commission data shows they’re maintaining about 12,000 operations averaging 85 cows, with debt-to-asset ratios around 16 percent.
Sure, quota runs about $24,000 Canadian per cow-equivalent. Consumers pay more. But Canadian producers can plan facility upgrades five, seven years out because they know what their milk price will be.
“I focus on production efficiency and cow comfort, not price volatility.”
— Ontario dairy producer at World Dairy Expo
Can you imagine?

How Support Has Changed: 2009 Crisis vs. 2025 Action Plan
| 2009 Dairy Crisis Response | 2025 USDA Action Plan |
| $3.5 billion in direct support (MILC payments + product purchases) | No direct financial support announced |
| Government bought 379 million pounds of nonfat dry milk | No product purchase program |
| Direct payments to farmers when prices crashed | “Being more vocal” with the Federal Reserve |
| Emergency intervention during the 36% price collapse | Policy speeches during steady consolidation |
The 18-Month Reality Check

Industry folks I trust keep pointing to the next 18 months as make-or-break time for operations in that 200-to-700 cow range. Several things are converging:
- June 2026: Environmental regulations tighten in key states
- Ongoing: Processing contracts getting renegotiated with new volume requirements
- Now: Farms that survived 2020-2024 by burning through working capital are running on fumes
Regional differences are striking:
- Southeast: Heat stress management costs change the economics completely
- Northeast: Higher land values and stricter environmental rules
- Mountain West: Water rights add another layer of complexity
- California: Even modernized operations face $4-5/cwt disadvantage versus mega-dairies
I know producers in California’s Central Valley—good farmers, 425 cows, modernized everything. University of California Extension studies show they’re still $4 to $5 per hundredweight higher in costs than the 3,000-cow operation down the road. As one told me, “We’re not bad farmers. We’re just the wrong size.”
| Region | Typical Herd Size | Cost per CWT | Cost Disadvantage vs Mega-Dairies | Primary Cost Drivers | Farms Lost 2022-2025 | 18-Month Survival Outlook |
|---|---|---|---|---|---|---|
| California Central Valley | 1,200-3,000 | $18.50-19.20 | $4.00-4.50 | Water/Environmental Regs | -425 | Critical |
| Pacific Northwest | 600-1,500 | $19.50-20.00 | $5.00-5.50 | Transportation/Labor | -280 | Severe |
| Southeast (Georgia/Florida) | 400-800 | $20.00-21.50 | $6.00-7.00 | Heat Stress/Mortality | -320 | Severe |
| Northeast (PA/Vermont) | 250-500 | $19.00-20.50 | $4.50-5.50 | Land Values/Phosphorus | -380 | Critical |
| Upper Midwest (WI/MN) | 300-700 | $17.50-18.50 | $3.50-4.00 | Property Tax/Labor | -630 | Critical |
| Mountain West (ID/UT) | 2,000-5,000 | $15.50-16.50 | $1.00-2.00 | Scale Efficiency | -140 | Moderate |
| Southwest (TX/NM) | 2,500-10,000 | $15.00-16.00 | $0.50-1.50 | Lowest Input Costs | -95 | Stable |
What This Means for Different Scales
Operations Under 500 Cows: The Hard Math
Calculate your true per-hundredweight costs, including fair wages for family labor. Can you survive with margins below $12? Looking at CME futures, that might be reality through mid-2026.
Your three main options:
- Scaling up: $2-3 million minimum investment, 7-10 year payback if margins improve
- Going organic: 7-year conversion, many regions already oversupplied per the National Organic Program
- On-farm processing: Budget at least $500,000, plus you’re starting a new business
Sometimes preserving equity through an orderly exit makes more sense than operating at a loss for two more years. It’s math, not judgment.
Operations Over 700 Cows: Better Positioned but Not Immune
You’re better positioned, but every percentage-point improvement in feed conversion or component efficiency matters now. Watch for opportunities when neighbors exit. Some successful operations grow incrementally through local consolidation rather than through massive expansions.
| Decision Point | Action Required | Equity at Stake | Options Remaining |
|---|---|---|---|
| Month 0: First Negative Margin | Calculate true cost per cwt including family labor | $0 (Starting Point) | All paths open |
| Month 3: Review Break-Even Analysis | Analyze 3-year profit/loss trend, equity burn rate | -$15,000 to -$45,000 | All paths open |
| Month 6: Critical Assessment Window | Can you secure processing contracts post-2026? | -$45,000 to -$120,000 | All paths feasible |
| Month 9: Processor Contract Decision | Commit to scale-up ($2-3M) OR niche market pivot | -$90,000 to -$200,000 | Costs rising for delayed decision |
| Month 12: Go/No-Go Decision Point | Final decision: Invest, pivot, or orderly exit | -$150,000 to -$320,000 | Window closing rapidly |
| Month 15: Implementation Begins | Begin facility upgrades OR market transition | Stabilizing or declining | Committed to chosen path |
| Month 18: Irreversible Commitment | Capital deployed, path locked in | Path dependent | No turning back |
| Month 24+: Forced Exit (if waited) | Emergency liquidation, lost equity | -$380,000 average loss vs. Month 12 exit | Emergency measures only |
Five Critical Questions to Answer Before January 2026
If you’re facing these decisions, start with question one and work through them honestly:
1. What’s your true breakeven, including family living expenses?
Not just covering cash flow—actually supporting your family at a reasonable standard.
2. Can you secure processing contracts beyond 2026?
If your processor is building new facilities, are you the size they want long-term?
3. At current margins, how fast are you burning through equity?
If you’re losing $50,000 annually, when does your debt-to-asset ratio become problematic?
4. If succession is planned, are you handing over a viable business or debt?
Be honest about what the next generation would actually inherit.
5. What does orderly exit today look like versus forced exit in 18 months?
Compare land values, equipment depreciation, and herd values in both scenarios.
Finding Ways Forward
Not everyone’s giving up. A Pennsylvania producer with 380 cows went from losing $40,000 annually to breaking even. “We renegotiated every contract, switched to seasonal calving to reduce labor peaks, and started custom raising heifers for cash flow. It’s not pretty, but we’re still here.”
In Vermont, three neighbors with 200-cow operations formed a joint venture. They share equipment and labor but keep separate ownership. Their combined 600 cows achieve better economics without anyone taking on massive debt.
Down in Texas, smaller operations are finding success with direct institutional sales. One producer’s getting a $2 premium per hundredweight from a regional hospital system valuing local sourcing. For a 300-cow operation, that’s $164,000 additional annual revenue.
These aren’t miracles. They’re grinding it out, getting creative, adapting.
The Reality We’re Facing
Current policy seems optimized for large-scale operations and export competitiveness rather than for preserving mid-sized farms. That $11 billion in processor investments signals confidence in dairy’s future—but it’s a future with fewer, larger farms producing for global commodity markets.
The 300-cow operations that built our rural communities are becoming harder to sustain economically. Not because they’re bad at farming, but because the system increasingly favors scale.
Practical Steps That Work
Surviving operations share common traits. It’s not about the newest equipment—it’s about eliminating every unnecessary expense. Some are forming partnerships, sharing resources, even merging herds while keeping separate ownership.
Market development works when you find specific buyers—hospitals, schools, regional chains—who value local sourcing enough to pay premiums. Financial creativity matters too. Equipment leases, custom work arrangements, conservation easements—everything’s worth considering.
Resources Worth Checking
Financial Planning:
- DMC Decision Tool at dairymarkets.org
- Federal Milk Marketing Order info at ams.usda.gov
- Your state Extension dairy program for cash flow templates
Support When Needed:
- Farm Financial Standards Council: ffsc.org
- National Young Farmers Coalition: youngfarmers.org
- Farm Aid hotline: 1-800-FARM-AID

The Bottom Line
Secretary Rollins’ “golden age” might happen for large operations positioned for exports, processors with efficient new plants, and input suppliers serving bigger customers. This infrastructure will make U.S. dairy more globally competitive.
But for many 300-cow Wisconsin operations, 450-cow Pennsylvania farms, 250-cow Vermont dairies, this isn’t a golden age. It’s a countdown. Not because they failed, but because the economics of their scale don’t work in the current system.
These families need honest analysis and practical tools, not just optimism. The next 18 months will reshape American dairy more than any period since the 1980s. Whether mid-sized producers find ways to stay viable or choose to preserve value through exit, they’re making rational decisions in challenging circumstances.
At kitchen tables across dairy country tonight, families are making choices that can’t wait for the next farm bill or election. They’re using real numbers, actual margins, and making generational decisions. Whatever they choose, they’re not failing. They’re adapting to reality.
The industry that emerges will be different. Understanding that—both the challenges and opportunities—helps us all navigate this transition better. That’s the conversation we need to be having, with clear eyes and respect for the tough choices our neighbors are making.
Because at the end of the day, we’re all trying to figure out the best path forward in an industry we love, even when it’s testing us like never before.
KEY TAKEAWAYS:
- The $71,000 shift: June’s make allowance changes moved $82M from producers to processors—turning a typical 300-cow operation from barely profitable ($10K) to bleeding cash (-$61K)
- Your 18-month decision window: By January 2026, choose your path—invest $2-3M to scale up, transition to niche markets, or execute an orderly exit while preserving equity
- Why USDA’s “support” won’t save you: The four-pillar plan (dietary guidelines, export expansion, processor investments, “vocal” interest rate advocacy) offers no direct financial relief as 2,800 farms close
- The permanent disadvantage: Operations under 700 cows face $4-5/cwt structural cost gap versus mega-dairies that no amount of belt-tightening can overcome
- Five critical questions to answer now: True breakeven with family wages? Processing contracts beyond 2026? Equity burn rate? Succession viability? Exit value today vs. 18 months?
Complete references and supporting documentation are available upon request by contacting the editorial team at editor@thebullvine.com.
Learn More:
- Pick Your Lane or Perish: The 18-Month Ultimatum Facing 800-1,500 Cow Dairies – Reveals how October’s $2.47 Class spread forces mid-sized dairies into immediate strategic decisions between commodity and premium markets, providing tactical frameworks for operations caught between scaling up and specialized production.
- The $11 Billion Betrayal: Your Processor Is Building Your Replacement Right Now – Exposes the strategic implications of massive processor investments for farms unable to write $3M expansion checks, demonstrating why current infrastructure development favors mega-dairy consolidation over traditional family operations.
- Building a Beef-on-Dairy System: Capturing $360,000 in Annual Farm Profit – Demonstrates how farms are pivoting from traditional dairy breeding to beef-on-dairy crosses, jumping from 50K to 3.2M head nationally and boosting calf revenue from 2% to 6% of total farm income—a proven alternative revenue stream for operations facing margin pressure.
 The Sunday Read Dairy Professionals Don’t Skip.
 The Sunday Read Dairy Professionals Don’t Skip.
Every week, thousands of producers, breeders, and industry insiders open Bullvine Weekly for genetics insights, market shifts, and profit strategies they won’t find anywhere else. One email. Five minutes. Smarter decisions all week.


