


Dairy’s biggest winners didn’t have better genetics. They had better timing. The $1.3M difference happened in 2009, not 2019.
Executive Summary: The U.S. dairy industry’s 30% component revolution wasn’t about genetic breakthroughs—it was about economics creating signals that genomics finally made actionable. When component pricing launched in 2000, the market screamed for higher butterfat, but producers lacked tools to respond until genomic testing arrived in 2009, tripling selection accuracy overnight. Early adopters who grasped this sequence and invested immediately captured $1.3 million in value, while “prudent” operations that waited until 2015 saved $130,000 but forfeited $190,000+. Today’s brutal reality: farms under 200 cows face a permanent $366,375 annual disadvantage versus 2,000-cow operations—a gap that compounds annually and can’t be overcome through better management. With only 35% of herds having basic infrastructure like DHI testing, and 2,800 operations exiting annually, the industry is splitting into two irreconcilable segments. The 2025-2027 window represents the last opportunity for strategic action: scale to 300+ cows with full technology adoption, pivot to premium markets, or exit with dignity while equity remains
You know, there’s something happening in dairy right now that most producers are getting backwards. According to USDA’s April 2025 Milk Production Report and CoBank’s March 2025 dairy analysis, butterfat production surged 30.2% and protein jumped 23.6% from 2011 to 2024, while milk volume grew just 15.9%.
Here’s what caught my attention: total milk production actually declined in both 2023 and 2024—the first back-to-back drop since the 1960s according to USDA National Agricultural Statistics Service—yet butterfat hit 4.23% nationally, shattering a 76-year-old record that stood since 1948.
Most folks I talk to at meetings believe genomic testing drove this transformation. They’re looking at it backwards, and once you understand the real sequence of events, it changes how you think about every breeding decision you’ll make this year.

The Economic Signal That Started Everything
Looking back at the data from the Council on Dairy Cattle Breeding, the transformation didn’t actually begin with the 2009 launch of commercial genomic testing. It started in 2000 when Federal Milk Marketing Orders implemented multiple component pricing formulas, fundamentally changing how we all get paid.
The Math That Changed Everything
Suddenly, nearly 90% of milk check value came from butterfat and protein content, not volume. When butterfat trades at $3.20 per pound—which it has in recent Federal Order announcements—increasing your herd’s butterfat test by just 0.1% adds $3,200 to the value of every million pounds of milk you ship.
The market was essentially screaming at us to breed for components.
Yet according to USDA Economic Research Service dairy analysis, from 2000 to 2010, milk, butterfat, and protein production all grew at nearly identical rates—between 13.8% and 15.4%. Why the lag? Well, that’s where this story gets really instructive for anyone trying to understand today’s consolidation dynamics.
The Biological Speed Limits We All Faced
I’ve been digging through the research, and what Penn State’s Dr. Chad Dechow documented in his Holstein genetic diversity studies reveals why economics alone couldn’t drive immediate change.
Three Fundamental Constraints
Before genomic testing, we faced three fundamental constraints that no amount of economic incentive could overcome:
Terrible selection accuracy: Parent average predictions offered just 20-35% reliability, according to CDCB historical data. Young bulls? Maybe 40% reliability using pedigree indexes. You’d select a bull expecting +80 pounds of fat transmission, only to discover five years later when his daughters finally milked that he actually transmitted +20 pounds.
Glacial generation intervals: Research published by García-Ruiz and colleagues in PNAS (2016) showed the average generation interval stretched 5.5 years pre-genomics, with the sire-to-bull path taking 6.8 years. A breeding decision made in 2000 wouldn’t show population-level results until 2012 or 2013.
Limited technology adoption: University extension surveys from that era show only about 70-75% of U.S. dairy cows were being bred artificially with elite genetics in 2000. Synchronized breeding protocols? Just 10-15% adoption. Natural service bulls still covered 25-30% of breedings.
The 2009 Revolution

Then 2009 changed everything. According to USDA’s Animal Genomics and Improvement Laboratory, genomic testing tripled selection accuracy to 60-68% immediately at birth. Generation intervals compressed from 5.5 to 3.8 years.
By 2011, the first daughters of genomically-selected bulls entered milking strings nationwide. What we’re seeing now isn’t delayed response to pricing—it’s the first time biological and technological infrastructure existed to capitalize on incentives that had been present all along.
Quick Reference: Key Terms in Modern Dairy Breeding
Genomic Testing: DNA analysis that predicts an animal’s genetic potential at birth with 60-70% accuracy, versus 20-35% with traditional parent averages
Net Merit $: USDA’s economic index estimating lifetime profit potential of an animal’s genetics
DHI (Dairy Herd Improvement): Monthly milk testing program that tracks production, components, and somatic cell counts
Component Pricing: Payment system where farmers are paid based on pounds of butterfat and protein rather than milk volume
A Tale of Two Strategies: Early Adopters vs. Wait-and-See
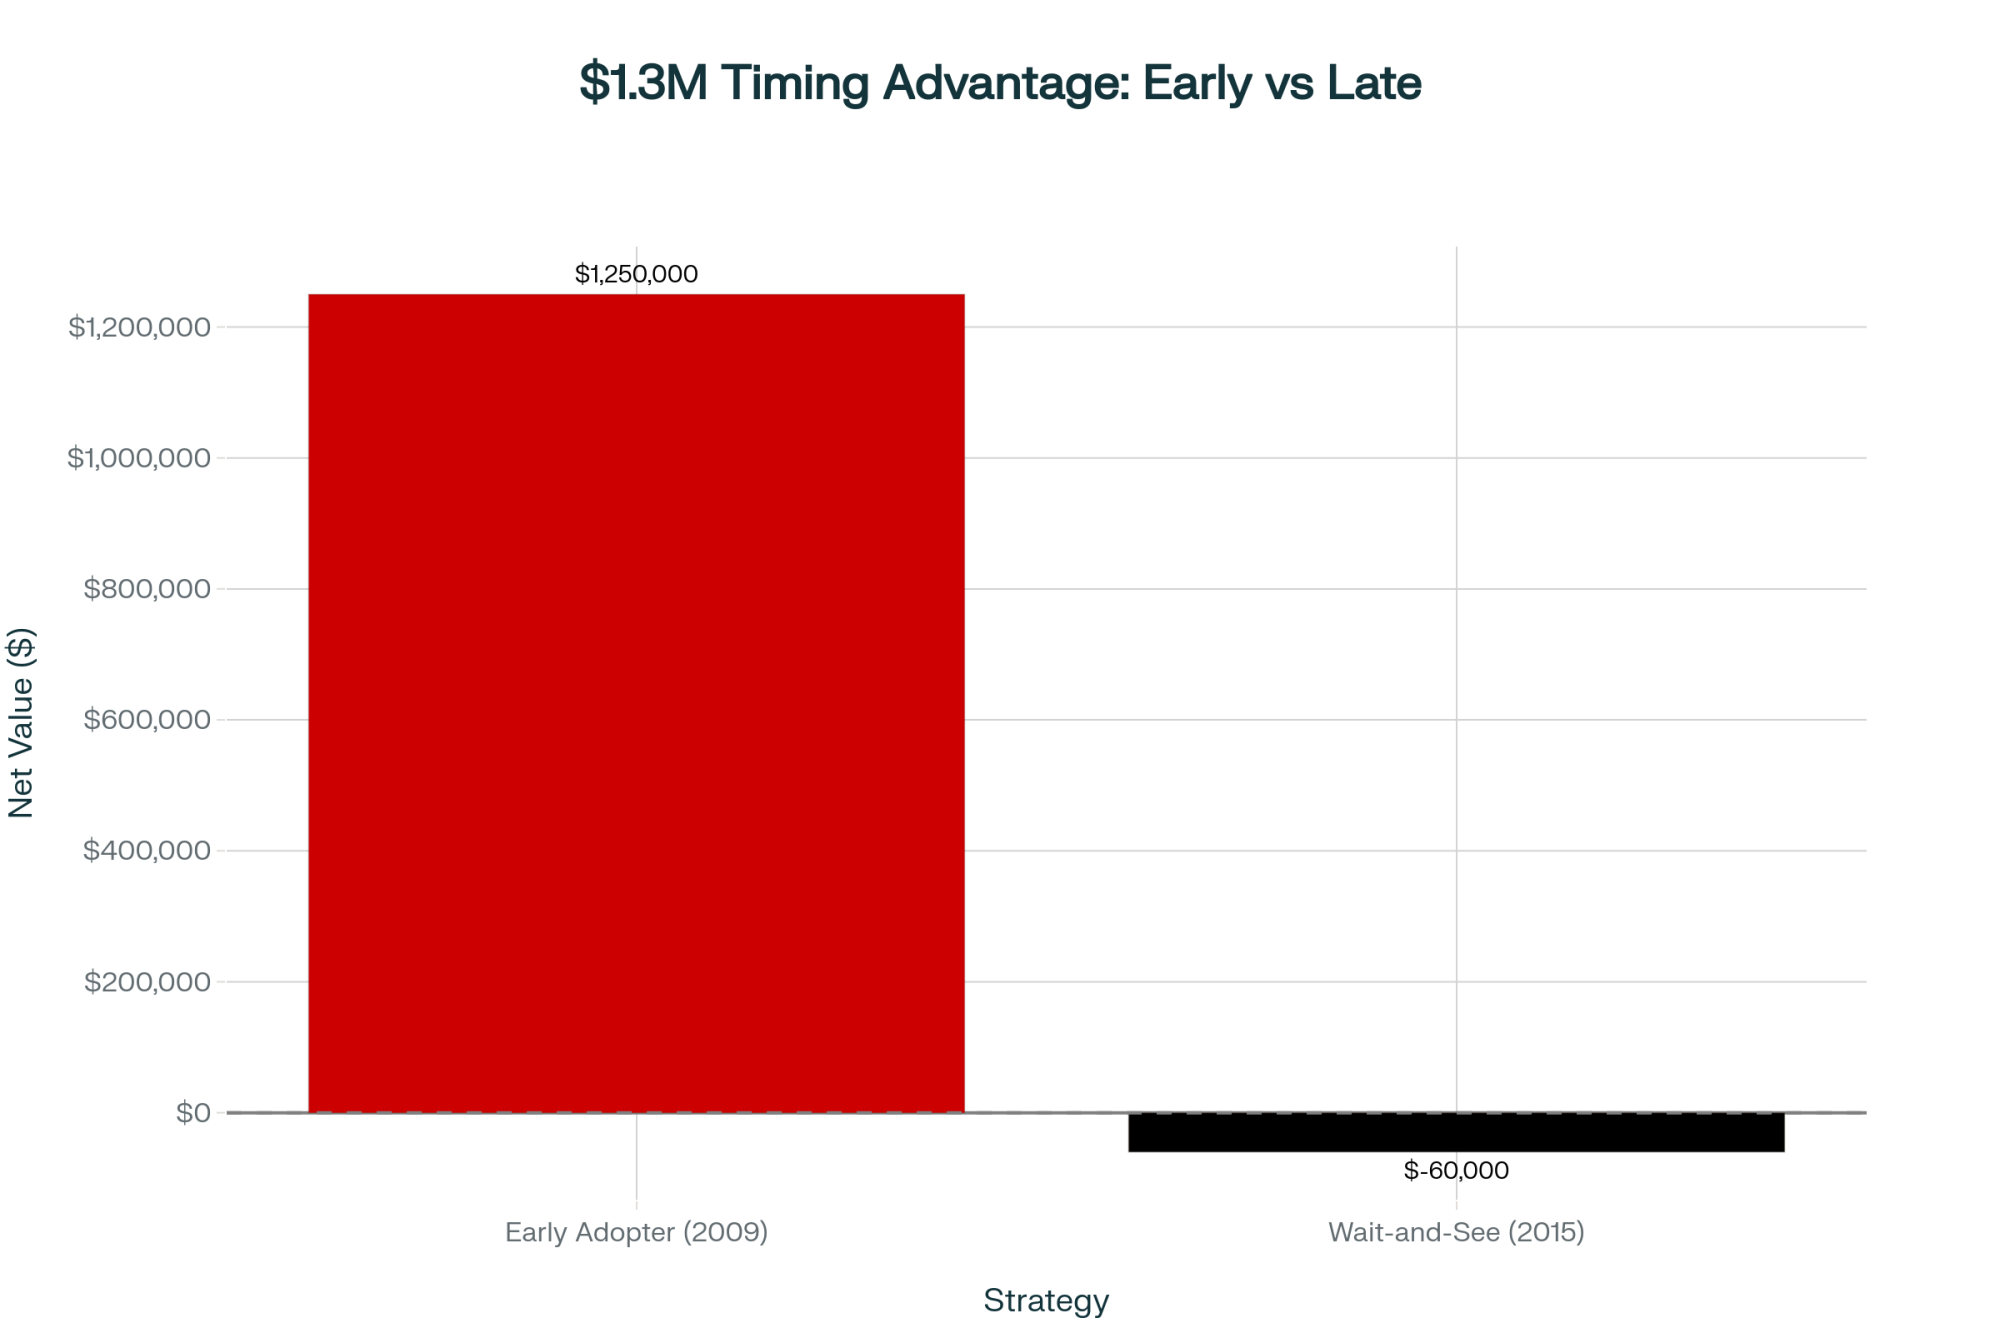
Let me share a scenario based on actual industry patterns I’ve tracked across multiple operations. Consider two typical 500-cow Wisconsin dairies, both aware of component pricing incentives. Their divergent paths from 2009-2019 illustrate exactly how timing created permanent competitive advantages.
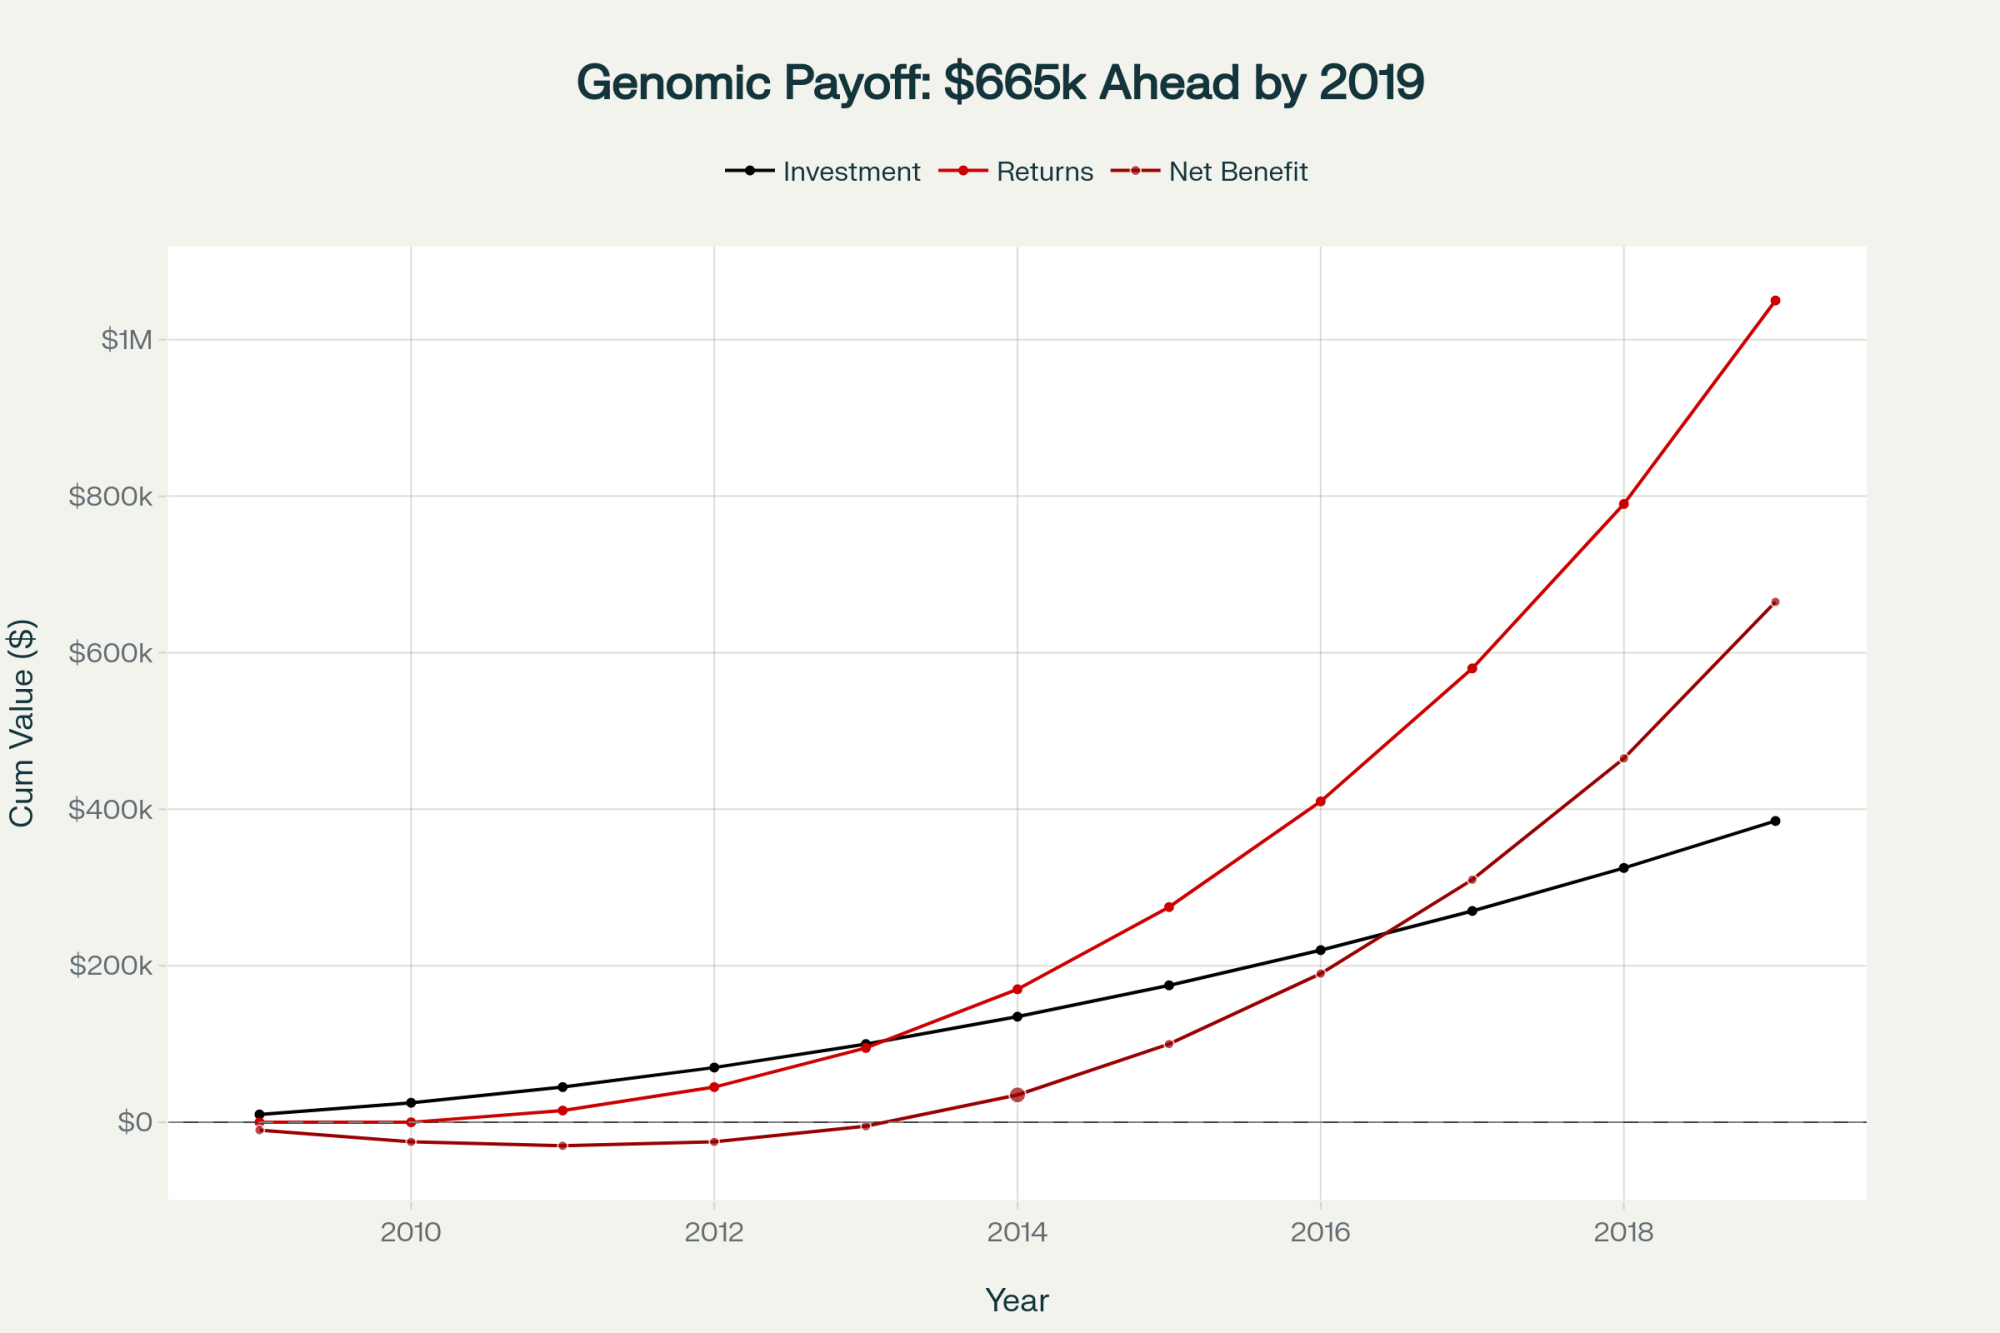
The Early Adopter Strategy (2009-2011)
These producers made four decisions that their neighbors thought were reckless:
- Started genomic testing every heifer calf at birth through programs like Zoetis’s CLARIFIDE ($45-50 per test when everyone else was paying zero)
- Immediately culled the bottom 25% of genomically-tested calves—sold them at 2-4 months old
- Switched to 100% young genomic bulls averaging +$400-500 Net Merit
- Implemented Ovsynch protocols on 80% of the herd
Projected Results by 2016
Based on industry modeling:
- Butterfat test: 4.15% (up from 3.78% baseline)
- Protein test: 3.28% (up from 3.12%)
- Component premium: Approximately $73,000 annually
- Early culling savings: $105,000 annually
- Beef-cross premiums: $30,000 annually
Total modeled value creation over 10 years: $1.2-1.3 million after testing costs
The Wait-and-See Approach
The “wait-and-see” operations held off until 2015-2016. By then, test costs had dropped to $28-35 and reliability had improved to 68%. Sounds prudent, right?
Industry modeling suggests otherwise. While these operations saved approximately $130,000 in testing expenses from 2009-2015, they forfeited an estimated $190,000+ in component premiums during just 2016-2019.
The Infrastructure Reality Nobody Talks About
Here’s what determines whether genomic strategies actually work, and I learned this the hard way watching operations try to implement these programs: it’s infrastructure, not genetics.
Current Infrastructure Gaps
According to CDCB data from 2024, here’s where we actually stand:
- DHI testing participation: Just 35% of herds
- Computerized records: Industry surveys estimate 40-50% of sub-200-cow herds still use paper breeding sheets
- Activity monitoring: Adoption remains below 30% in smaller operations
- Reliable internet: Still a major barrier across rural areas
The Six Essential Components
The pattern I keep seeing is that genomic strategies need all six infrastructure components working together:
- DHI testing
- Herd management software (DairyComp, PCDart, or similar)
- Genomic testing capability
- Synchronized breeding protocols
- Disciplined record-keeping culture
- Reliable internet for data integration
My rough estimate? Maybe 15-20% of U.S. dairy operations have all pieces in place.
The Cruel Paradox of Efficiency
This creates what economists call a cruel paradox. Operations that most desperately need efficiency gains—those under 200 cows facing what Rabobank’s October 2024 Dairy Quarterly described as “-$2/cwt to +$2/cwt margins”—can least afford the $50,000-70,000 infrastructure investment required over five years.
Meanwhile, operations with 2,000+ cows generating $1-4 million annual profits can fund infrastructure improvements from cash flow every single year.
By The Numbers: The 2025 Dairy Reality
Consolidation Metrics:
- 35% of U.S. dairy herds participate in DHI testing (CDCB, 2024)
- 2,800 dairy operations projected to exit annually through 2030 (Rabobank October 2024 Dairy Quarterly)
- $9.77/cwt cost disadvantage for 100-199 cow operations versus 2,000+ cow operations
- 65% of U.S. milk now comes from operations with 1,000+ cows (2022 Agricultural Census)
Genetic Revolution Impact:
- 30.2% increase in butterfat production (2011-2024)
- 23.6% increase in protein production (2011-2024)
- $1.2-1.3 million modeled advantage for early genomic adopters
The Consolidation Reality: Different Strokes for Different Regions
The Cost Gap That Can’t Be Overcome
According to USDA cost of production analysis:
- Farms with 2,000+ cows: $23.06/cwt
- Farms with 100-199 cows: $32.83/cwt
- Permanent disadvantage: $9.77/cwt

For a 150-cow operation in Wisconsin producing 3.75 million pounds annually, that calculates to a $366,375 annual profit gap.
Regional Variations
In California’s Central Valley where land costs are astronomical, even 500-cow operations struggle with similar economics. Meanwhile, operations in South Dakota with lower land and labor costs can remain viable at 300-400 cows, according to South Dakota State University Extension analysis.
“We can’t compete on volume, but when you’re shipping 4.3% fat and 3.4% protein, the processors come looking for you.” — Texas dairy producer focusing on component premiums
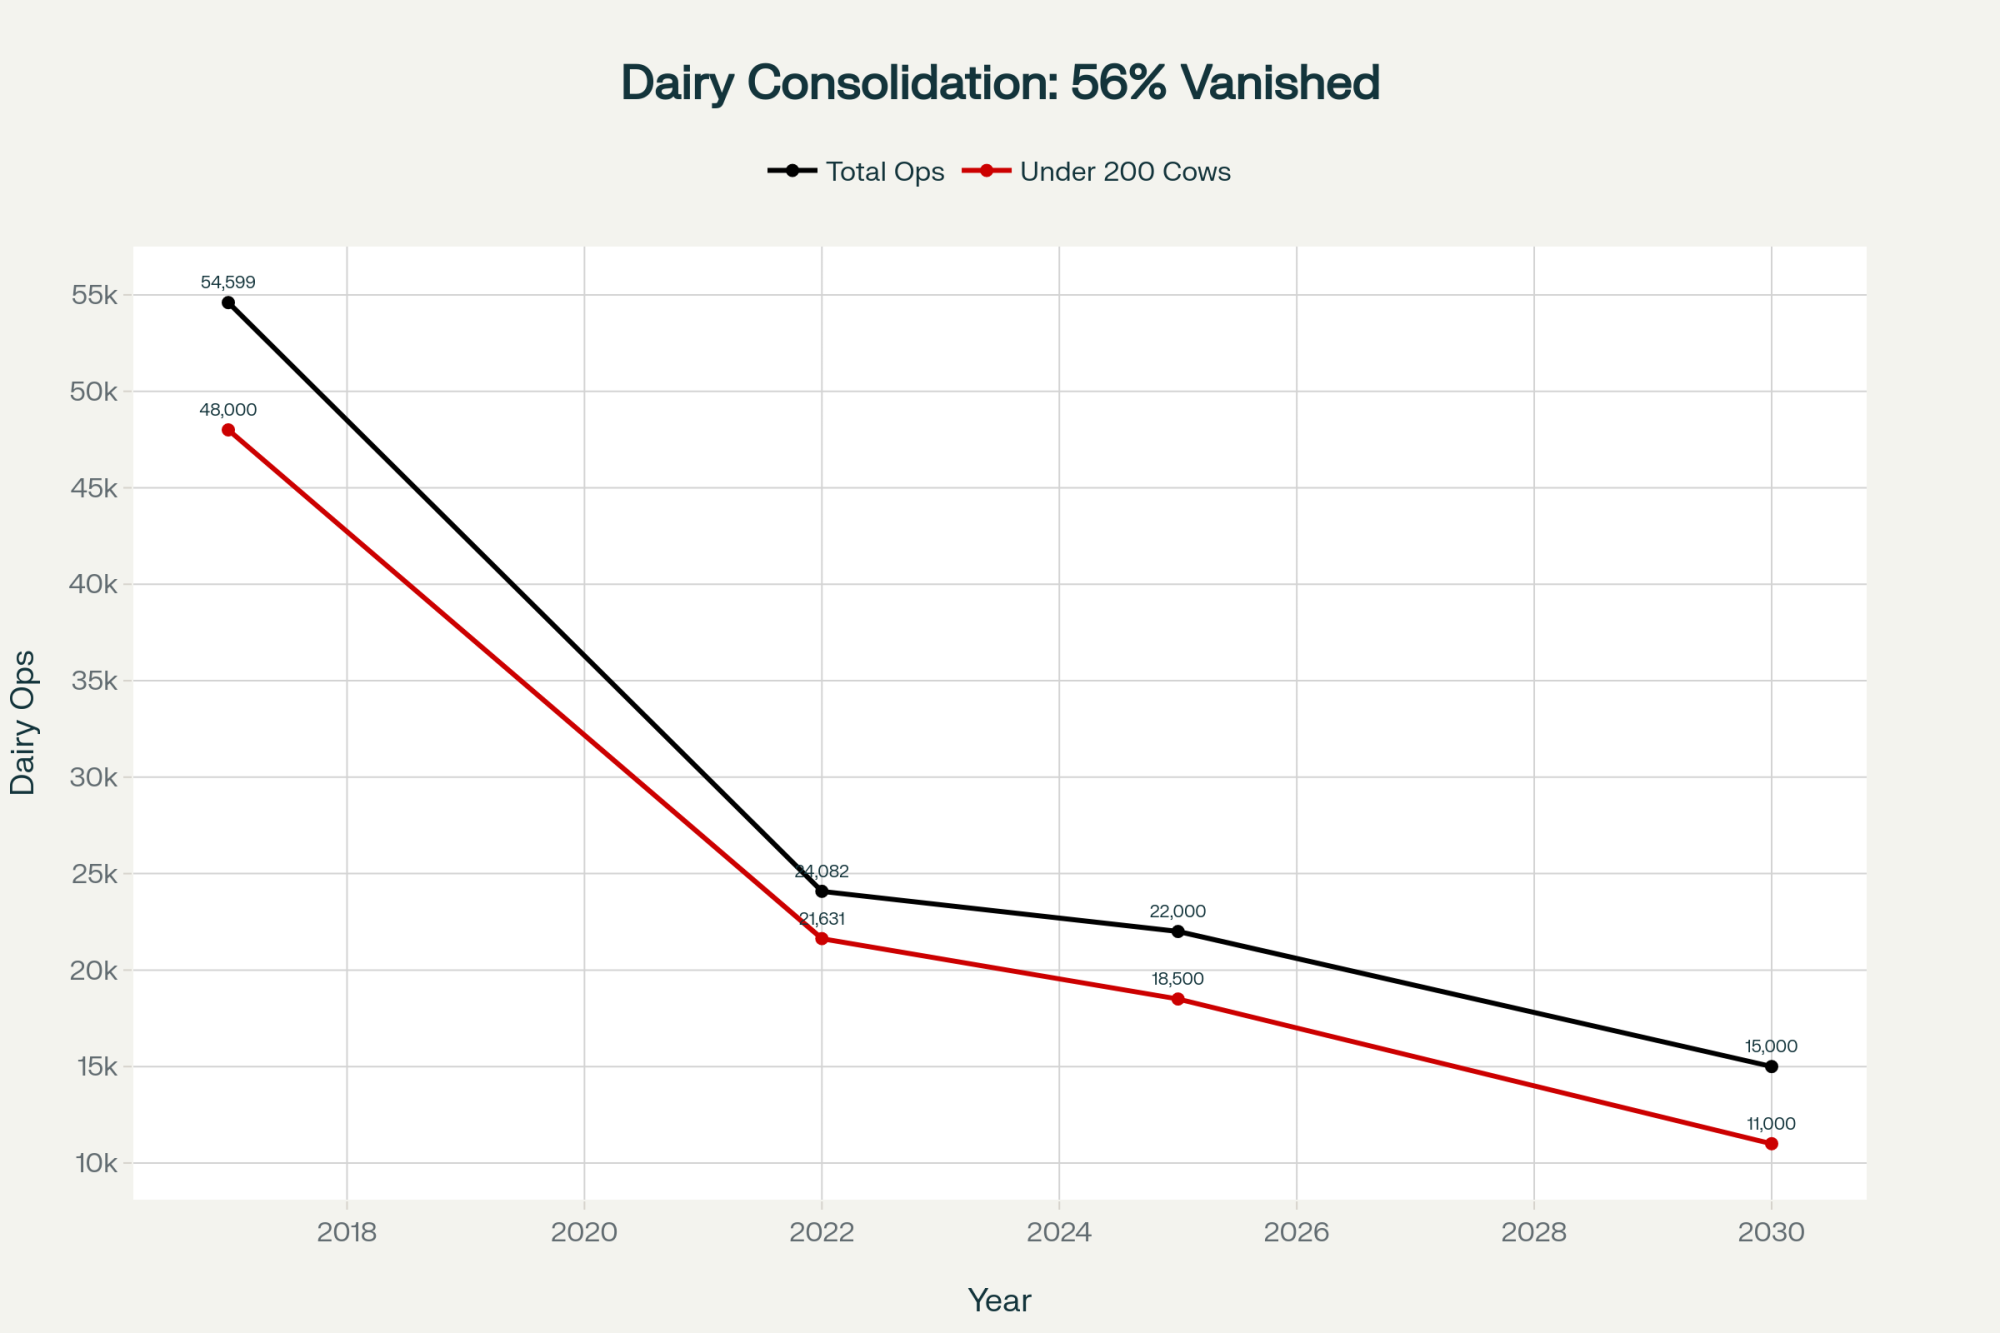
The Stark Census Reality
What the 2022 Agricultural Census revealed:
- 2017: 54,599 licensed dairy operations
- 2022: 24,082 operations (56% decline in 5 years)
- 2025 projection: approximately 22,000 operations
- 2030 projection: 14,000-16,000 operations
Farms under 200 cows lost 26,369 operations from 2017-2022, while farms over 1,000 cows actually added 400. The industry isn’t just consolidating—it’s splitting into two completely different businesses.
How Processors Are Shaping This Transformation
According to CoBank’s dairy quarterly analysis, over $8 billion in new processing capacity is coming online through 2027, with 80% focused on cheese, butter, and protein ingredients—all products where yields depend entirely on component levels.
“We’re not building plants to handle more gallons. We’re investing in infrastructure designed to maximize value from higher butterfat and protein concentrations. A producer shipping 3.8% fat milk versus 4.2% fat milk? That’s a massive difference in our cheese yields.” — Procurement manager from major cheese company
This processor demand feeds right back into the pricing formulas, creating even stronger economic signals for component production.
The 2025 Decision Point: Why This Year Matters
Demographic Reality
Looking at demographic data from Wisconsin’s Center for Dairy Profitability surveys:
- 22% of farms under 100 cows plan to exit within five years
- 70% have no identified successor
This isn’t really about economics anymore—it’s demographics. Baby Boomer retirements are accelerating regardless of milk prices.
Current Conditions Favor Strategic Decisions
According to USDA’s Dairy Margin Coverage Program data:
- Profit margins hit $13.14/cwt in Q3 2024—historical highs
- All-Milk prices averaging $22-25/cwt
- Land values remain elevated from 2021-2022 boom
- Buyer demand still exists from expanding operations
But By 2028-2030, Everything Changes
With 2,400-2,800 annual closures projected by Rabobank’s October 2024 analysis:
- Markets flooded with used equipment and facilities
- Buyer pool shrinks to just mega-operations
- Equipment values likely collapse from oversupply
Two Paths That Actually Work
Path 1: The Optimized Mid-Scale Model (300-600 cows)
Economic analysis from New Zealand’s dairy sector shows their national herd size stabilized around 450 cows—not by accident, but because that’s where per-cow profitability peaks.
Operations at this scale with full technology adoption can achieve:
- Superior milk quality (SCC averaging 161,000 versus 200,000+)
- 15-25% higher profit per kilogram of milk solids
- Manageable labor requirements with family involvement
- Financial sustainability without extreme debt leverage
Required commitment: $50,000-70,000 annual technology investment for at least five years.
Path 2: Premium Niche Markets
Market reports indicate direct-to-consumer operations in premium markets can achieve $40-50/cwt, though this requires:
- Complete pivot from commodity production
- Serious marketing capabilities
- Certification costs
- Geographic proximity to affluent consumers
Success Story: How Minnesota Dairies Made the Transition
Here’s a composite example based on three similar operations I’ve worked with in central Minnesota between 2009-2015 (details combined for privacy).
The Implementation Phase
These producers were milking around 280 cows when genomic testing launched in 2009, barely breaking even at $14/cwt milk prices.
“Yeah, we almost didn’t do it. Forty-five dollars per calf for testing seemed crazy. But our nutritionist ran the numbers on what we were losing by raising the wrong heifers.”
They started testing in spring 2010, immediately culled their bottom 20% of heifers, and switched to all genomic young sires.
“I remember standing at the sale barn. Other farmers were buying our culled heifers thinking they got a bargain. Meanwhile, we kept the ones genomics said would actually make us money.”
The Results
By 2015, their first genomically-selected heifers entered the milking string:
- Components jumped: 3.75% to 4.05% fat; 3.08% to 3.22% protein
- Premium increased: $3-4/cwt more than neighbors
- Expansion enabled: Grew to 400 cows, upgraded parlor
Total investment (2010-2020): $350,000-400,000 Documented returns: Over $1 million
Making the Decision: Your Three Critical Questions
After working with hundreds of operations facing these decisions, here are the three questions that cut through all the noise:
1. Do you have a committed successor currently working on the operation?
And I mean actually working, not just “interested” or “might come back after college.”
2. Can you invest $50,000-70,000 annually for five years without jeopardizing family finances?
This isn’t about having the cash—it’s about having it without risking your kids’ college funds, your health insurance, or your retirement security.
3. Are you genuinely willing to scale to 300+ cows or pivot to premium markets?
The economics are clear—conventional production under 300 cows faces structural disadvantages that compound annually.
If you answered yes to all three: The path forward requires immediate, aggressive investment in infrastructure and genetics. The documented returns prove the strategy works when fully implemented.
If you answered no to any question: Consider that selling in 2025-2026 with $500,000-$1,000,000 in equity beats farming until 2030 at annual losses, then being forced to liquidate with minimal equity.
These aren’t just business decisions. They’re deeply personal choices about family legacy and identity. There’s honor in building a successful operation that can compete. There’s equal honor in recognizing when it’s time to capture your equity and move forward.
The Bottom Line
Economics drives genetics, not the other way around. Component pricing created incentives in 2000. Genomic testing in 2009 just gave us tools to capitalize efficiently.
Infrastructure determines execution. Operations genomic testing without DHI data, herd software, and systematic records are like buying a Ferrari without roads.
Timing beats perfection. Early adopters who paid $45 per test with 61% reliability captured significantly more value than those who waited for $28 tests with 68% reliability.
Compound advantages are permanent. The three-generation genetic lead early adopters built from 2009-2019 can’t be overcome.
The 30.2% butterfat increase and 23.6% protein increase from 2011-2024 represent what happens when economic signals, biological capabilities, and technological infrastructure finally align. For the roughly 22,000 operations under 200 cows remaining in 2025, the question isn’t whether to adopt genomic testing—it’s whether they have the infrastructure, capital, and succession plan to compete.
The operations thriving in 2030 won’t necessarily be those with the best cows or the hardest-working families. They’ll be those who made clear-eyed infrastructure investments in 2025 based on economic reality rather than tradition.
As a dairy farmer once told me: “The cows don’t know if you’re milking 50 or 5,000. But the economics sure do.”
Key Takeaways
- Economics drove genetics, not vice versa: Component pricing created the signal in 2000; genomics provided the tools in 2009. Winners understood the sequence—losers still don’t.
- The $1.3M early adopter advantage is permanent: Paying $45/test in 2009 beat waiting for $28 tests in 2015. In rapidly evolving markets, timing beats perfection every time.
- Infrastructure trumps genetics: Only 35% of herds have DHI testing. Without data infrastructure, genomic testing is like buying a Ferrari without roads.
- The $366,375 gap can’t be managed away: Operations under 200 cows face structural, not operational, disadvantages. Excellence can’t overcome economics.
- Your 2025 reality check: You need a successor AND $50K annual investment capacity AND willingness to scale/pivot. Missing any one = exit strategy, not growth strategy.
Complete references and supporting documentation are available upon request by contacting the editorial team at editor@thebullvine.com.
Learn More:
- The New Math of Dairy Genetics: Why This Balanced Breeding Thing is Finally Clicking – This article provides a tactical implementation guide for the main article’s thesis. It reveals methods for multi-trait selection and a “five-of-six rule,” demonstrating how to translate economic signals into a disciplined, profitable breeding strategy that avoids chasing single-trait extremes.
- 2025 Dairy Market Reality Check: Why Everything You Think You Know About This Year’s Outlook is Wrong– Expanding on the economic theme, this strategic analysis examines future market dynamics. It explores how Federal Order reforms, new processing capacity, and volatile export markets will create regional winners and losers, offering a forward-looking view of the risks and opportunities ahead.
- The Tech Reality Check: Why Smart Dairy Operations Are Winning While Others Struggle – The main article argues infrastructure determines survival; this piece reveals the ROI reality of that technology. It provides a crucial financial analysis of robotic systems and health monitors, showing what benchmarks must be hit to ensure tech investments generate profit, not debt.
 Join the Revolution!
 Join the Revolution!
Join over 30,000 successful dairy professionals who rely on Bullvine Weekly for their competitive edge. Delivered directly to your inbox each week, our exclusive industry insights help you make smarter decisions while saving precious hours every week. Never miss critical updates on milk production trends, breakthrough technologies, and profit-boosting strategies that top producers are already implementing. Subscribe now to transform your dairy operation’s efficiency and profitability—your future success is just one click away.


