$3,010 heifers. 30% labor jump. A 650-cow Wisconsin dairyman told me: ‘The math that worked five years ago just doesn’t add up anymore.’ He’s right—and here’s the survival playbook for mid-size operations.
EXECUTIVE SUMMARY: The math that worked for mid-size dairies in 2019 doesn’t work anymore—and this isn’t a cyclical downturn waiting to correct itself. Replacement heifers hit $3,010 per head (up 75% since 2023), labor reached $19.52/hour (up 30% since 2020), and rate increases added $840,000 to the lifetime cost of typical barn financing. Operations milking 300-800 cows are stuck in the ‘mushy middle’: too large for family labor, too small for scale economics that make 1,000+ cow herds consistently profitable. Export tailwinds are fading—Mexico’s $4.1 billion domestic dairy investment and China’s 12% import drop signal permanent shifts. Three paths forward remain viable: scaling past 2,000 cows with strong balance sheets, premium positioning through organic or specialty programs, or partnership models sharing infrastructure costs. Operations missing three or more key benchmarks—cost under $17/cwt, labor efficiency of 50-60 cows/FTE, debt-to-asset under 40%—need strategic reassessment now, not later. The producers still hoping 2026 looks like 2019, risk becoming the cautionary tales others reference.
I had coffee with a producer friend in central Wisconsin a few weeks back. Runs about 650 cows, third generation, solid genetics, consistently good production numbers. He expanded his freestall barn in 2019—good timing, good financing, everything done right by the book.
But something he said stuck with me: “The math that worked five years ago just doesn’t add anymore. And I keep wondering if I’m missing something or if the whole game changed.”
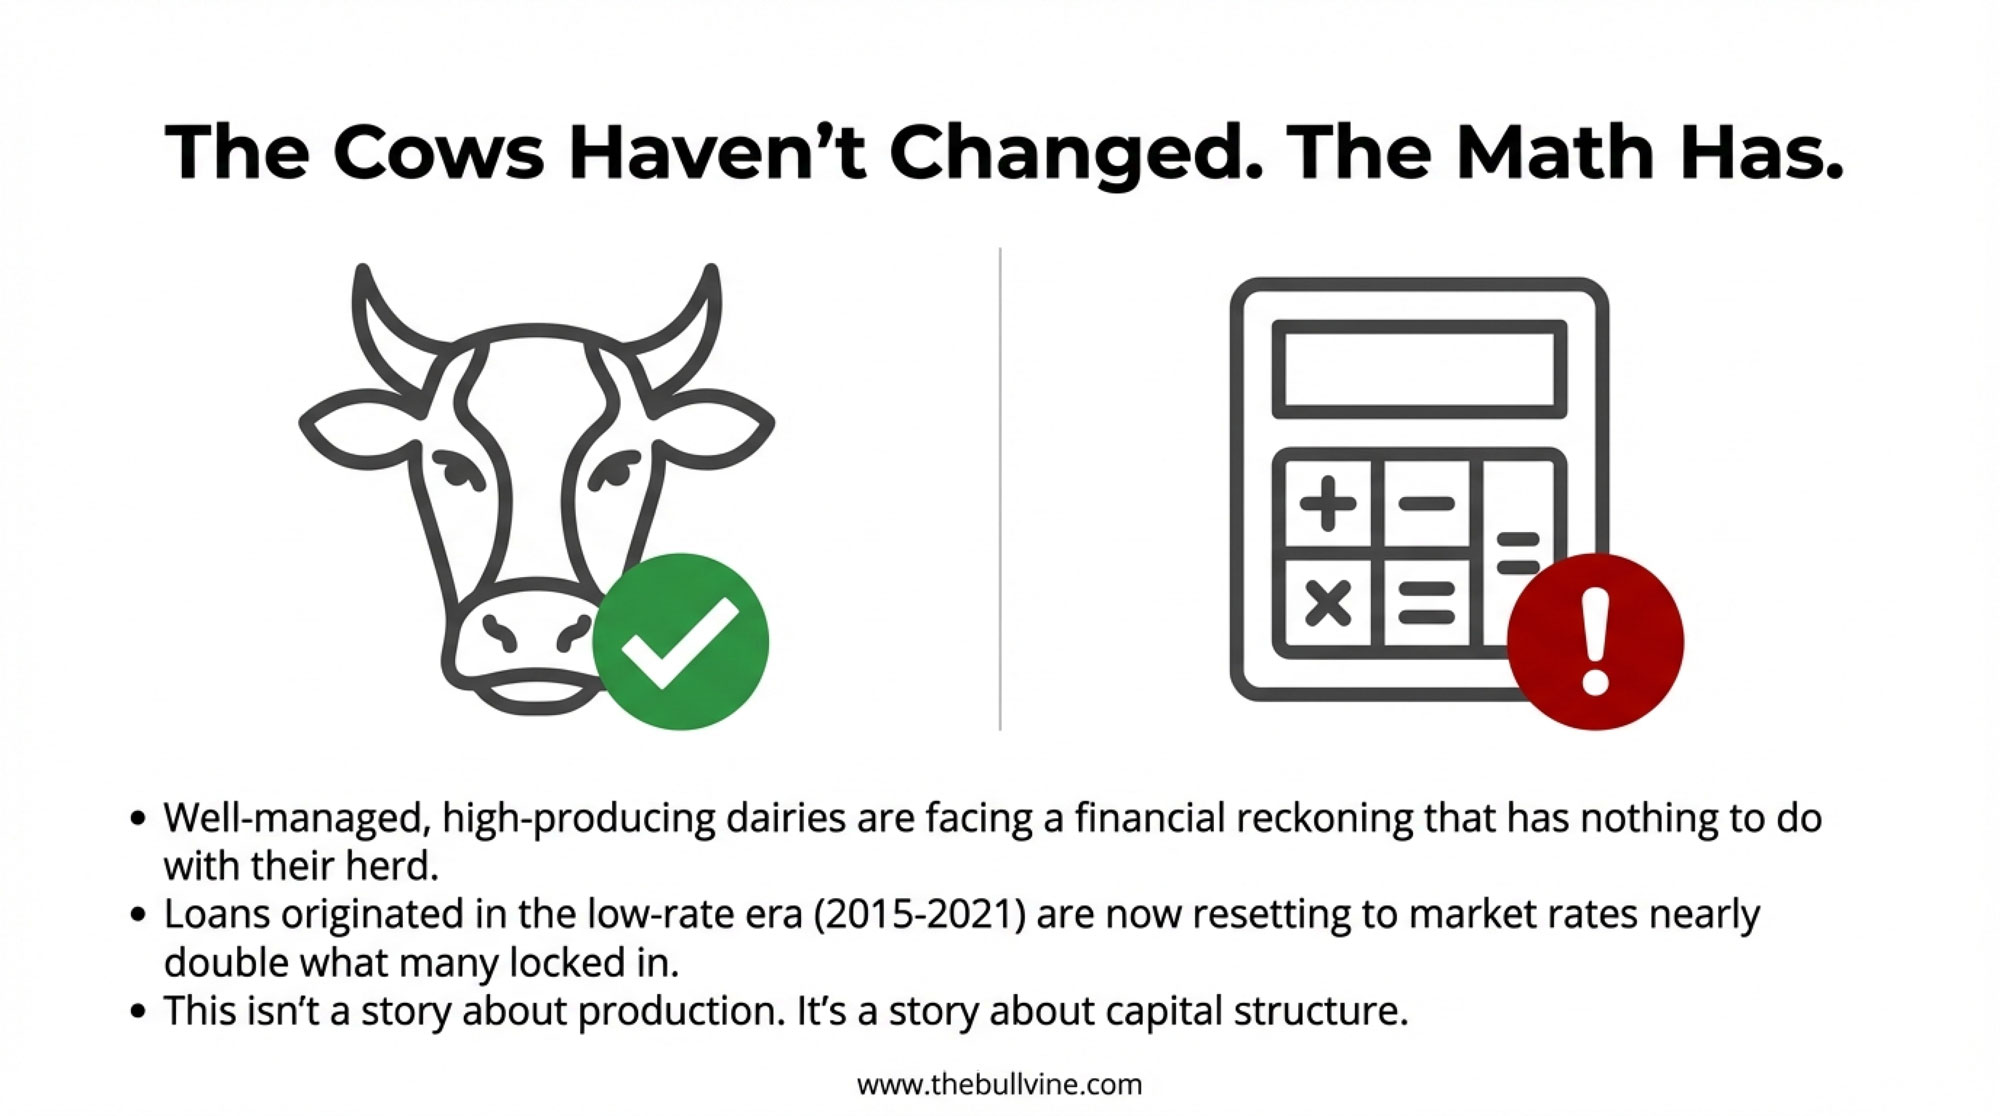
He’s not missing anything. The game really did change.
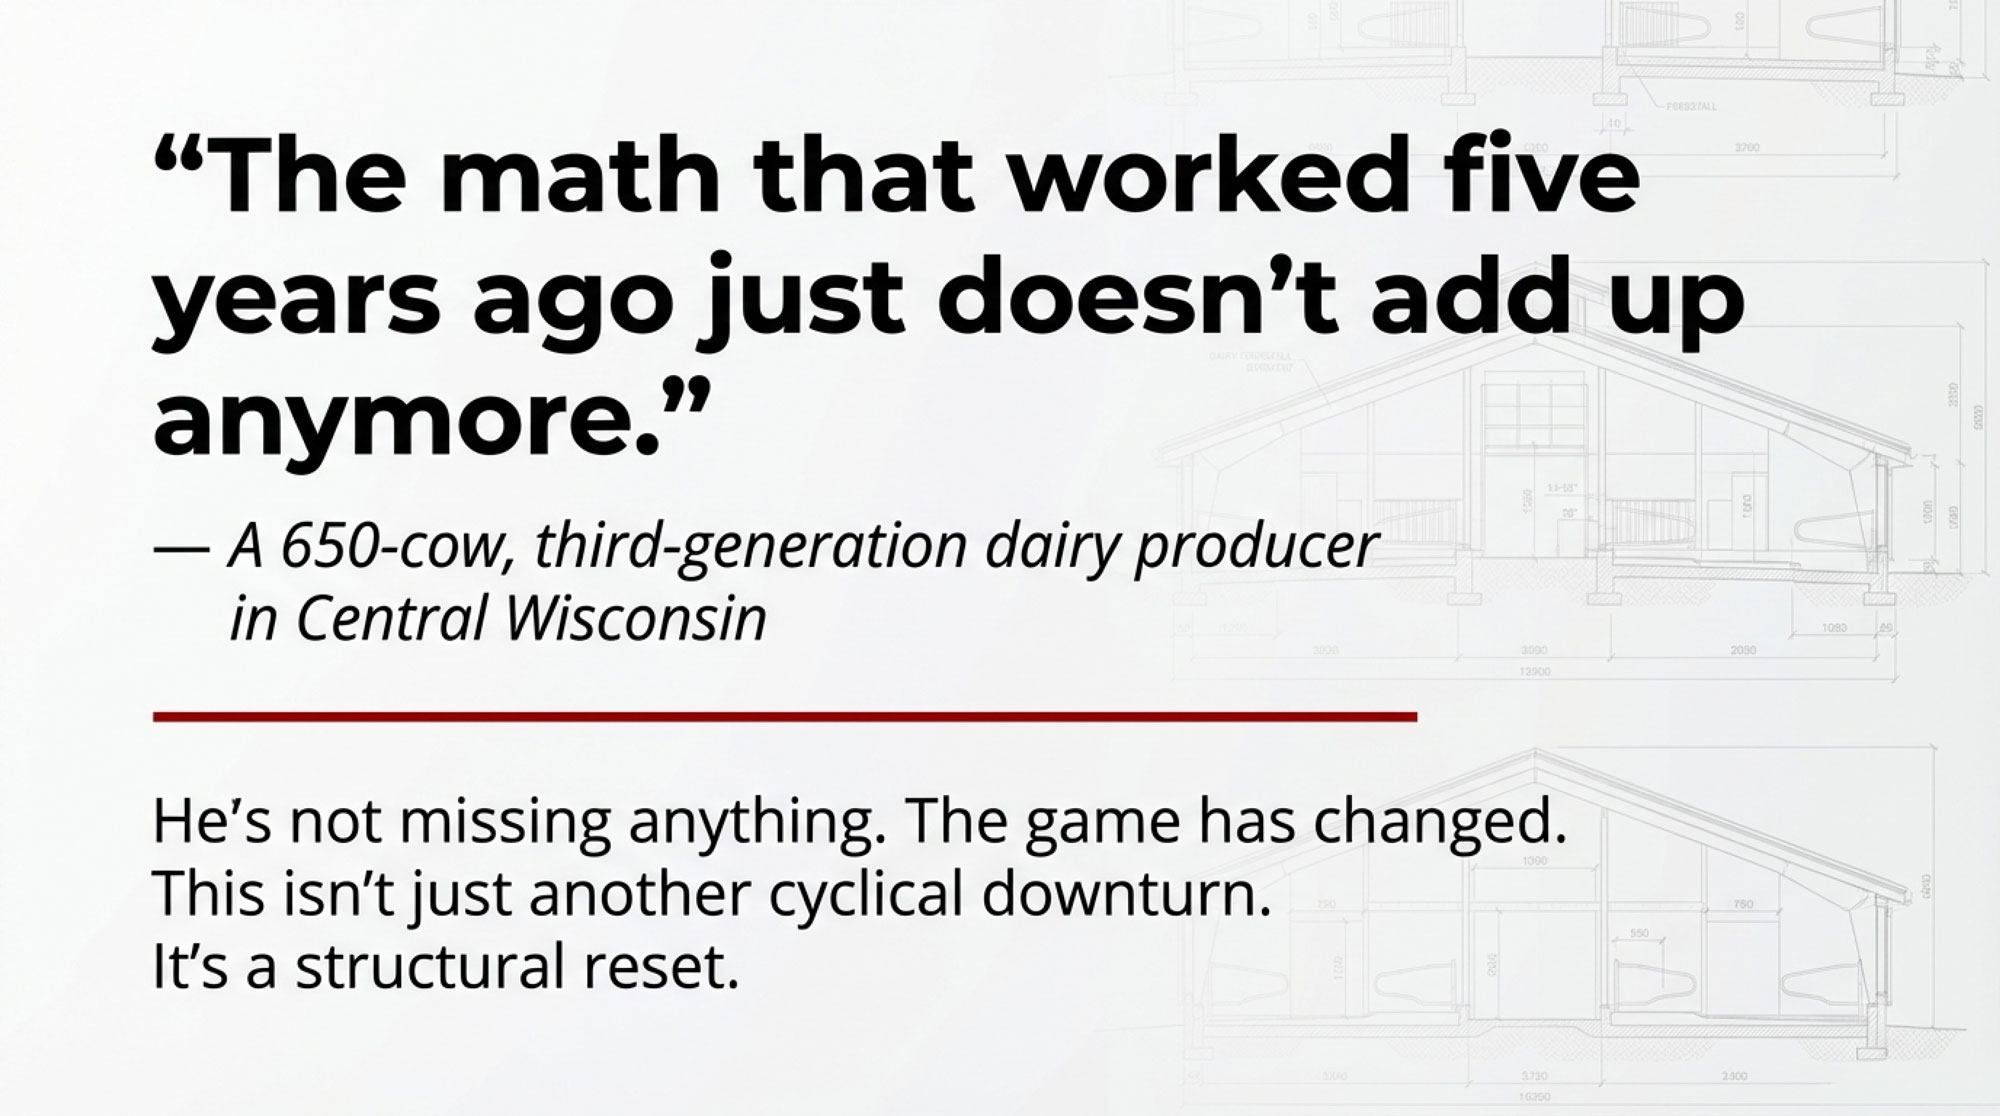
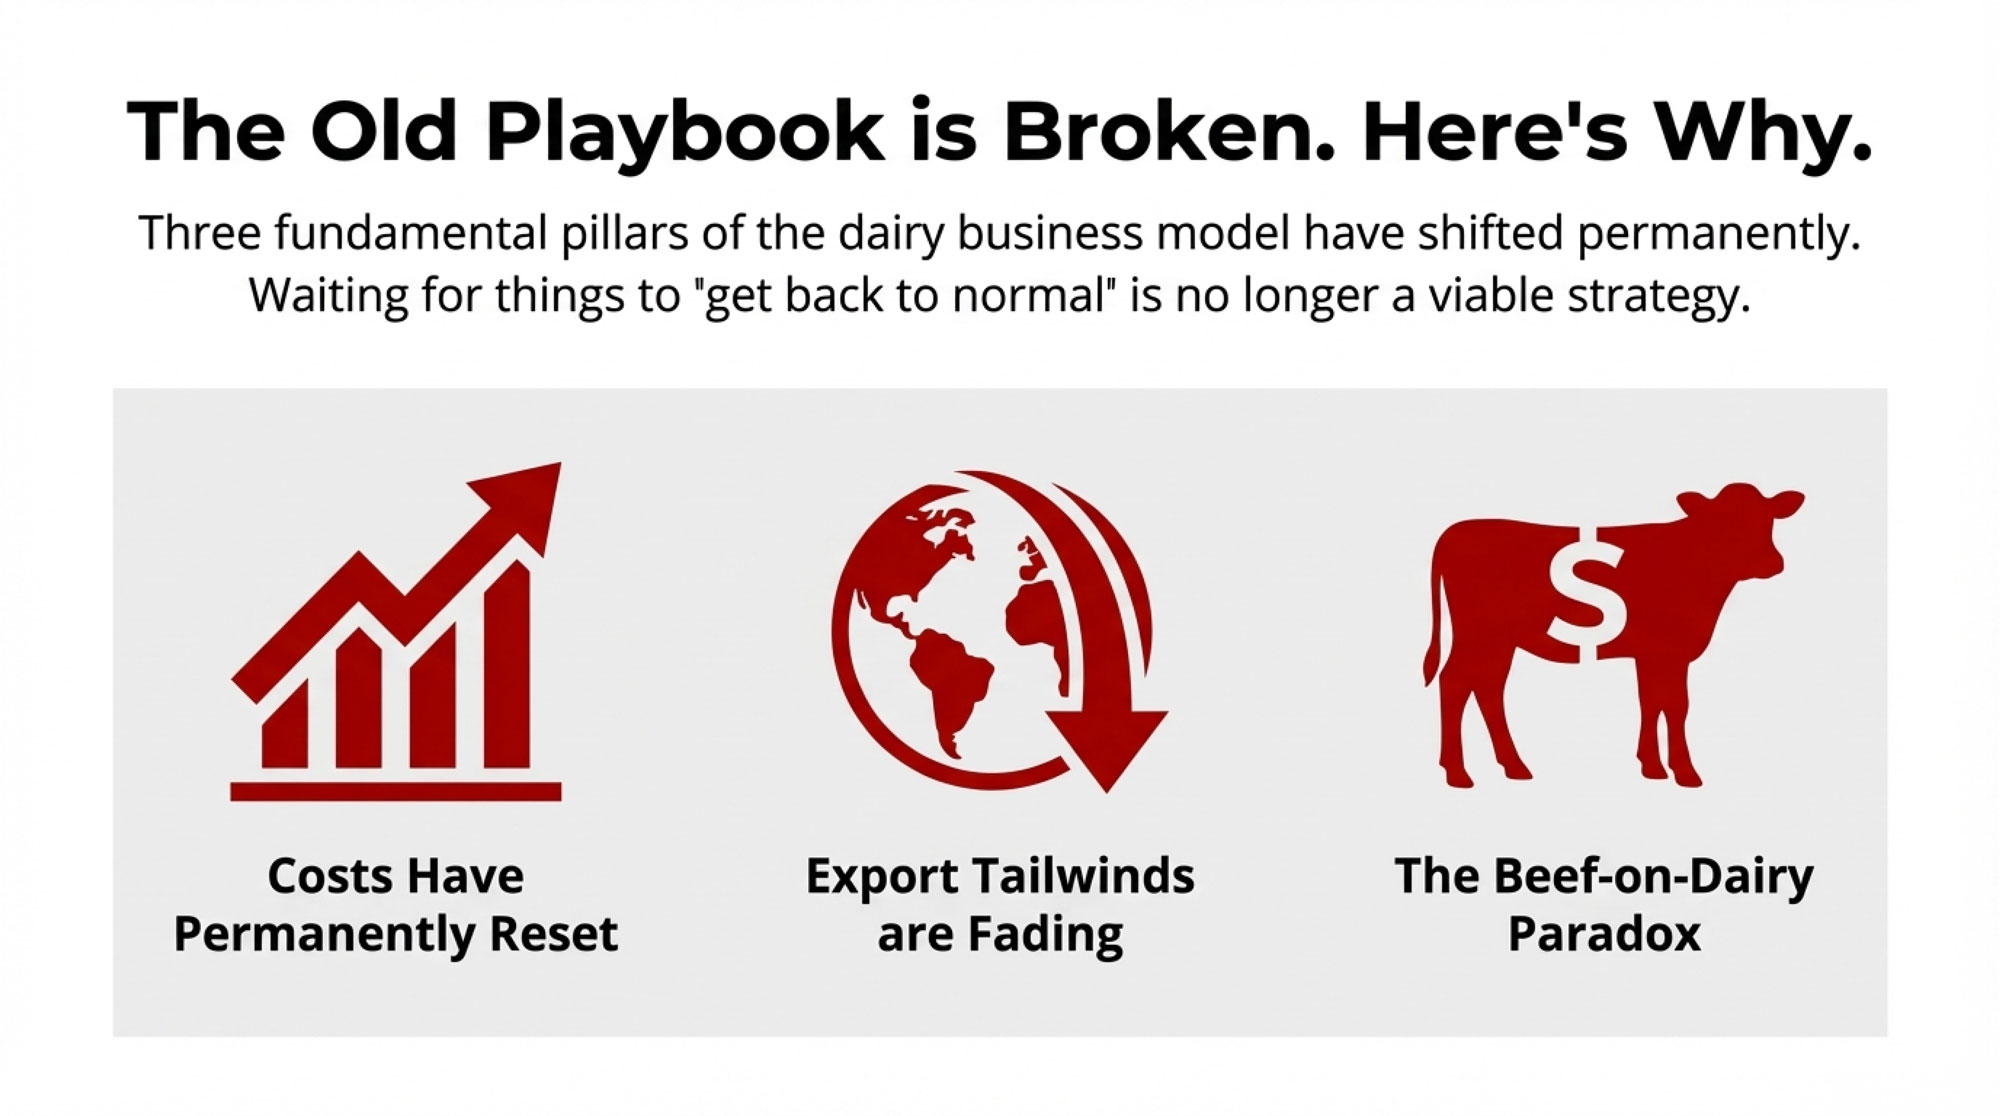
As we look toward 2026, it’s becoming clear that we’re not simply weathering another cyclical downturn—the kind where you tighten the belt, wait for better prices, and emerge stronger on the back end. Several fundamental pillars of the traditional dairy business model have shifted, and understanding those shifts is essential for making sound decisions over the next few years.
“The math that worked five years ago just doesn’t add up anymore.” — Central Wisconsin dairy producer, 650-cow operation
Why Different Farms Are Having Such Different Experiences
Purdue University’s Ag Economy Barometer from August 2025 found that crop farms showed financial stress rates around 6.5%—nearly triple the rate reported by livestock operations. Sentiment surveys consistently show livestock farmers running more optimistic than their crop and dairy neighbors, sometimes in the very same counties.
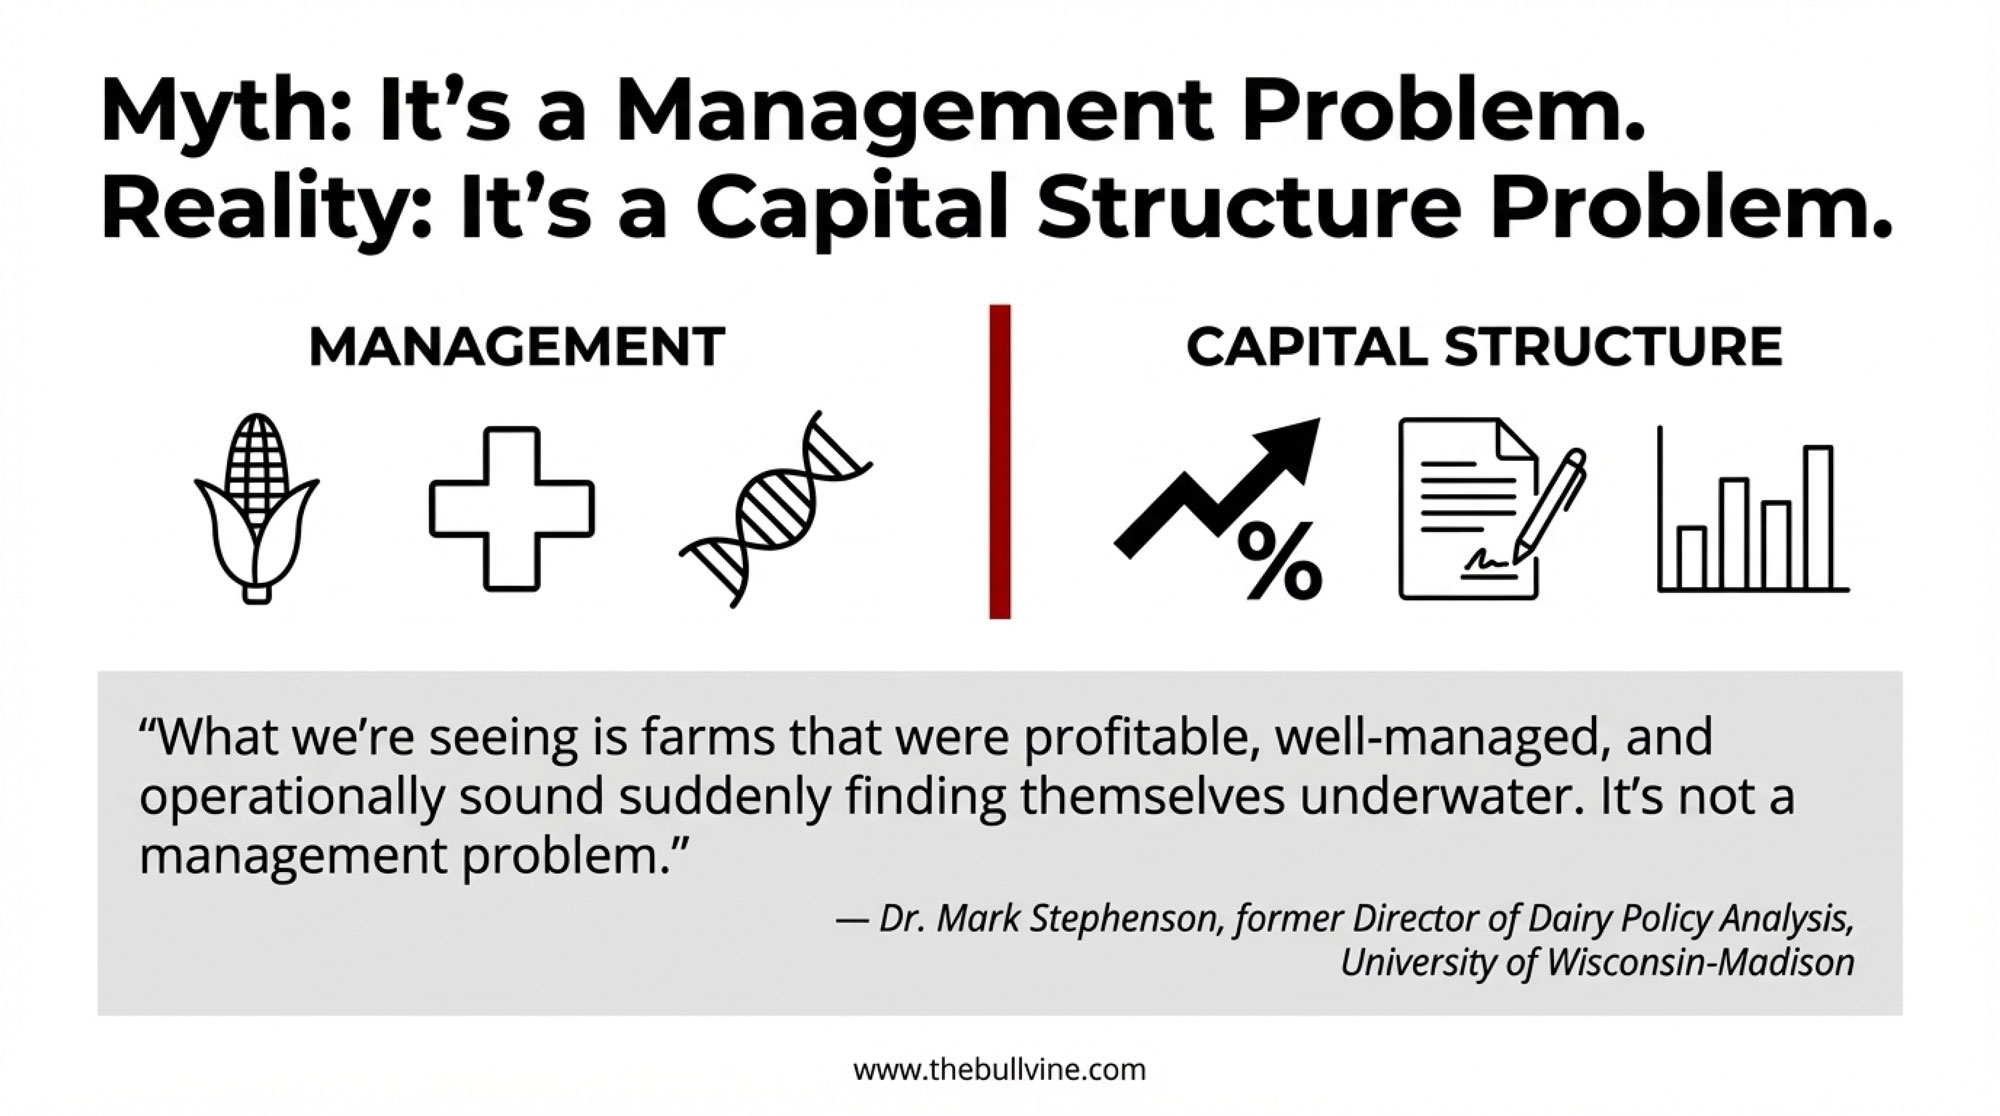
Why the gap? Much of it traces back to how capital gets deployed.
Here’s the reality of dairy economics: a substantial majority of assets are tied up in specialized infrastructure—milking parlors, freestall barns, manure handling systems. These are illiquid, depreciating assets. Research from the Wisconsin Center for Dairy Profitability has shown this pattern repeatedly: as capital investment per cow climbs, return on assets tends to compress.
A cattle feeding operation under margin pressure can reduce placements, turn cattle more quickly, and adjust in real time. A dairy operation doesn’t have that flexibility. Once you’ve built infrastructure for 500 cows, you’re milking roughly 500 cows every single day, regardless of where prices sit.
What’s Really Happening with Costs
Good news first: feed costs have moderated meaningfully. USDA’s Agricultural Prices Report showed dairy feed costs at $9.38 per hundredweight this past August—the lowest monthly reading since late 2020. That’s genuine relief after several difficult years.
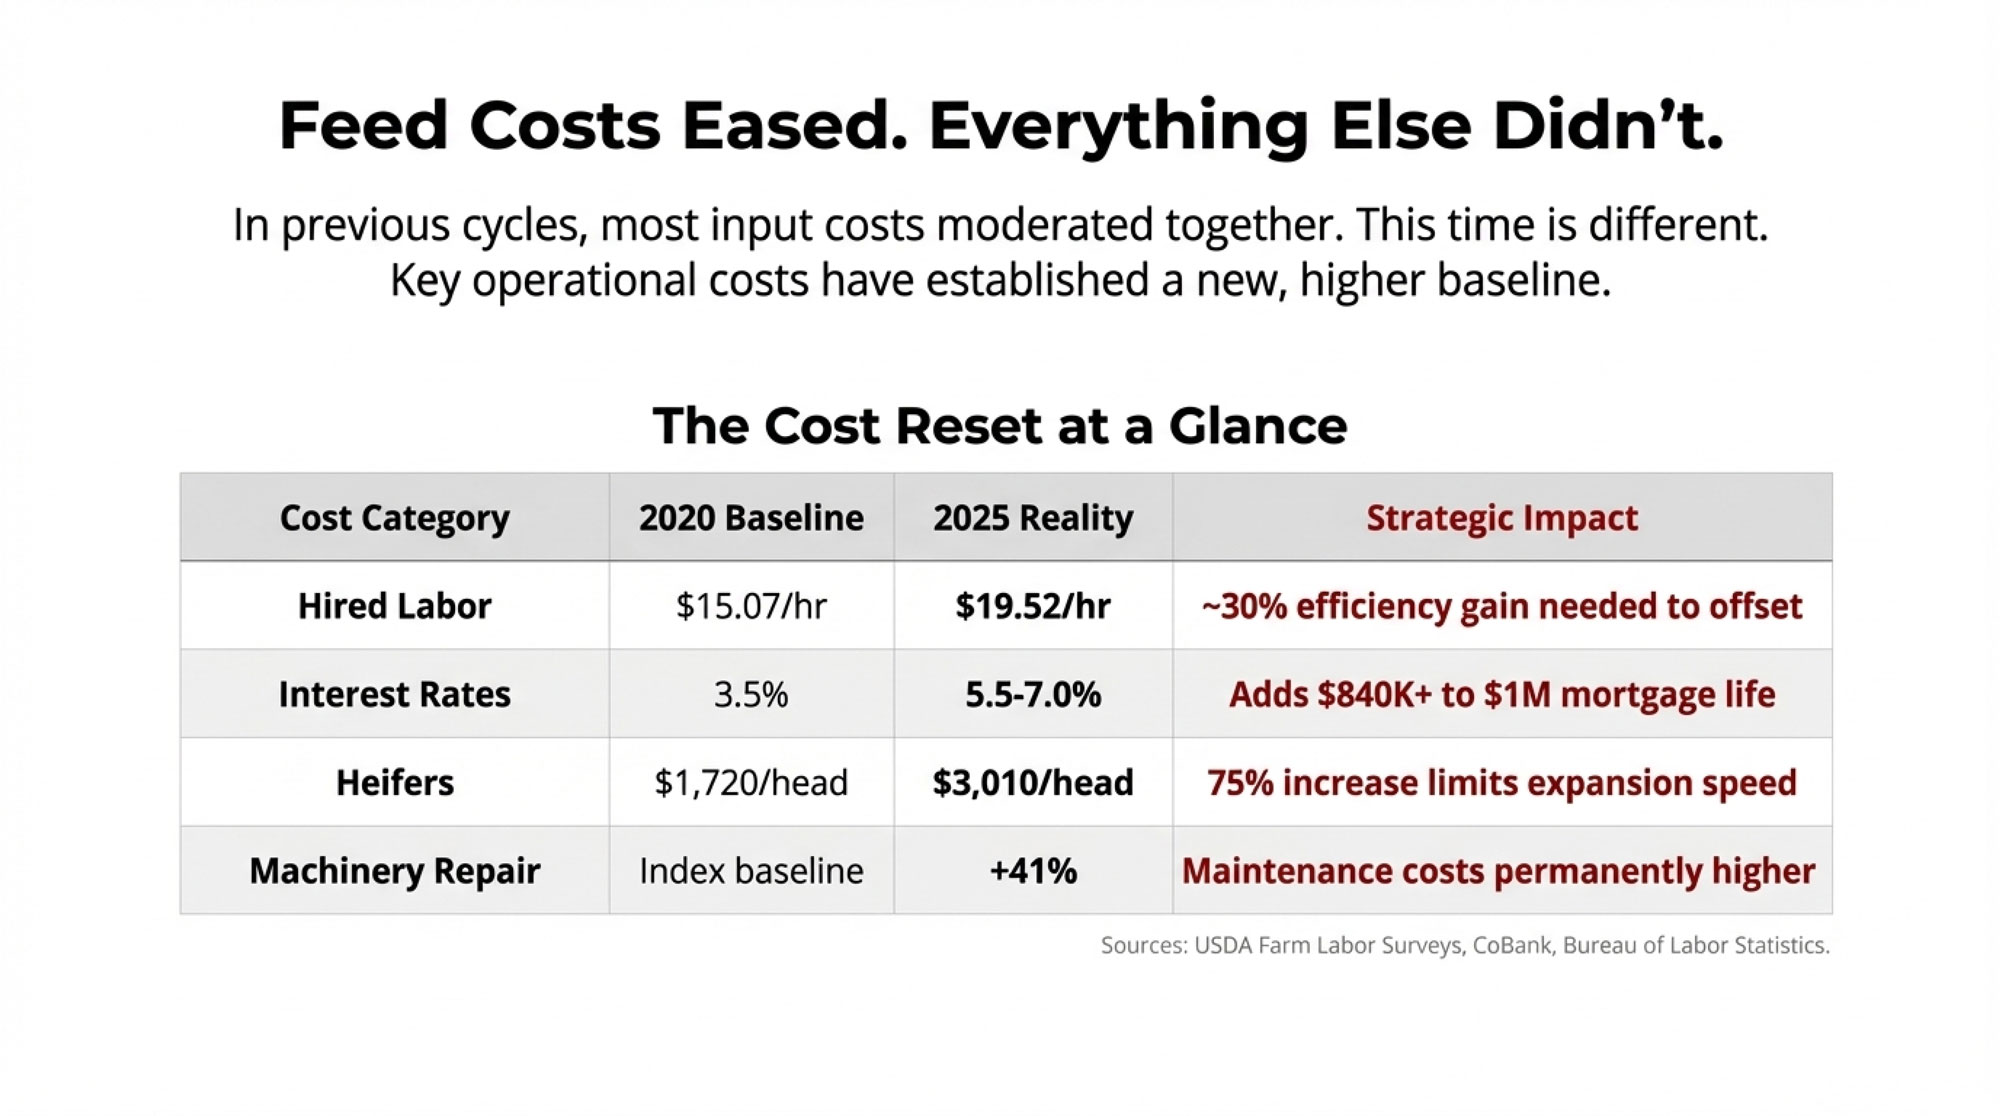
But here’s what concerns me. In previous downturns, nearly all input costs eventually moderated together. This cycle looks different. Feed came down, but most other major cost categories have reset to what appear to be permanently higher levels.
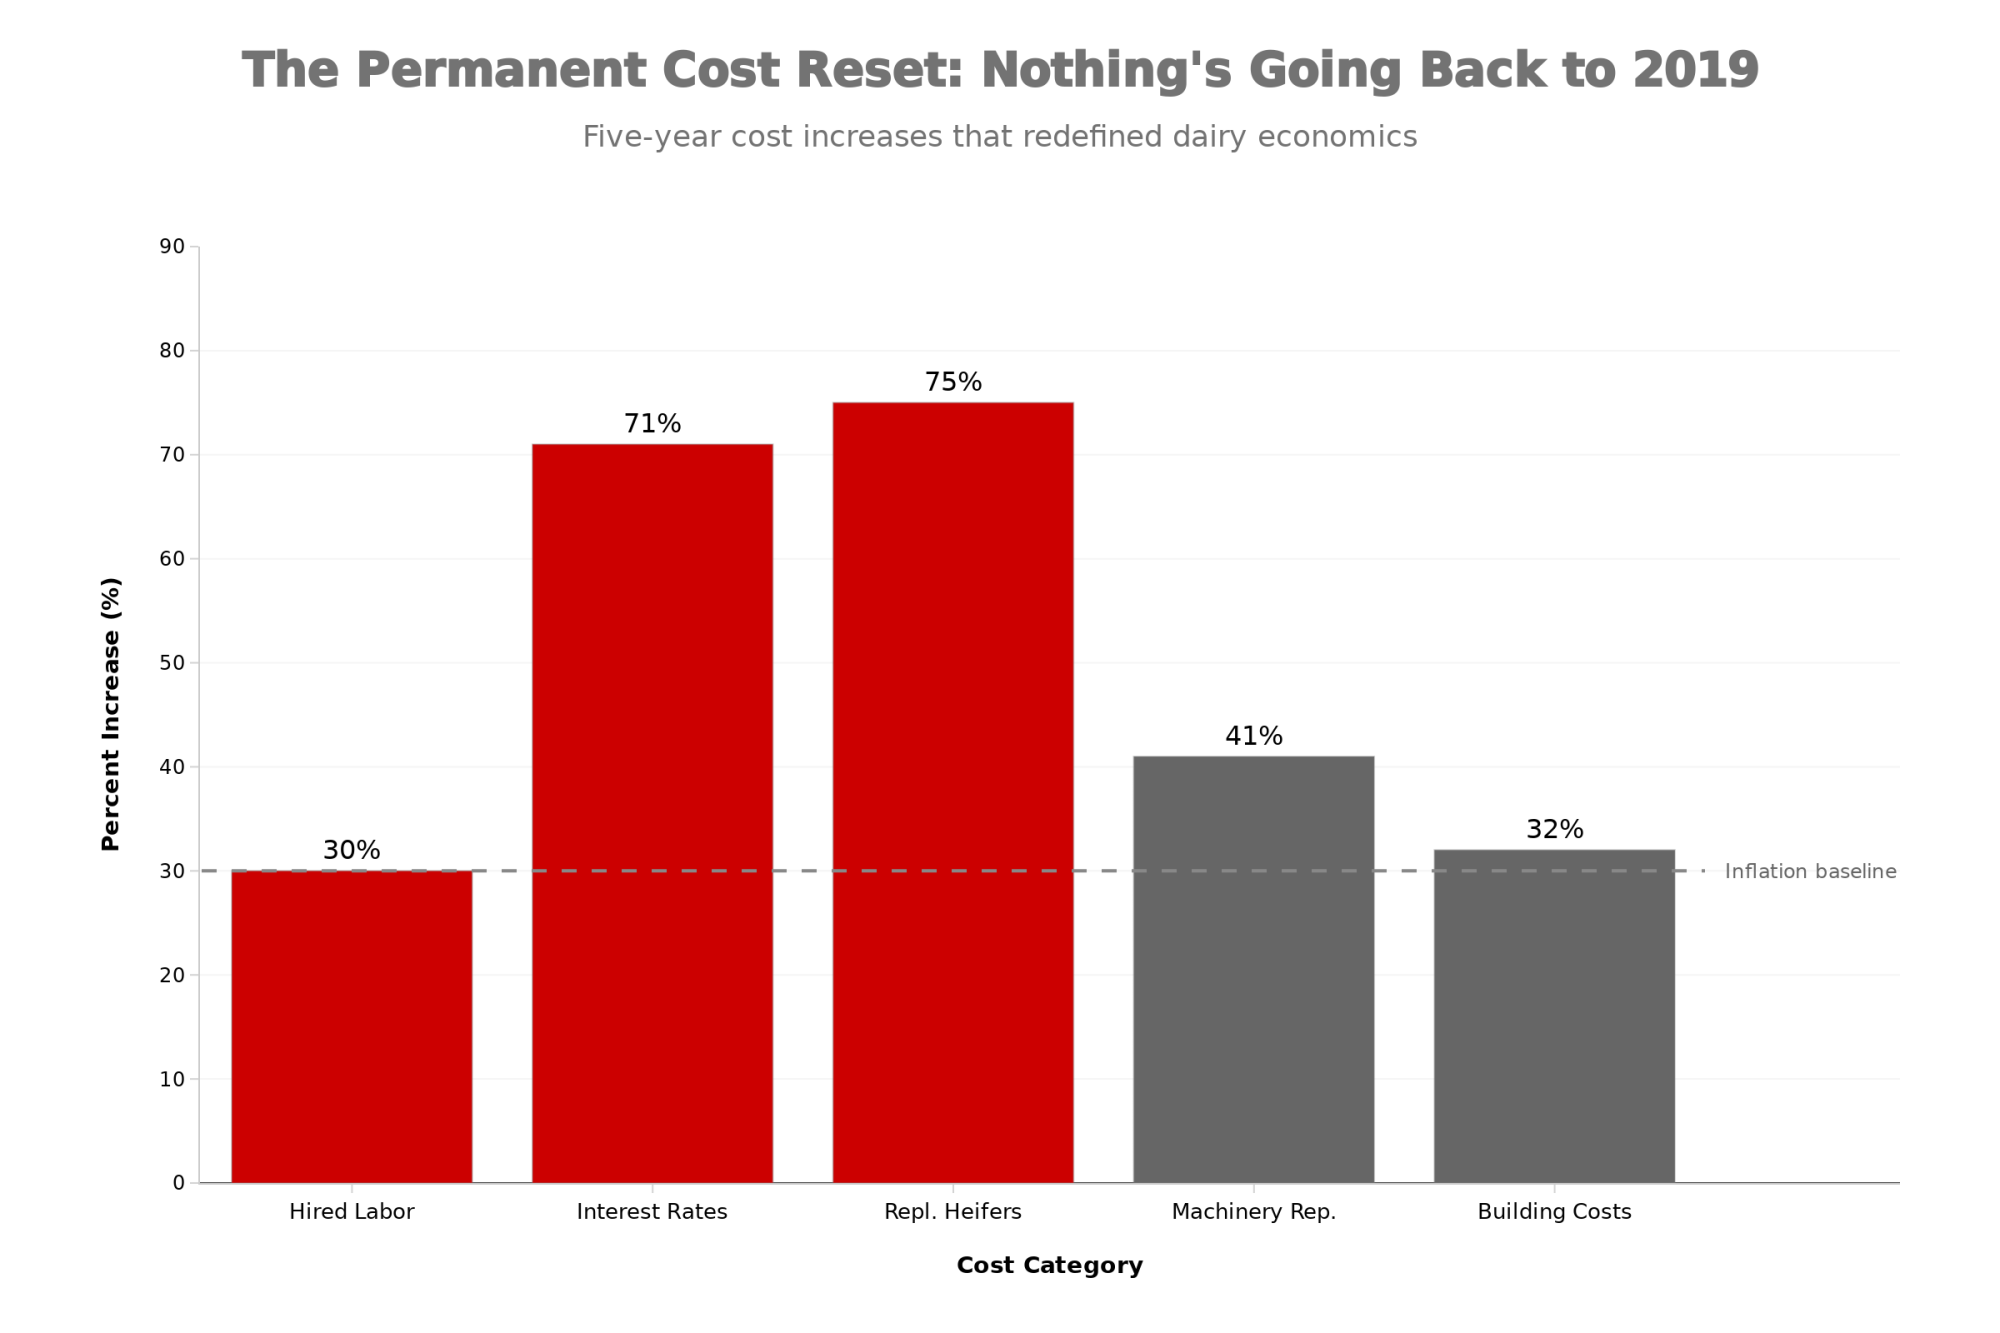
The Cost Reset at a Glance
| Cost Category | 2020 Baseline | 2025 Reality | Strategic Impact |
| Hired Labor | $15.07/hr (USDA April 2020) | $19.52/hr (USDA May 2025) | Requires ~30% efficiency gain to offset |
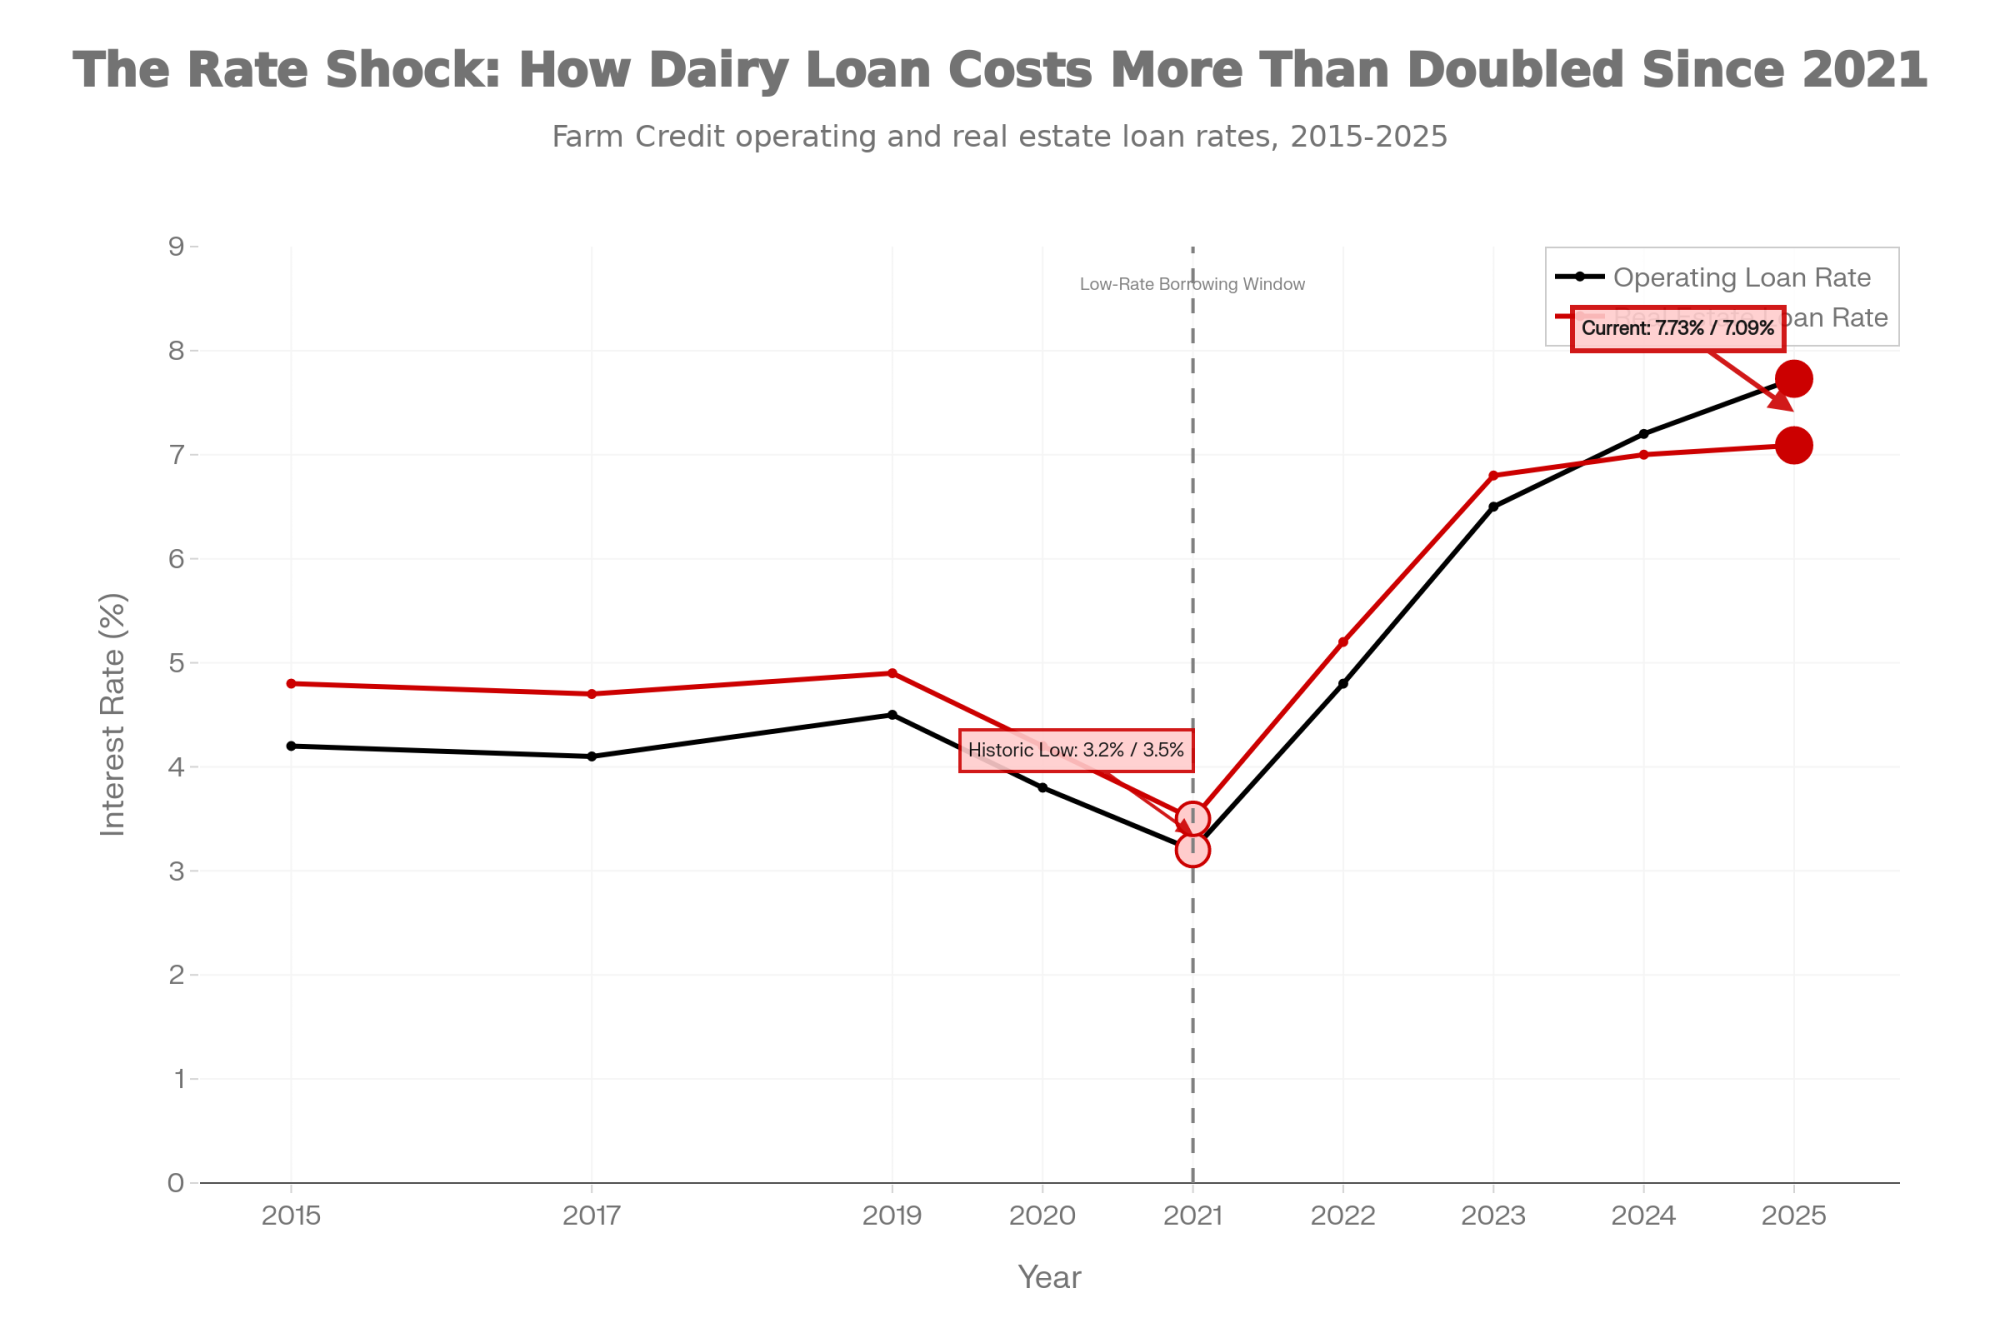
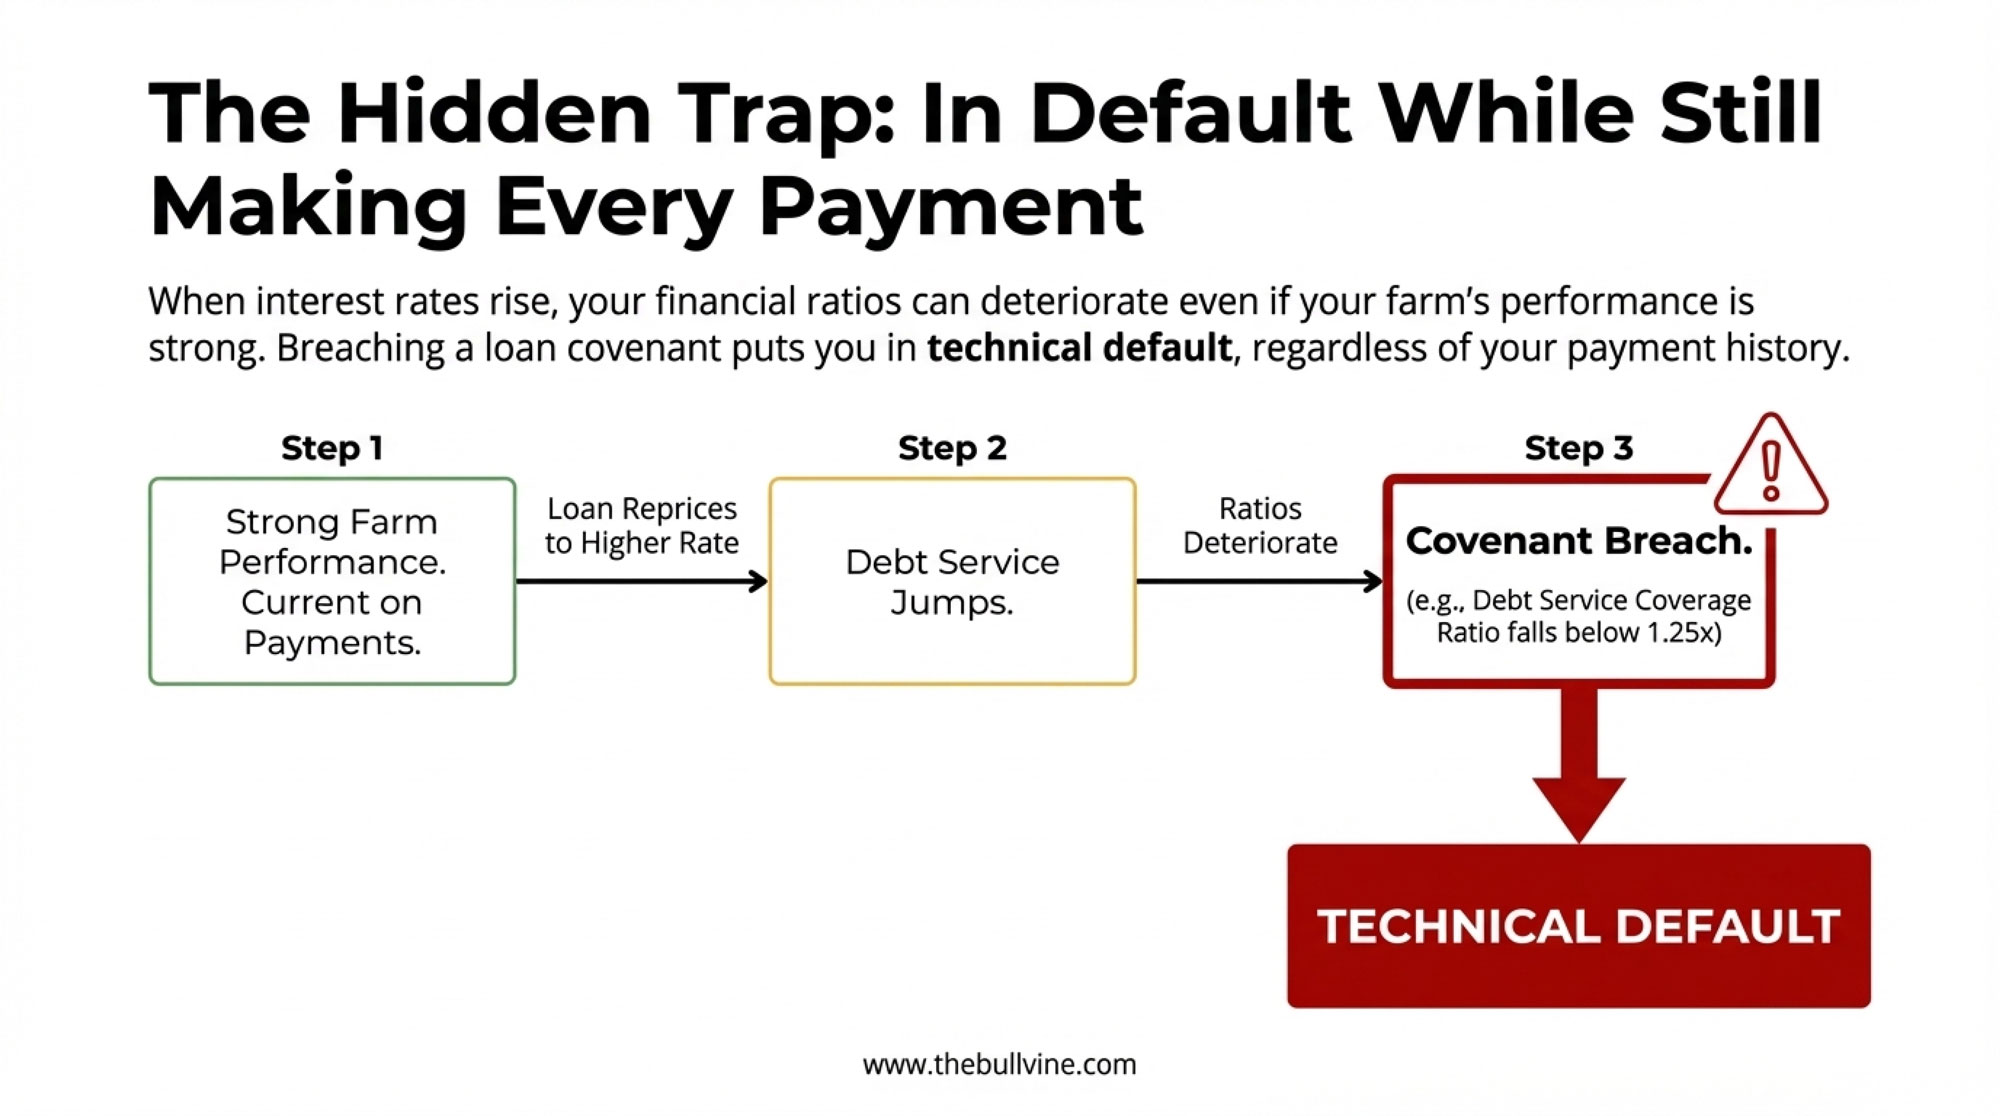
| Interest Rates | 3.5% (historic lows) | 5.5-7.0% (commercial) | Adds $840K to $1M mortgage over loan life |
| Replacement Heifers | $1,720/head (April 2023) | $3,010/head (July 2025) | 75% increase limits expansion speed |
| Machinery Repair | Index baseline 2020 | +41% (BLS 2025) | Maintenance costs are permanently higher |
| Building Costs | 2021 baseline | +25-40% (materials + codes) | New construction ROI fundamentally changed |
Sources: USDA Farm Labor Surveys (2020, 2025), USDA FSA rate schedules, CoBank Knowledge Exchange, Bureau of Labor Statistics
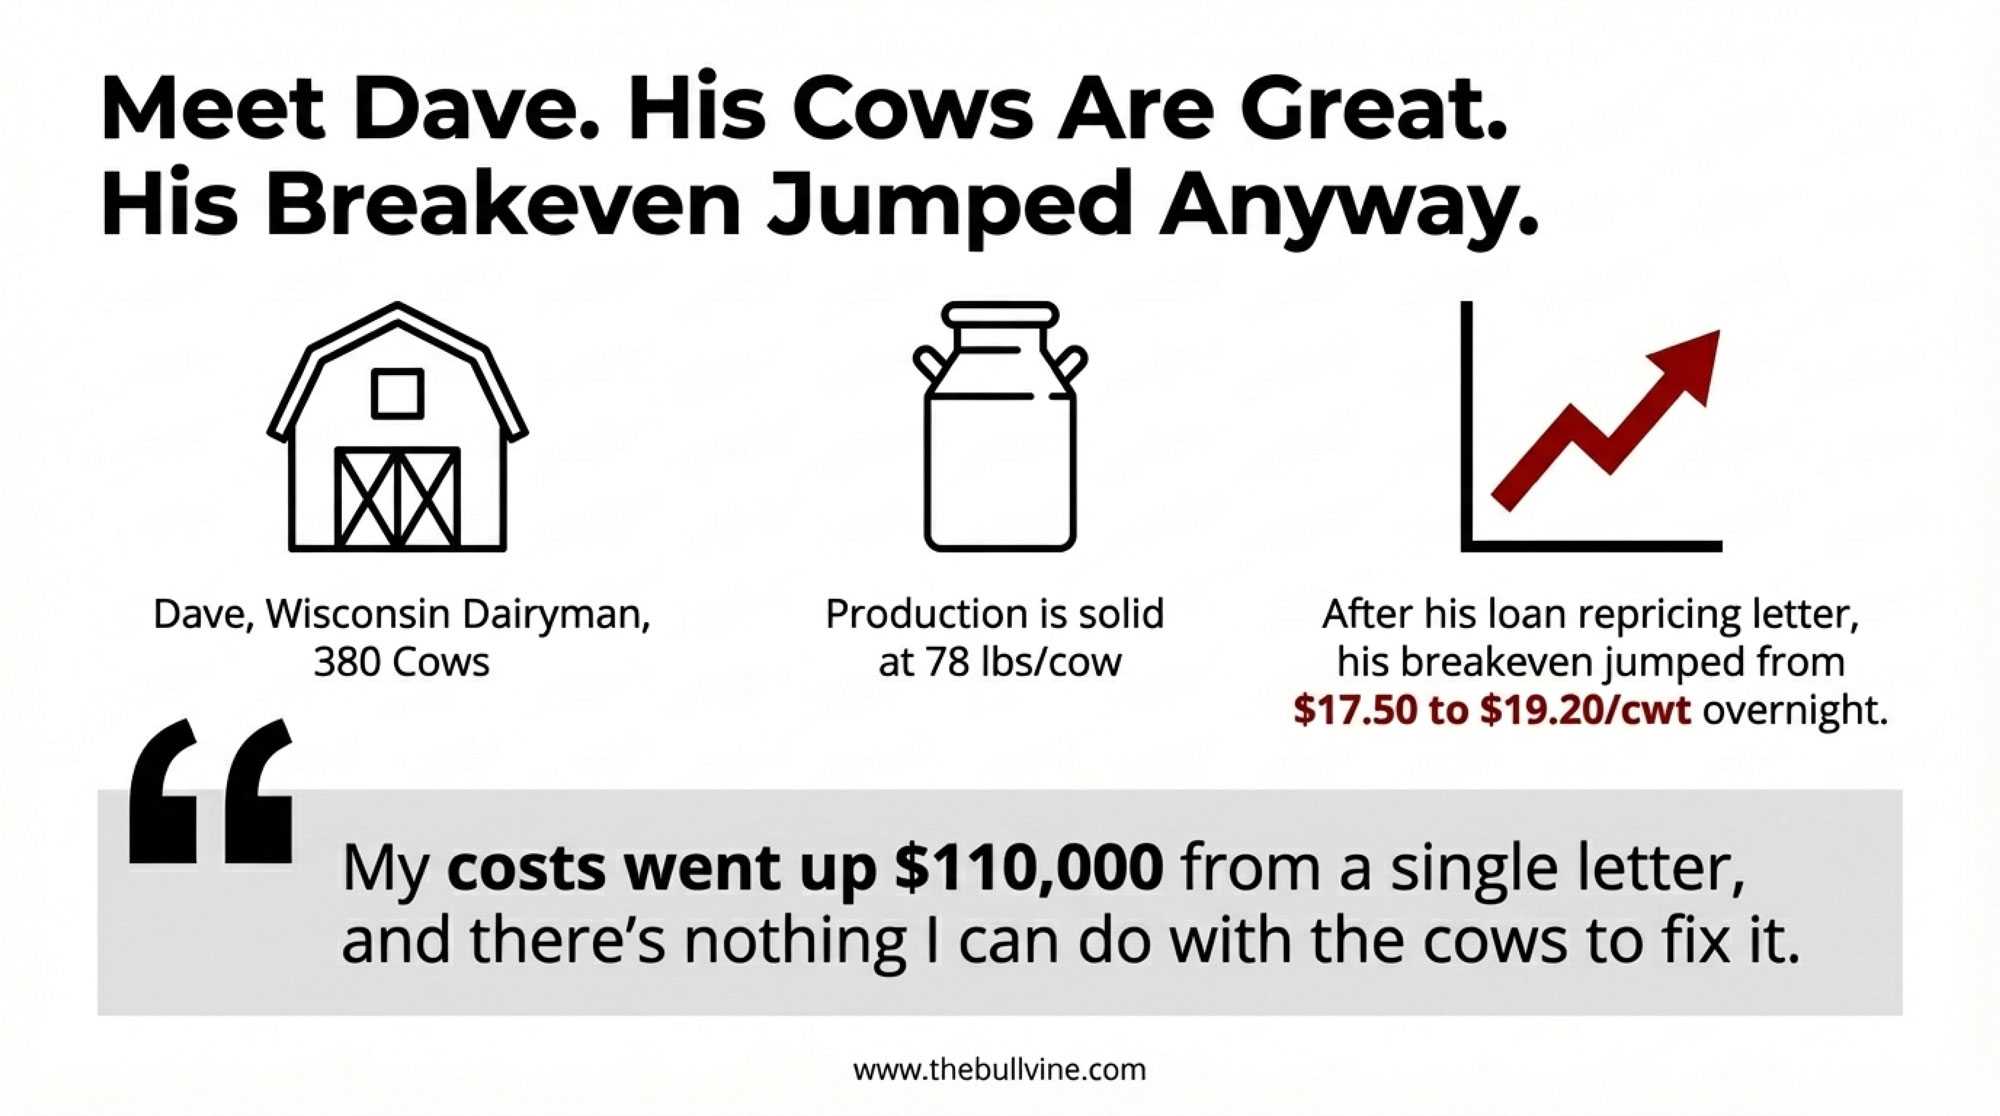
My Wisconsin friend’s 2019 expansion? Those interest rates look very different now. He locked in around 4%. Anyone evaluating the same project today faces rates pushing 6-7% on commercial loans.
These figures represent national averages. California operations typically face higher labor and regulatory costs. For Canadian operations, supply management creates a different dynamic entirely—quota values shift the strategic calculus in ways that don’t directly translate from U.S. benchmarks.
Labor illustrates this most clearly. The American Farm Bureau Federation’s analysis shows farm labor costs reaching record territory in 2025—USDA’s Economic Research Service projects labor expenses at $53.7 billion nationally. The May 2025 USDA Farm Labor Survey showed that operators paid $19.52 per hour on average, up 30% from $15.07 in April 2020.
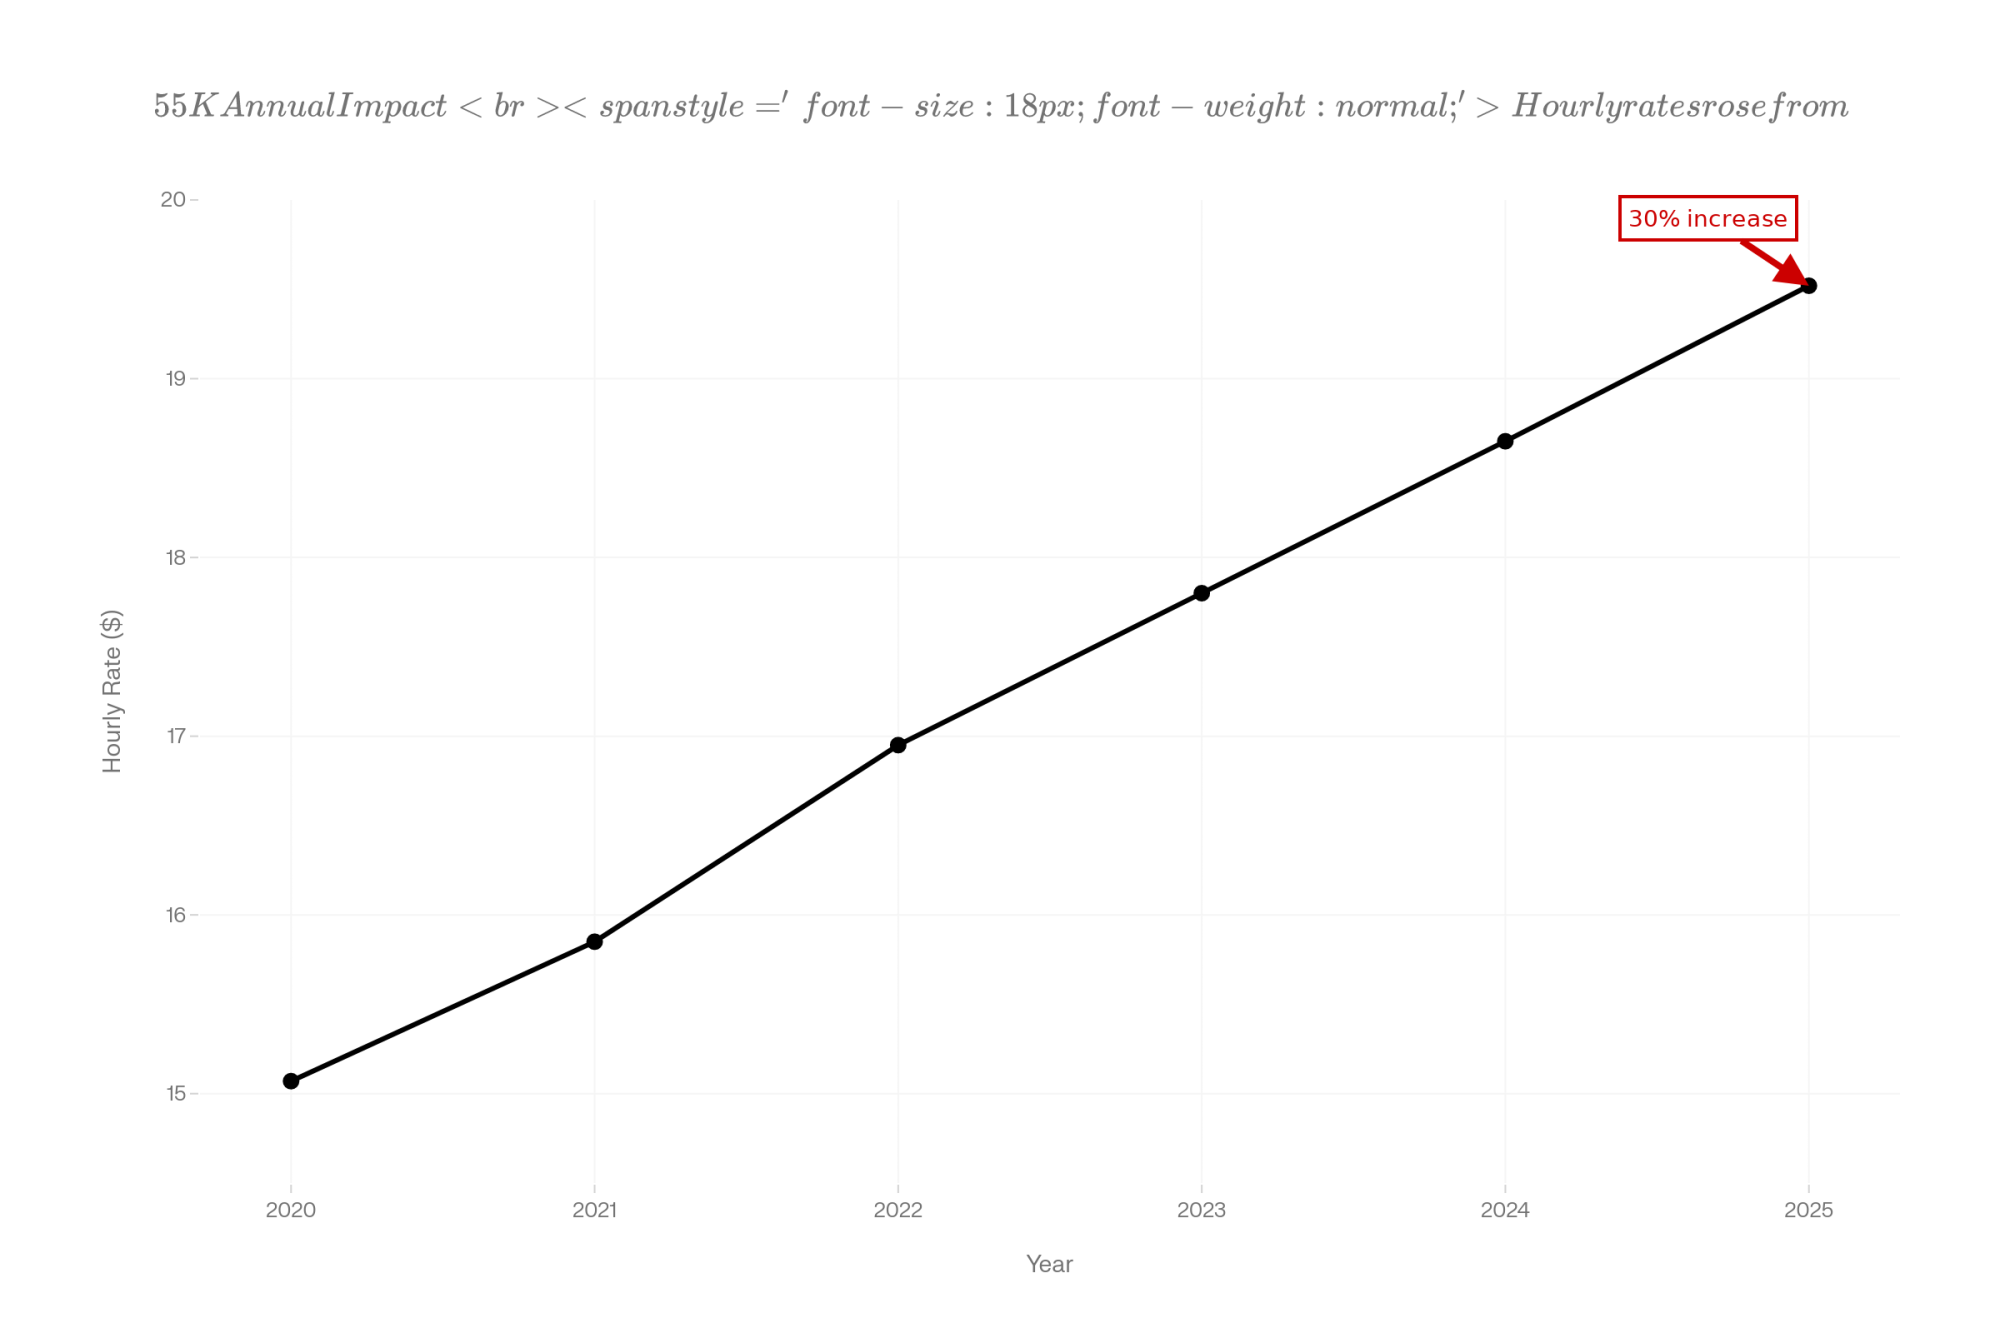
Anyone who’s tried hiring lately knows the challenge firsthand. Competing industries keep bidding up wages, and the workforce available today simply expects more than it did five years ago. That’s not a criticism—it’s market reality.
Interest rates fundamentally changed expansion economics. Analysis from the Daily Dairy Report illustrates the math starkly: on a 30-year mortgage of $1 million, moving from around 3.5% to over 7% increases monthly payments by more than $2,300. Over the loan’s life, that’s nearly $840,000 in additional interest expense.
Equipment and construction costs reset higher as well. Bureau of Labor Statistics data shows farm machinery repair costs spiked 41% since 2020 alone. Ontario operations are navigating new agricultural building codes in 2025 that are estimated to add 15-35% to construction costs.
The Export Landscape: Meaningful Shifts Underway
Export dynamics deserve attention because they’ve underpinned expansion assumptions for the past 15 years.
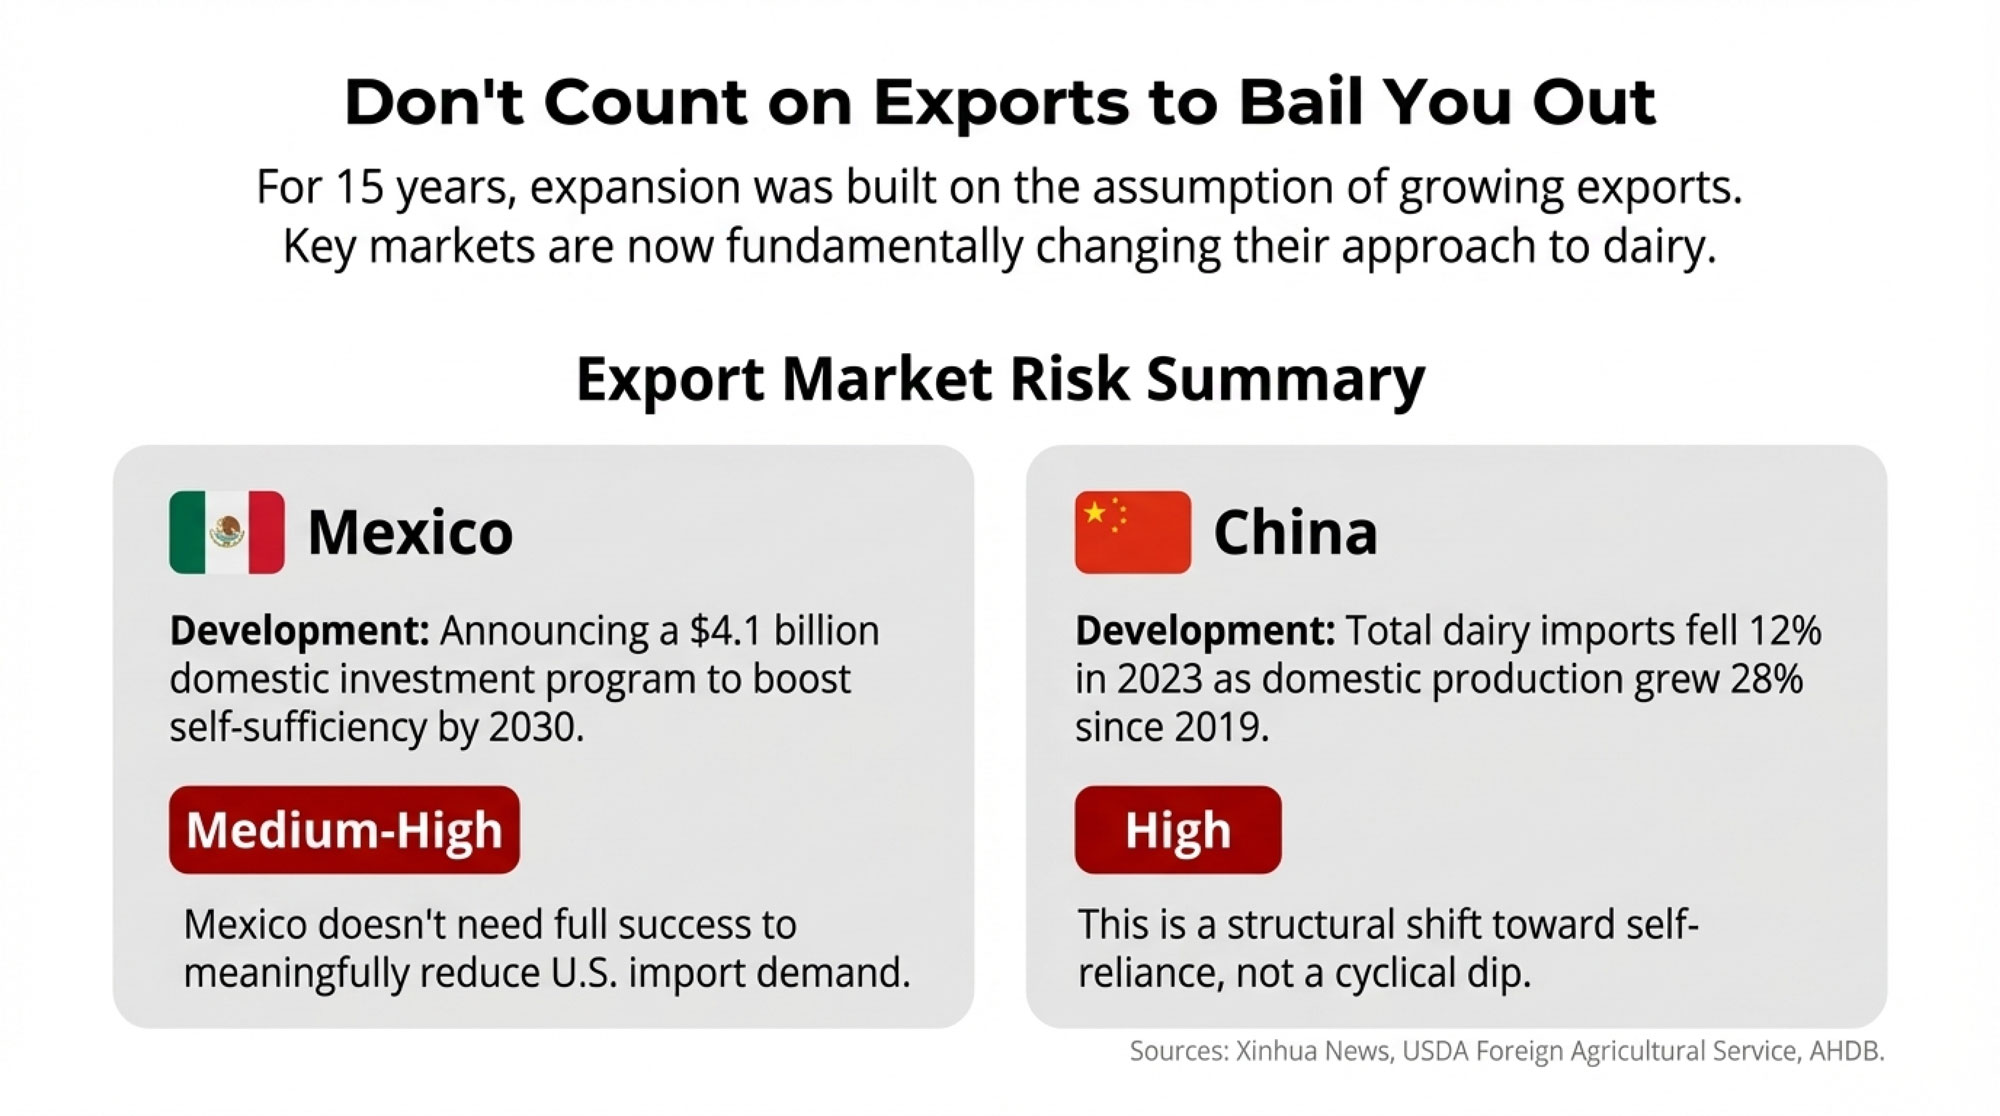
Mexico launched a significant self-sufficiency initiative. In April 2025, Xinhua News reported that the Mexican government announced a $4.1 billion investment program running through 2030 to increase domestic milk production. The Secretaría de Agricultura y Desarrollo Rural outlined specific projects—new pasteurization and milk drying facilities across multiple states.
Will Mexico achieve these ambitious targets? Honestly, that’s genuinely uncertain. Water scarcity and enormous productivity gaps between regions present challenges. But here’s the insight worth considering: Mexico doesn’t need full success to affect U.S. export volumes. Even partial achievement would meaningfully reduce demand.
China’s import patterns have shifted structurally. Customs data shows total Chinese dairy imports fell 12% to 2.6 million tonnes in 2023. Meanwhile, domestic production reached 41 million tonnes annually—up 28% from 2019according to the USDA Foreign Agricultural Service and AHDB analysis.
Export Market Risk Summary
| Export Market | 2025 Development | Risk Level for U.S. Dairy |
| Mexico | $4.1B domestic investment through 2030 | Medium-High: Even partial success reduces demand |
| China | Imports -12%; domestic production +28% since 2019 | High: Structural shift, not cyclical |
| Domestic | Fluid milk declining; yogurt/cottage cheese growing | Moderate: Growth can’t absorb 2.5-3% production increases |
Beef-on-Dairy: Understanding the Complete Picture
Beef-on-dairy has delivered meaningful revenue for many operations. Day-old beef-cross calves command substantially higher prices than a few years ago, with some operations reporting six-figure annual revenue additions.
But a broader dynamic is developing.
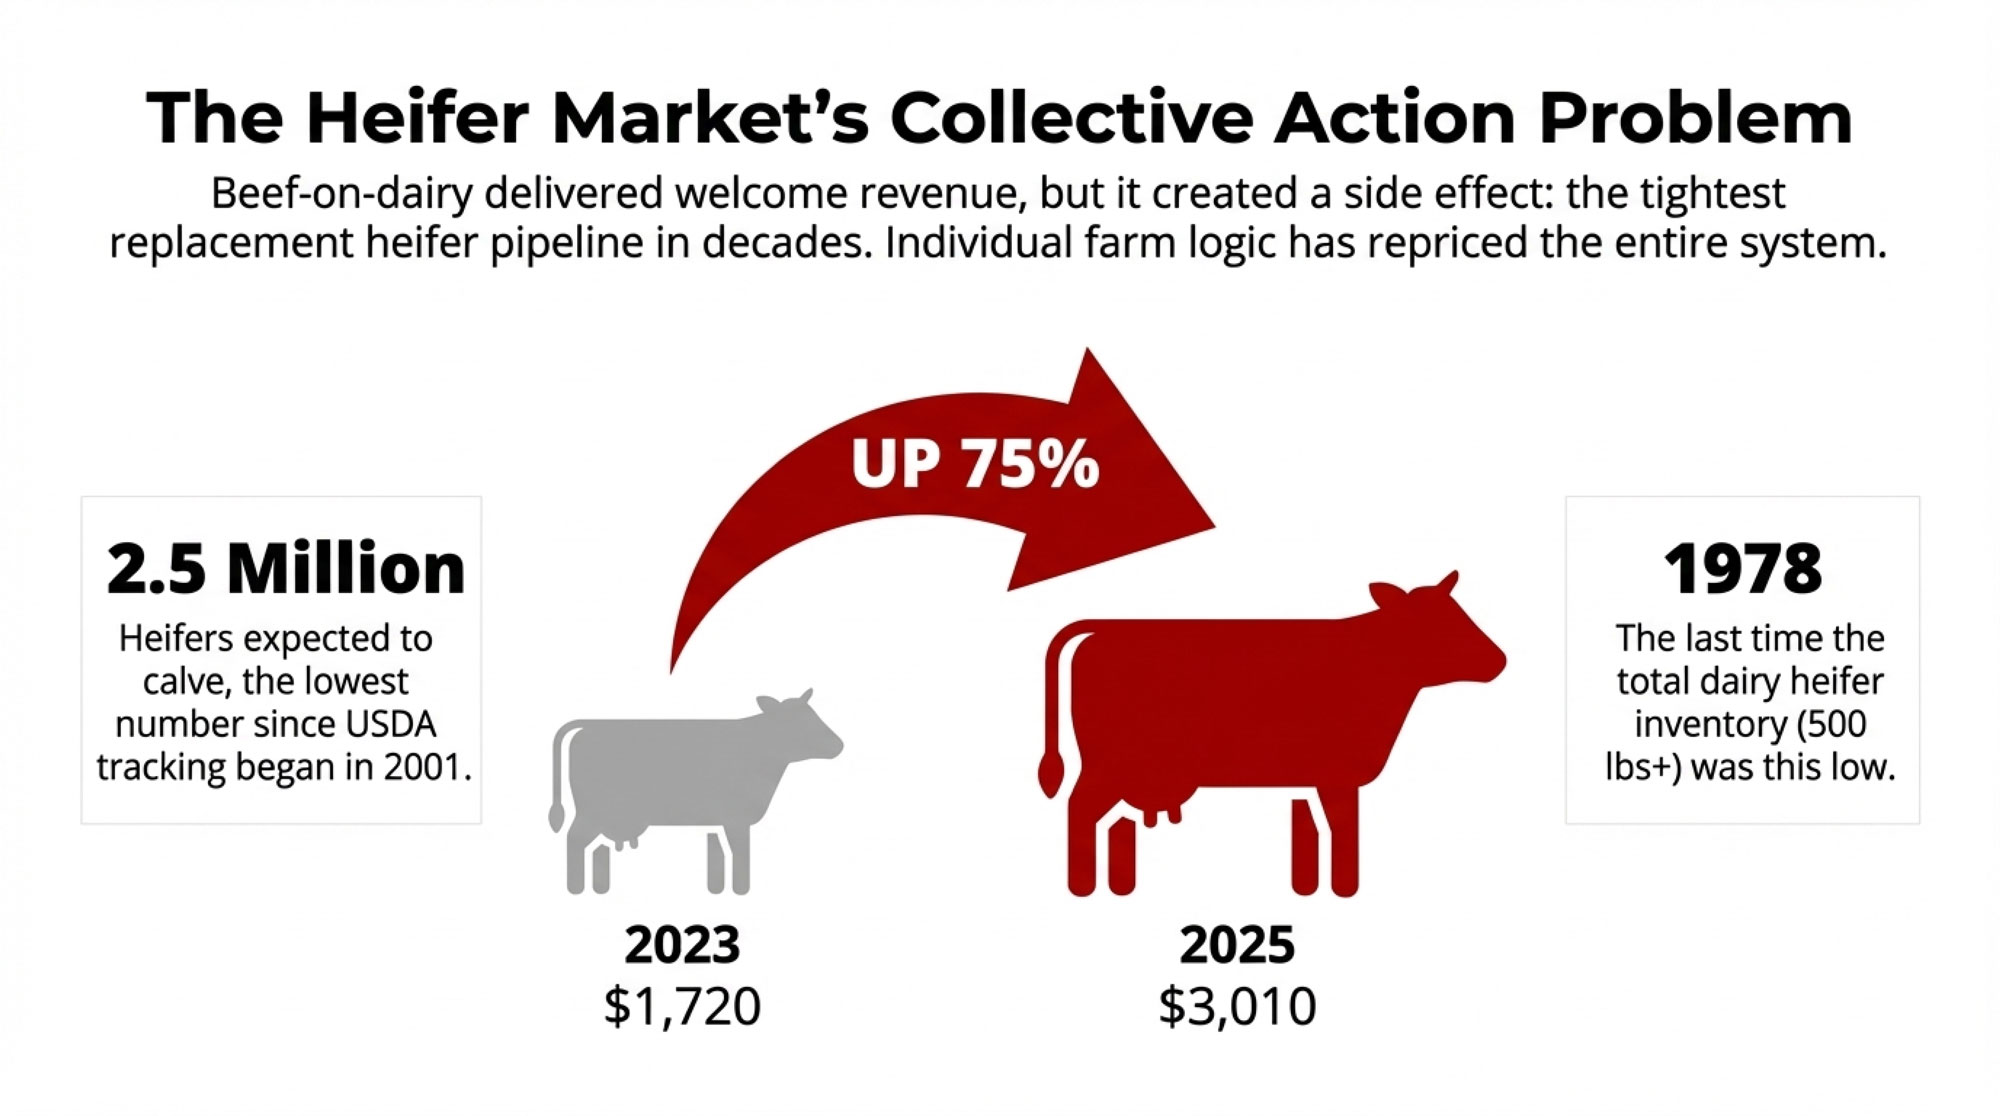
As more operations breed to beef semen, the replacement heifer pipeline has tightened considerably. HighGround Dairy analysis shows heifers expected to calve totaled just 2.5 million head as of January 2025—the lowest since USDA began tracking in 2001. Total dairy heifers weighing 500 pounds or more reached only 3.914 million head, the smallest inventory since 1978, according to USDA data.
CoBank’s Knowledge Exchange division projects 357,490 fewer dairy heifers in 2025 compared to 2024, with an additional 438,844-head decline expected in 2026.
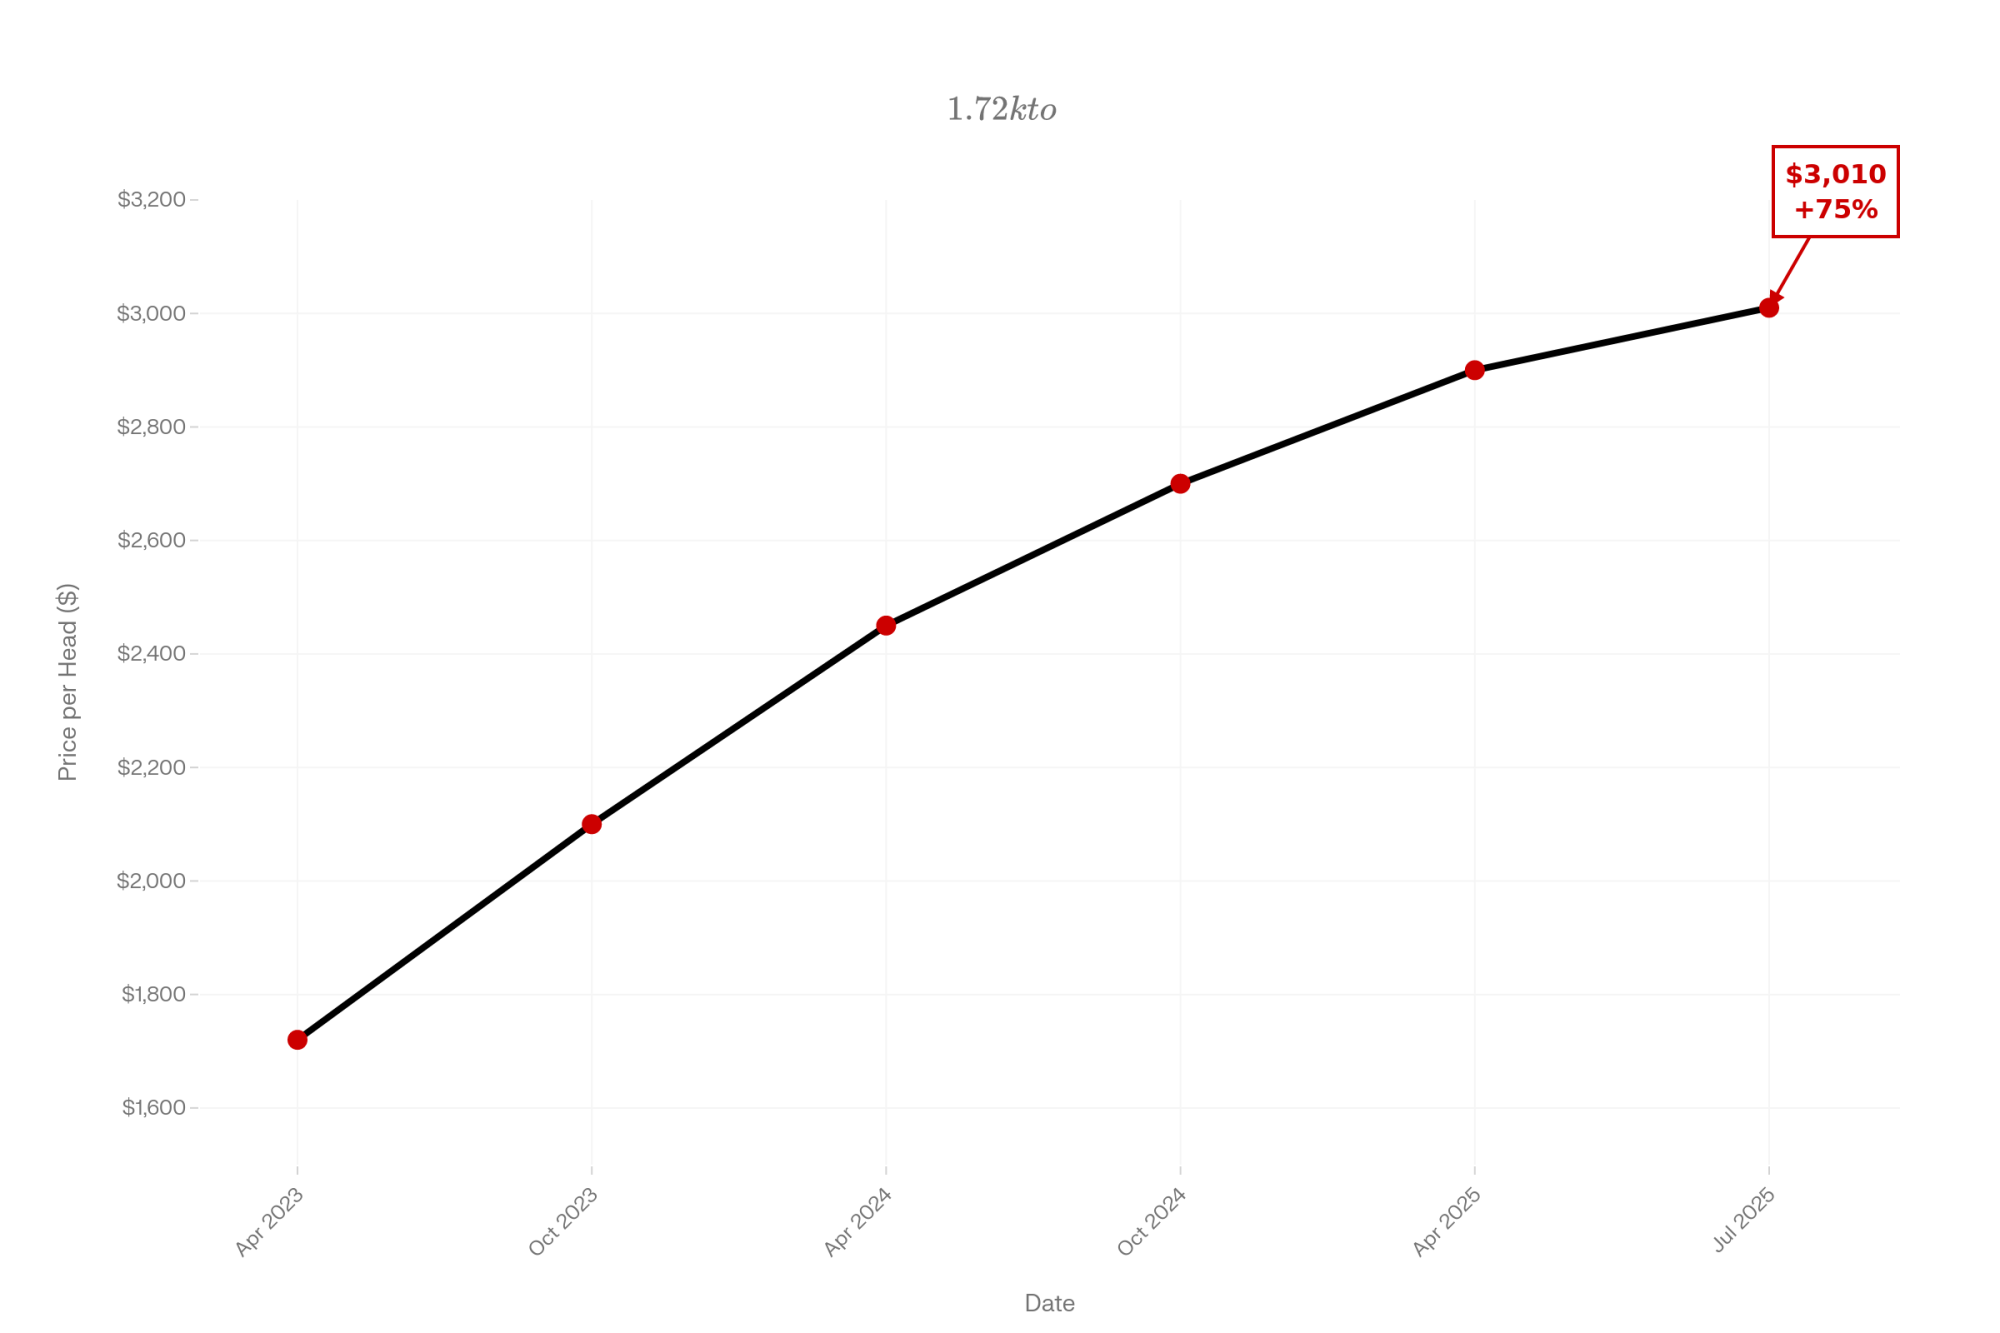
The market response has been dramatic. USDA Agricultural Prices data tracked by CoBank shows replacement heifer prices moved from $1,720 per head in April 2023 to $3,010 by July 2025—a 75% increase in just over two years. Top dairy heifers at California and Minnesota auctions reached $4,000 per head by mid-2025.
This is a classic collective action situation. Each farm’s individual decision makes sense. But collectively, these decisions created a replacement shortage that’s repricing the entire system.
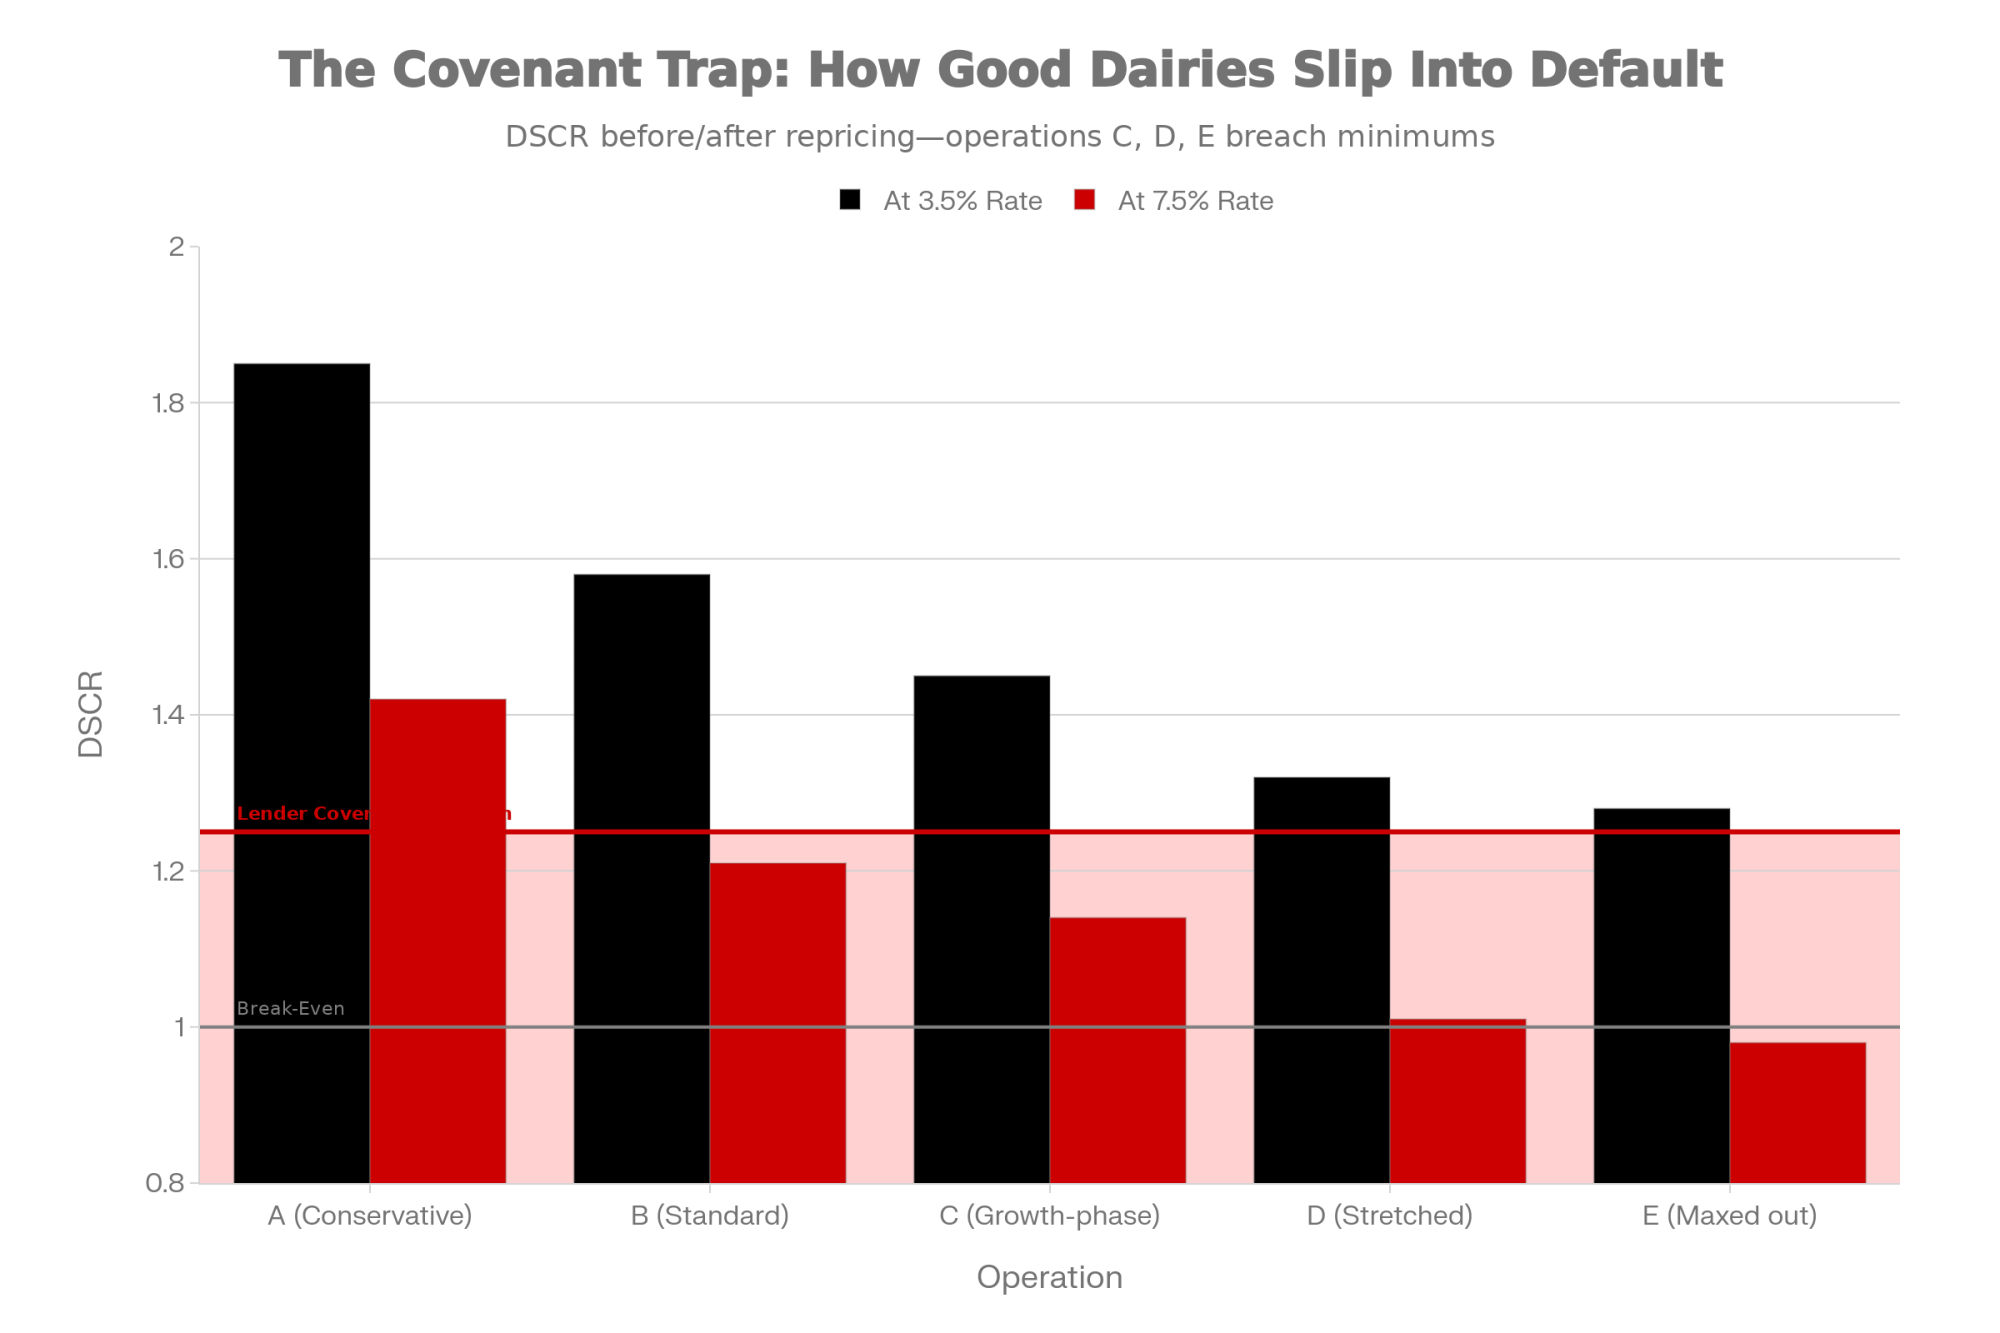
The “Mushy Middle” Reality Check
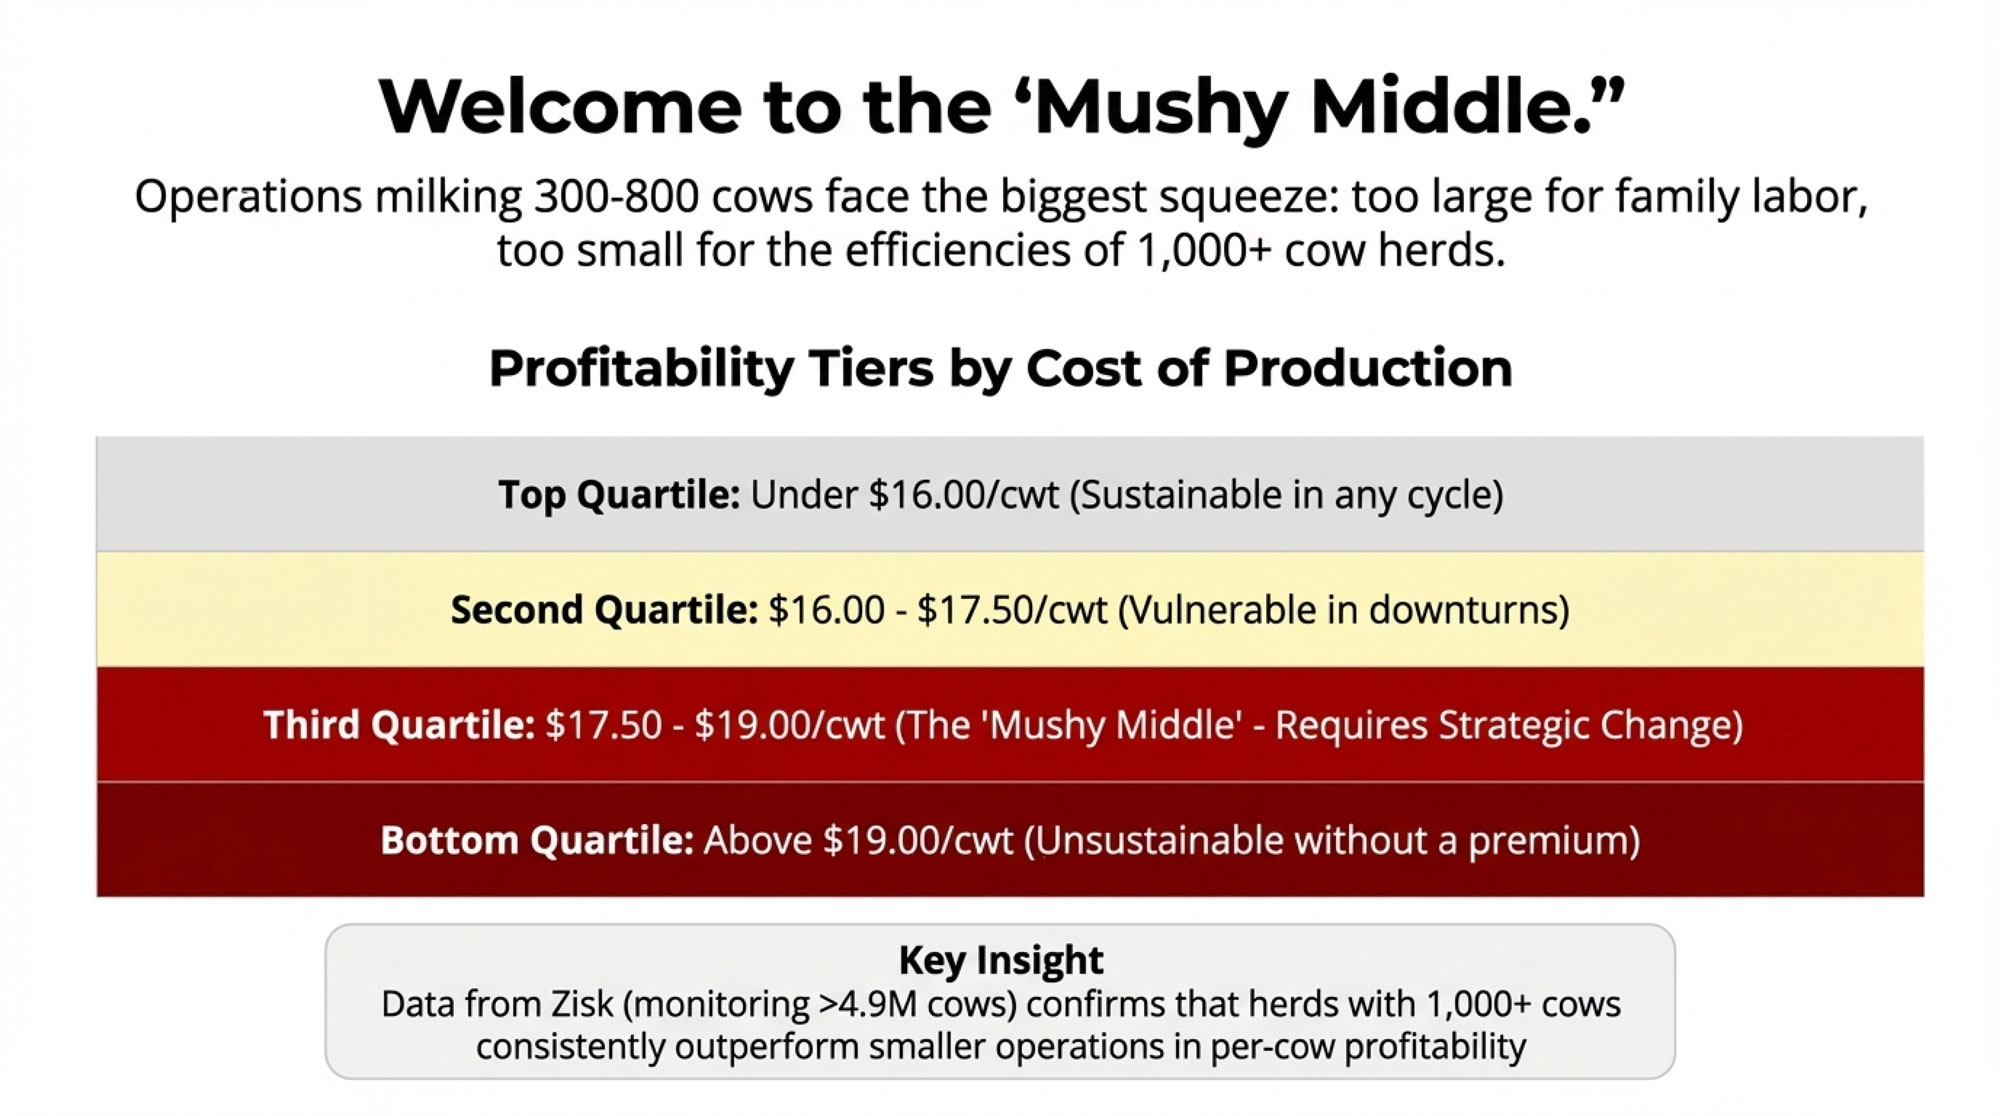
The Zisk profitability platform now monitors operations milking over 4.9 million cows—more than half the U.S. herd. Their data confirm that farms with 1,000 or more cows consistently outperform smaller operations in per-cow profitability.
So what does this mean for my Wisconsin friend with 650 cows? That operation is squarely in the danger zone by these metrics.
The danger zone for mid-size operations involves several compounding factors:
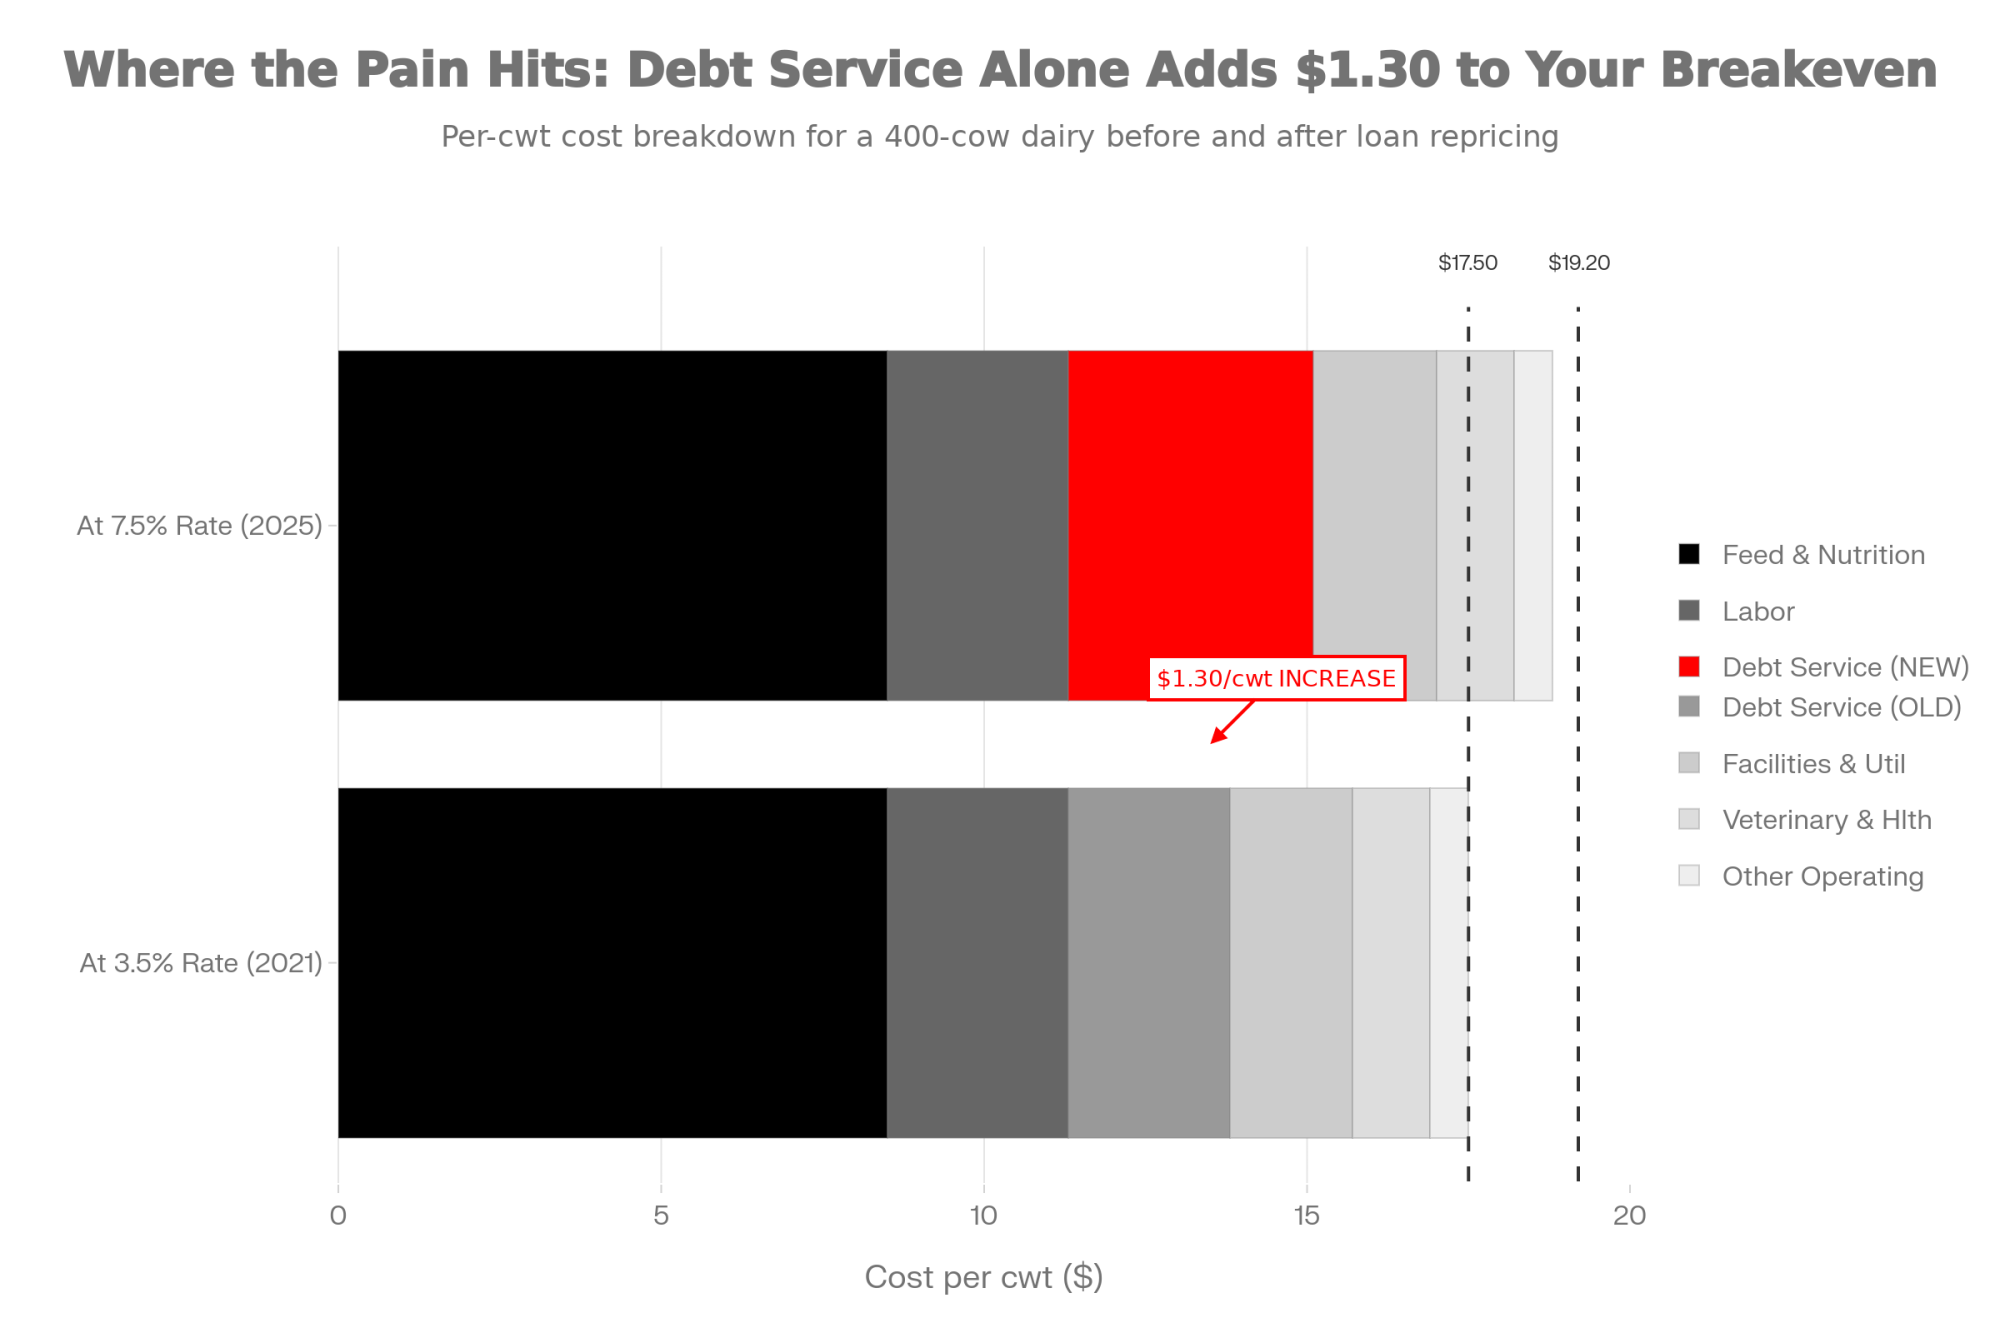
- Cost per hundredweight between $17.00-19.00—too high to compete on commodity margins, but without premium positioning
- Debt-to-asset ratios above 45-50%—limited financial cushion
- Herd size between 300-800 cows—too large for family labor alone, too small for full scale efficiencies
- Single processor relationship—limited negotiating leverage
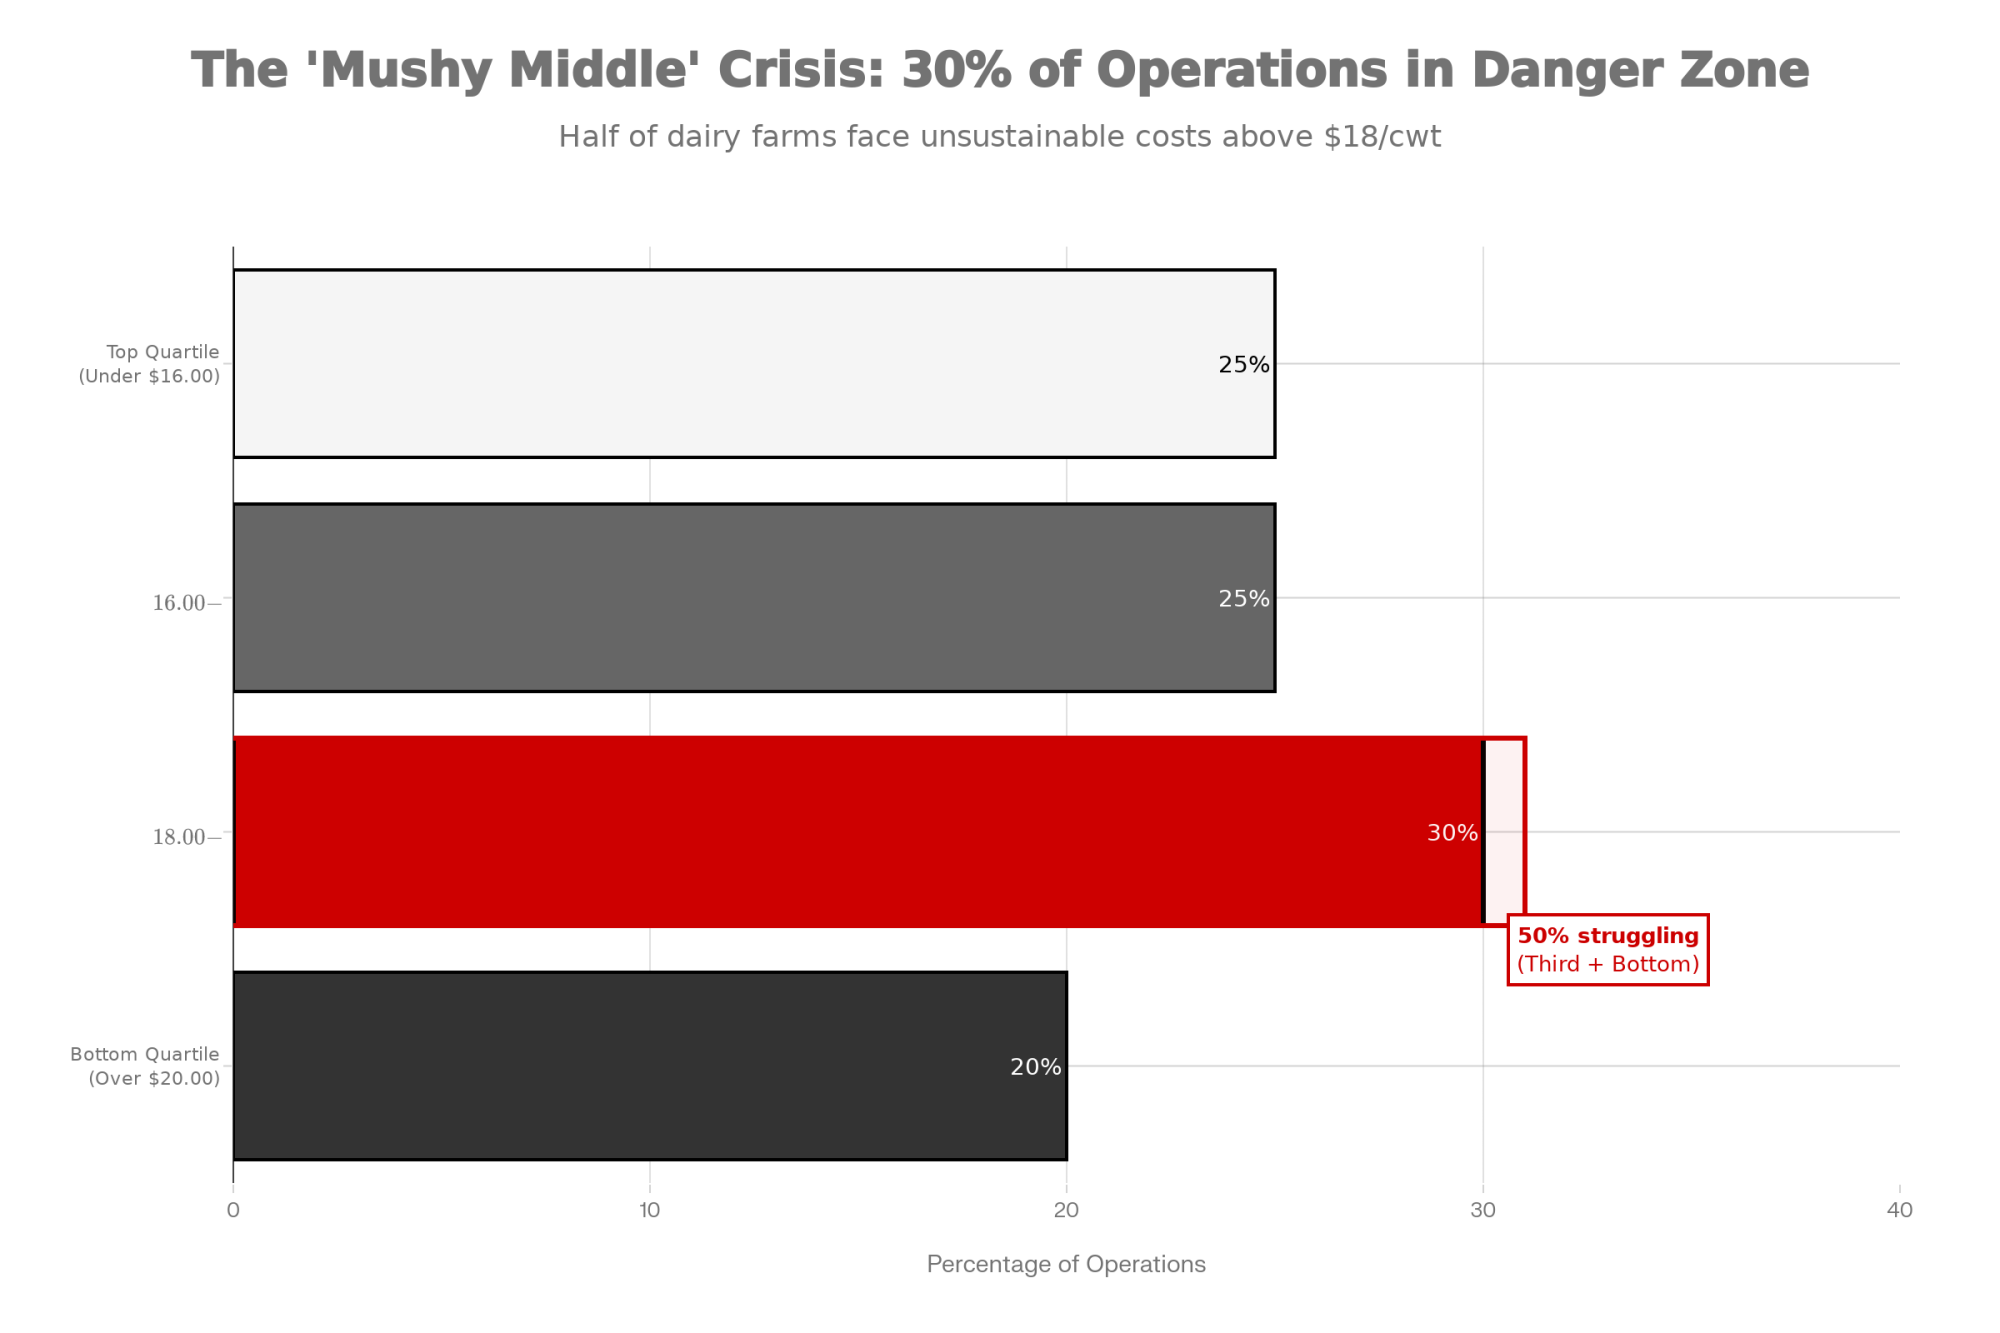
| Performance Tier | Cost per Cwt | Characteristics |
| Top Quartile | Under $16.00 | Sustainable regardless of price cycles |
| Second Quartile | $16.00-17.50 | Profitable in good years, vulnerable in downturns |
| Third Quartile | $17.50-19.00 | The “mushy middle”—requires strategic change |
| Bottom Quartile | Above $19.00 | Unsustainable without premium pricing |
For that 650-cow operation to stay competitive, the math suggests needing to hit at least three of these five benchmarks:
- Total cost of production under $17.00/cwt
- Labor efficiency in the 50-60 cows per FTE range
- Debt-to-asset ratio under 40% before expansion
- Milk price premium of at least $0.50-1.00/cwt
- Feed cost under $9.50/cwt
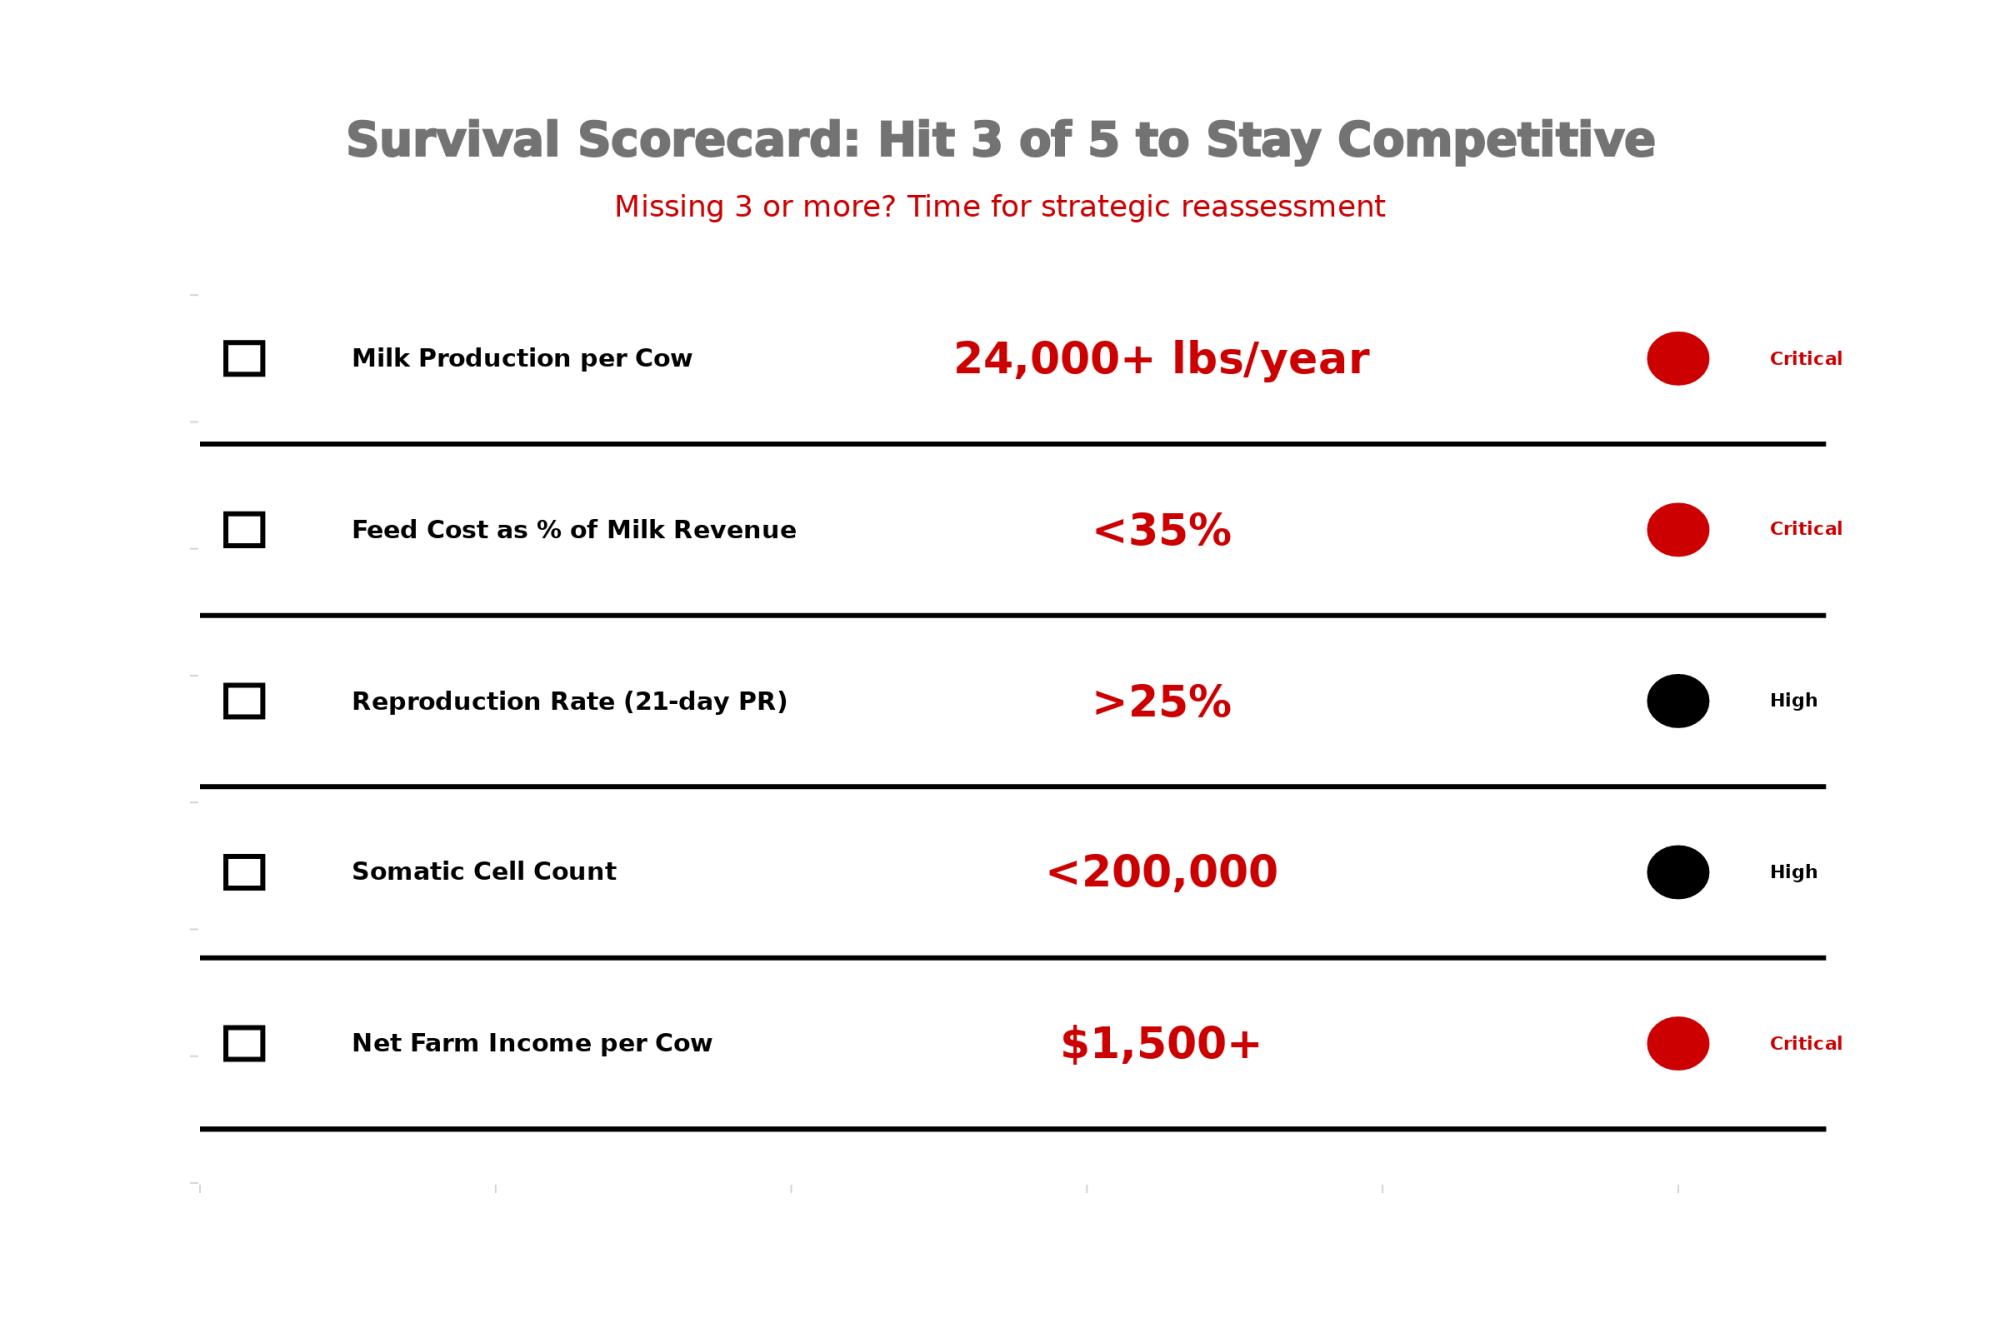
Miss three or more? That’s the signal that strategic repositioning deserves serious analysis.
Technology favors scale as well. Genomic testing pays outsized dividends for larger operations—making breeding decisions on $50 tests rather than waiting years for daughter proofs accelerates genetic progress while the per-test cost spreads efficiently across larger herds.
I don’t want to overstate this. Many mid-size operations remain profitable. The data simply suggests the “sweet spot” has narrowed.
Strategic Pathways: What’s Actually Working
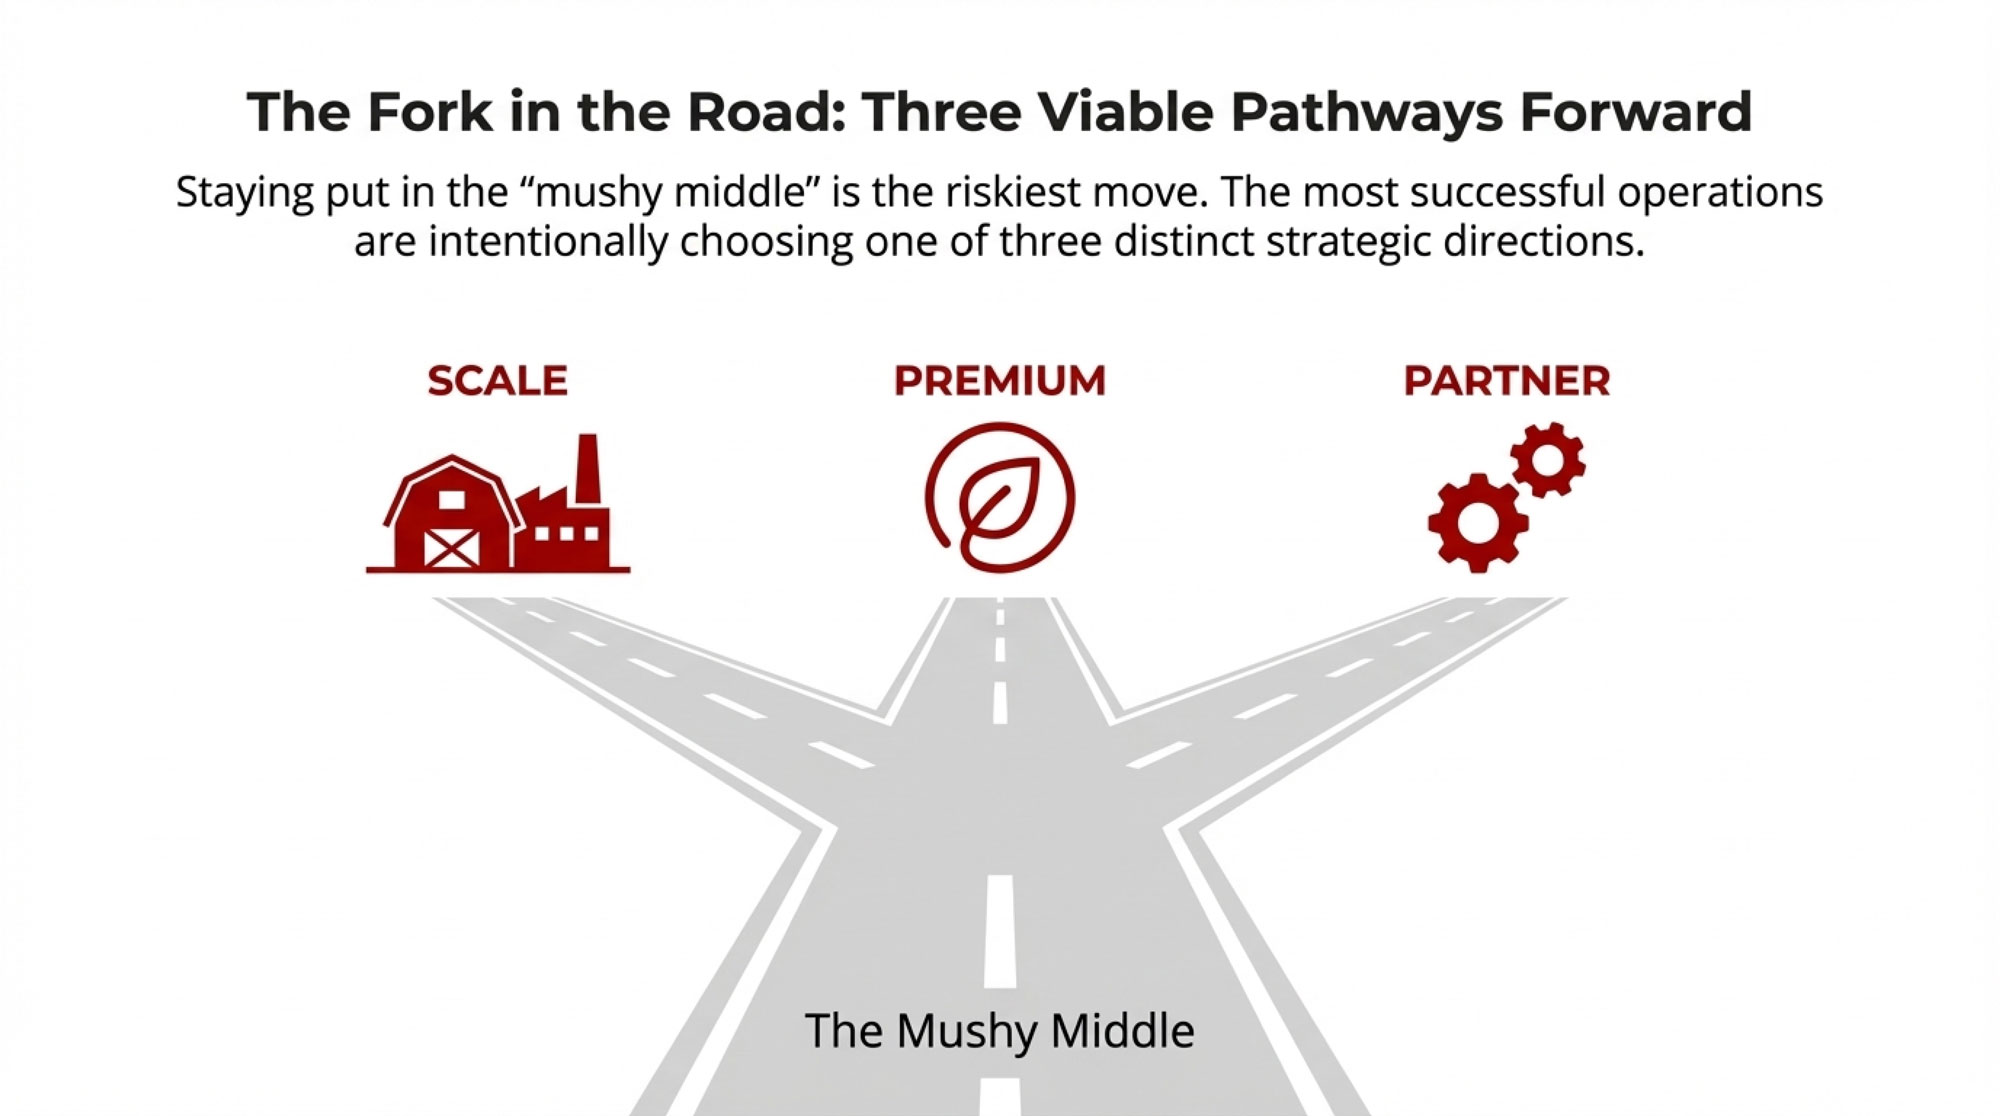
The Scale Pathway
Operations growing to 2,000+ cows achieve meaningful cost advantages when they have the right foundation: debt-to-asset ratios well under 40% before expansion, substantial liquid reserves, land and nutrient management already permitted, and management depth beyond the founding family.
The Premium Positioning Pathway
Smaller operations are capturing substantial margins through differentiation. Organic programs through cooperatives like Organic Valley pay meaningful premiums. The most successful premium operations layer multiple strategies—specialty genetics, A2A2 certification, organic practices, and on-farm processing.
The Partnership Pathway
I’ve spoken with Upper Midwest producers running separate family operations who share feed mixing systems, manure handling, and collective purchasing. Individually, none could justify certain equipment investments. Split three ways, the economics work. Partnership success hinges on governance—formal LLCs with clear operating agreements, not handshake arrangements.
Looking Forward
When I asked my Wisconsin friend what he’s planning, he said he’s finally running the numbers on all three pathways. That kind of strategic clarity is available to anyone willing to ask difficult questions.
The producers I encounter who seem most comfortable with their choices—whether expanding aggressively, transitioning to premium markets, or planning thoughtful exits—share something in common: they’ve done the analysis and made intentional decisions rather than defaulting to continuation.
The producers still hoping 2026 will look like 2019 may be the ones writing the case studies that future articles reference as cautionary tales.
Key Takeaways
- Cost structures have reset permanently higher in labor (+30% since 2020), interest rates, equipment, and construction—feed relief alone won’t restore historical margins
- Export dynamics are evolving as Mexico invests $4.1 billion in domestic capacity, and China’s imports fell 12%
- The “mushy middle” faces the toughest math—operations with costs between $17-19/cwt need strategic repositioning, not just better prices
- Replacement heifer prices hit $3,010/head—up 75% since 2023, fundamentally changing expansion and beef-on-dairy calculations
- Five benchmarks define competitive mid-size operations: cost under $17/cwt, labor efficiency near 50-60 cows/FTE, debt-to-asset under 40%, milk premium capture, and feed cost advantages
- Multiple strategic pathways remain viable—scale, premium positioning, and partnerships each show success stories
- Proactive strategic decisions outperform reactive ones—the optimal time for analysis precedes circumstances that narrow available options
Complete references and supporting documentation are available upon request by contacting the editorial team at editor@thebullvine.com.
Learn More
- Dairy Farm Financial Management: Are You Playing to Win or Playing Not to Lose? – Stop reacting to the checkbook and start driving the margin. This breakdown arms you with the specific KPI tracking needed to identify “leakage” in your operation before it compromises your 2026 solvency.
- Consolidation or Collaboration? The Future of the Family Dairy Farm – Scaling isn’t the only way to win. This analysis reveals how collaborative “mergers of equals” allow mid-size producers to capture massive scale economics while maintaining family ownership and building long-term equity.
- The Heifer Shortage: Why Your Genetic Strategy Just Got a Lot More Expensive – The beef-on-dairy gold rush created a replacement vacuum. This deep dive exposes why a “one-size-fits-all” breeding program is now a liability and delivers the precision genetic tactics required to rebuild your pipeline.
 Join the Revolution!
 Join the Revolution!
Join over 30,000 successful dairy professionals who rely on Bullvine Weekly for their competitive edge. Delivered directly to your inbox each week, our exclusive industry insights help you make smarter decisions while saving precious hours every week. Never miss critical updates on milk production trends, breakthrough technologies, and profit-boosting strategies that top producers are already implementing. Subscribe now to transform your dairy operation’s efficiency and profitability—your future success is just one click away.