


One month of DMC at $9.50 could pay several years of premiums. The deadline is Wednesday. Have you actually run the math?
Executive Summary: January’s Class III price fell to $14.59/cwt while March Class IV futures climbed to $19.50, creating a $2.99/cwt spread that works out to about $382,000/year on a 500‑cow herd shipping 70 lbs/cow/day. That gap sits atop June 2025 make‑allowance changes that already skimmed roughly 90¢/cwt from producer checks and is being widened by a global butterfat shortage, a tight U.S. powder market, and a new $75 million USDA butter buy. At the same time, the U.S. dairy herd has grown to 9.58 million cows, the largest in more than 30 years, setting up a spring flush that could pressure prices unless Section 32 purchases and exports keep absorbing product. The one clear positive is Dairy Margin Coverage: with a projected January margin of $7.52/cwt, $9.50 coverage throws off about $1.98/cwt on Tier 1 milk, so a single month’s payment can cover several years of premiums. For a 500‑cow dairy, each combined 0.1% gain in butterfat and protein now adds roughly $46,400/year, making components one of the few levers that improve cash flow without new capital. This article doesn’t just recap those numbers; it walks through barn‑level math and a 30/90/365‑day playbook for lining up DMC enrollment, DRP weighting, component strategy, and Section 179 planning with $16–$17 Class III, not a rosy futures average. It ends with a hard question every producer has to answer: where does your breakeven sit relative to $16.51 Class III, and what are you going to do about it before the DMC window closes?
January’s FMMO Class III price landed at $14.59/cwt — down $1.27 from December and the lowest since July 2023’s $13.77. Part of that’s structural: USDA’s June 2025 make-allowance increases shifted roughly 90¢/cwt from producer checks to processor cost recovery. But the bigger story is what happened on the other side of the class divide.
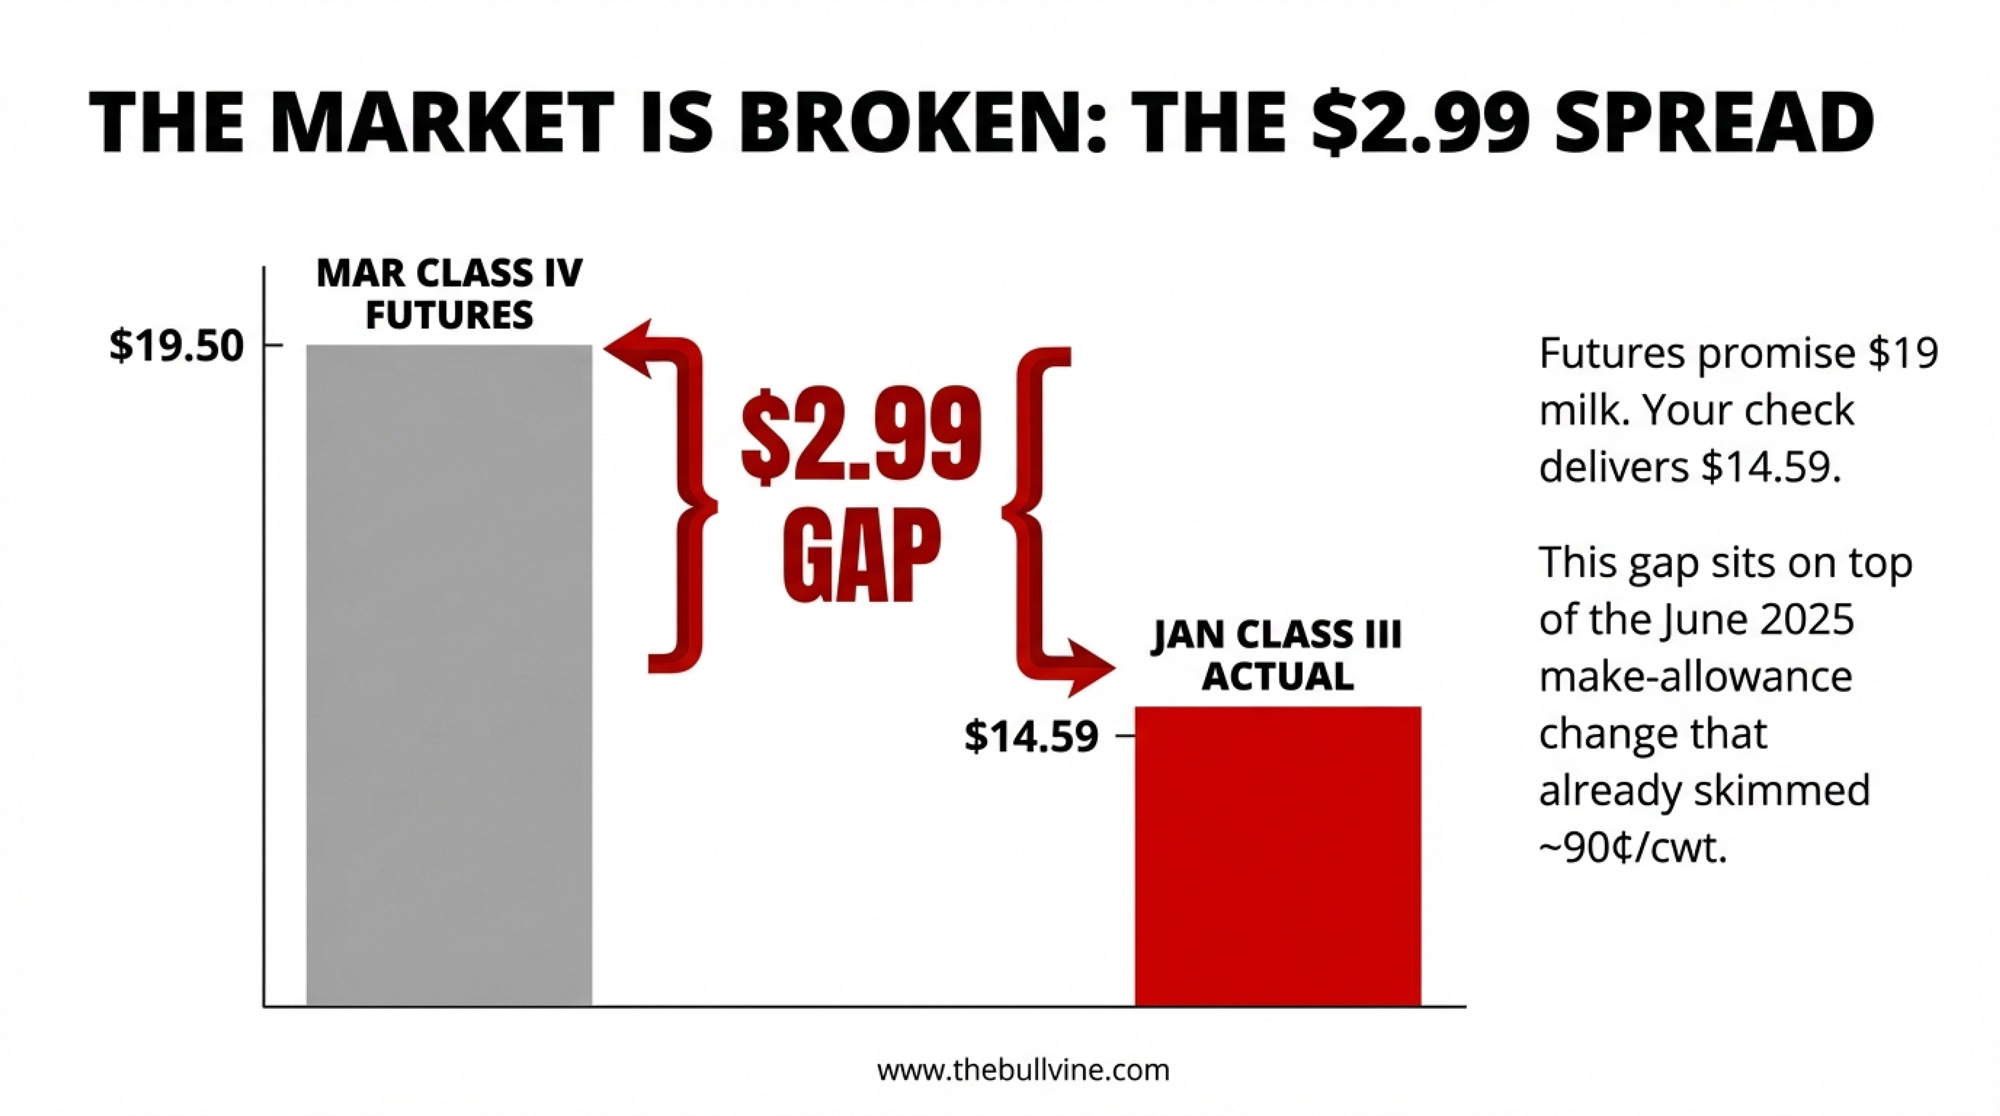
March Class IV futures settled at $19.50/cwt on February 20 — the same day March Class III settled at just $16.51. That’s a $2.99/cwt same-month spread. Nearly three dollars separating what your milk is worth as butter and powder versus cheese, on the same contract month.
That kind of gap doesn’t just show up on a chart. It shows up on your milk check, your DRP election, and your cash-flow projections for the next 90 days.
Consider a 500-cow freestall shipping 70 lbs/cow/day — the kind of Upper Midwest operation that entered 2026 staring at roughly $90,000 less operating margin than it had the year before. That was before the Class IV spread blew open. Now the question isn’t just “are margins tight?” It’s “which side of the Class III/IV line is your milk landing on?”
$263 Million in Section 32 Purchases — and the Spread Just Got Wider
For that 500-cow operation already staring at a $2.99 class gap, USDA just added fuel to the fire.
On February 19, Secretary of Agriculture Brooke Rollins announced a $263 million Section 32 purchase of dairy and agricultural products. Of that, $148 million goes to dairy — matching the number NMPF requested in late 2025.
The dairy breakdown:
- $75 million in butter — the first major USDA butter purchase in five years
- $32.5 million in Cheddar cheese and cheese products
- $10 million in Swiss cheese
- $20.5 million in fresh fluid milk
- $10 million in UHT milk
Traders pushed several CME butter contracts to their daily upper limits on Thursday and Friday. The irony isn’t subtle: a program designed to improve food affordability could temporarily tighten commercial butter supplies and push prices higher. Rush the purchases, and you squeeze an already tight market. Spread them out, and the impact fades. Either way, it lit a fire under Class IV futures that isn’t going out this week.
What Does a $2.99/cwt Class Spread Mean for a 500-Cow Dairy?
The headline number means nothing without per-cow math. So let’s walk it.
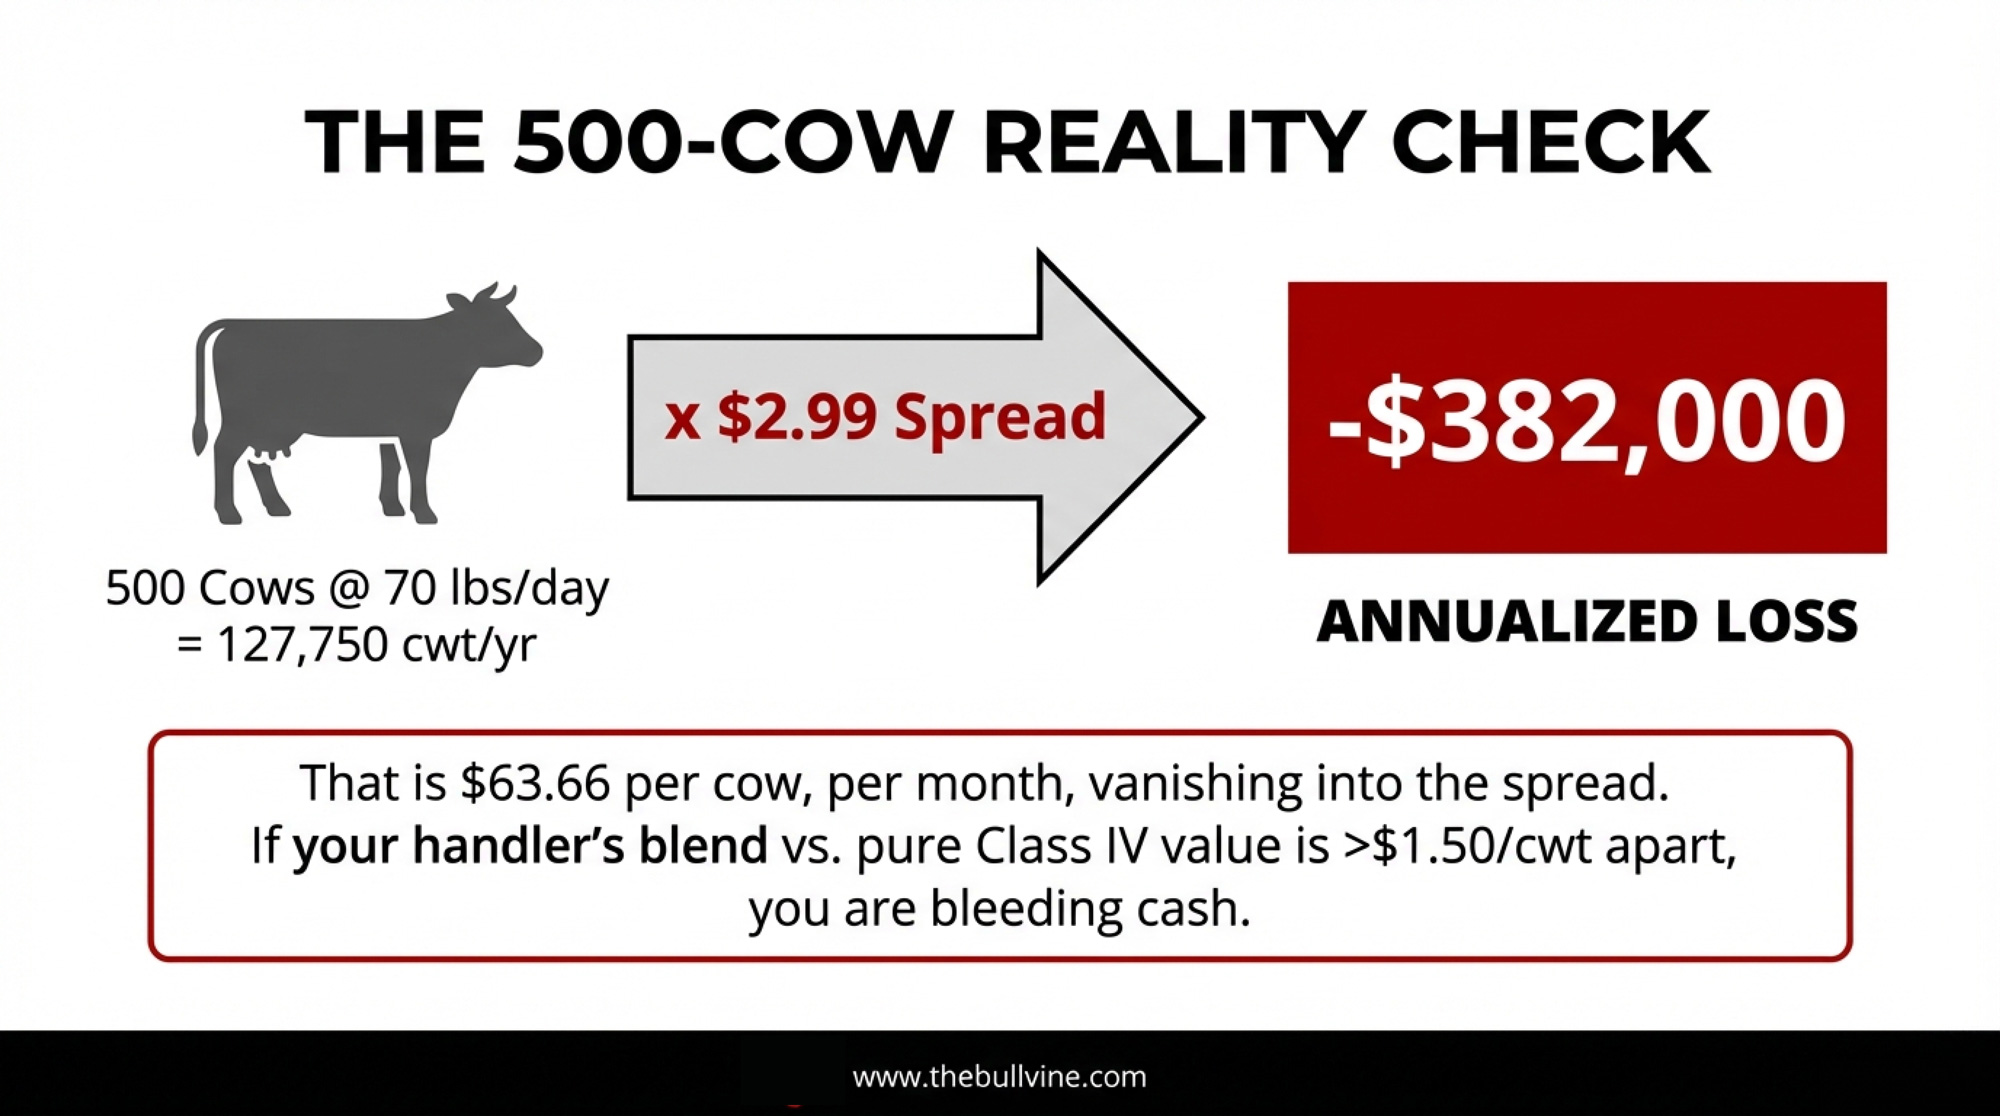
A 500-cow herd averaging 70 lbs/cow/day ships roughly 255.5 cwt/cow/year, or about 127,750 cwt annually for the operation.
At March Class IV of $19.50/cwt, that’s approximately $2,491,000 in gross milk revenue annualized at that price. At March Class III of $16.51, it’s roughly $2,109,000.
The same-month gap: $382,000/year. About $31,800/month. $63.66/cow/month.
April’s spread narrows. April Class III settled at $17.30 on February 20, while April Class IV held at $19.50 — a $2.20/cwt spread, or about $281,000 annualized. The futures curve expects some Class III recovery. But March is what’s hitting checks right now.
And no herd receives a pure single-class check. Your milk check is a blend, weighted by your handler’s utilization decisions and the pool. When Class IV runs this far above Class III, depooling accelerates — handlers pull Class IV milk out of the pool because it’s more profitable outside. In Federal Order 30 (Upper Midwest), pooled Class IV producer milk totaled just 1.4 billion pounds in 2025, even as butter and powder production ran strong. Handlers kept that high-value milk outside the pool, and the blend price for everyone who stayed pooled took the hit.
| Metric | March Class III ($16.51/cwt) | March Class IV ($19.50/cwt) |
|---|---|---|
| Annual Production (500-cow herd, 70 lbs/day) | 127,750 cwt | 127,750 cwt |
| Gross Milk Revenue (annualized at this price) | $2,109,000 | $2,491,000 |
| Annual Revenue Gap | — | +$382,000 🔴 |
| Monthly Revenue Impact | $175,750 | $207,583 |
| Monthly Gap | — | +$31,833 🔴 |
| Per-Cow Monthly Revenue | $292.92 | $345.14 |
| Per-Cow Monthly Gap | — | +$52.22 🔴 |
Run your own numbers. If the gap between your handler’s blend and what you’d get at pure Class IV pricing is more than $1.50/cwt, the rest of this article matters more to your operation than most.
Three Forces That Won’t Let the Spread Self-Correct
For that 500-cow operation watching the spread widen, three structural drivers suggest it isn’t cooling off by April.
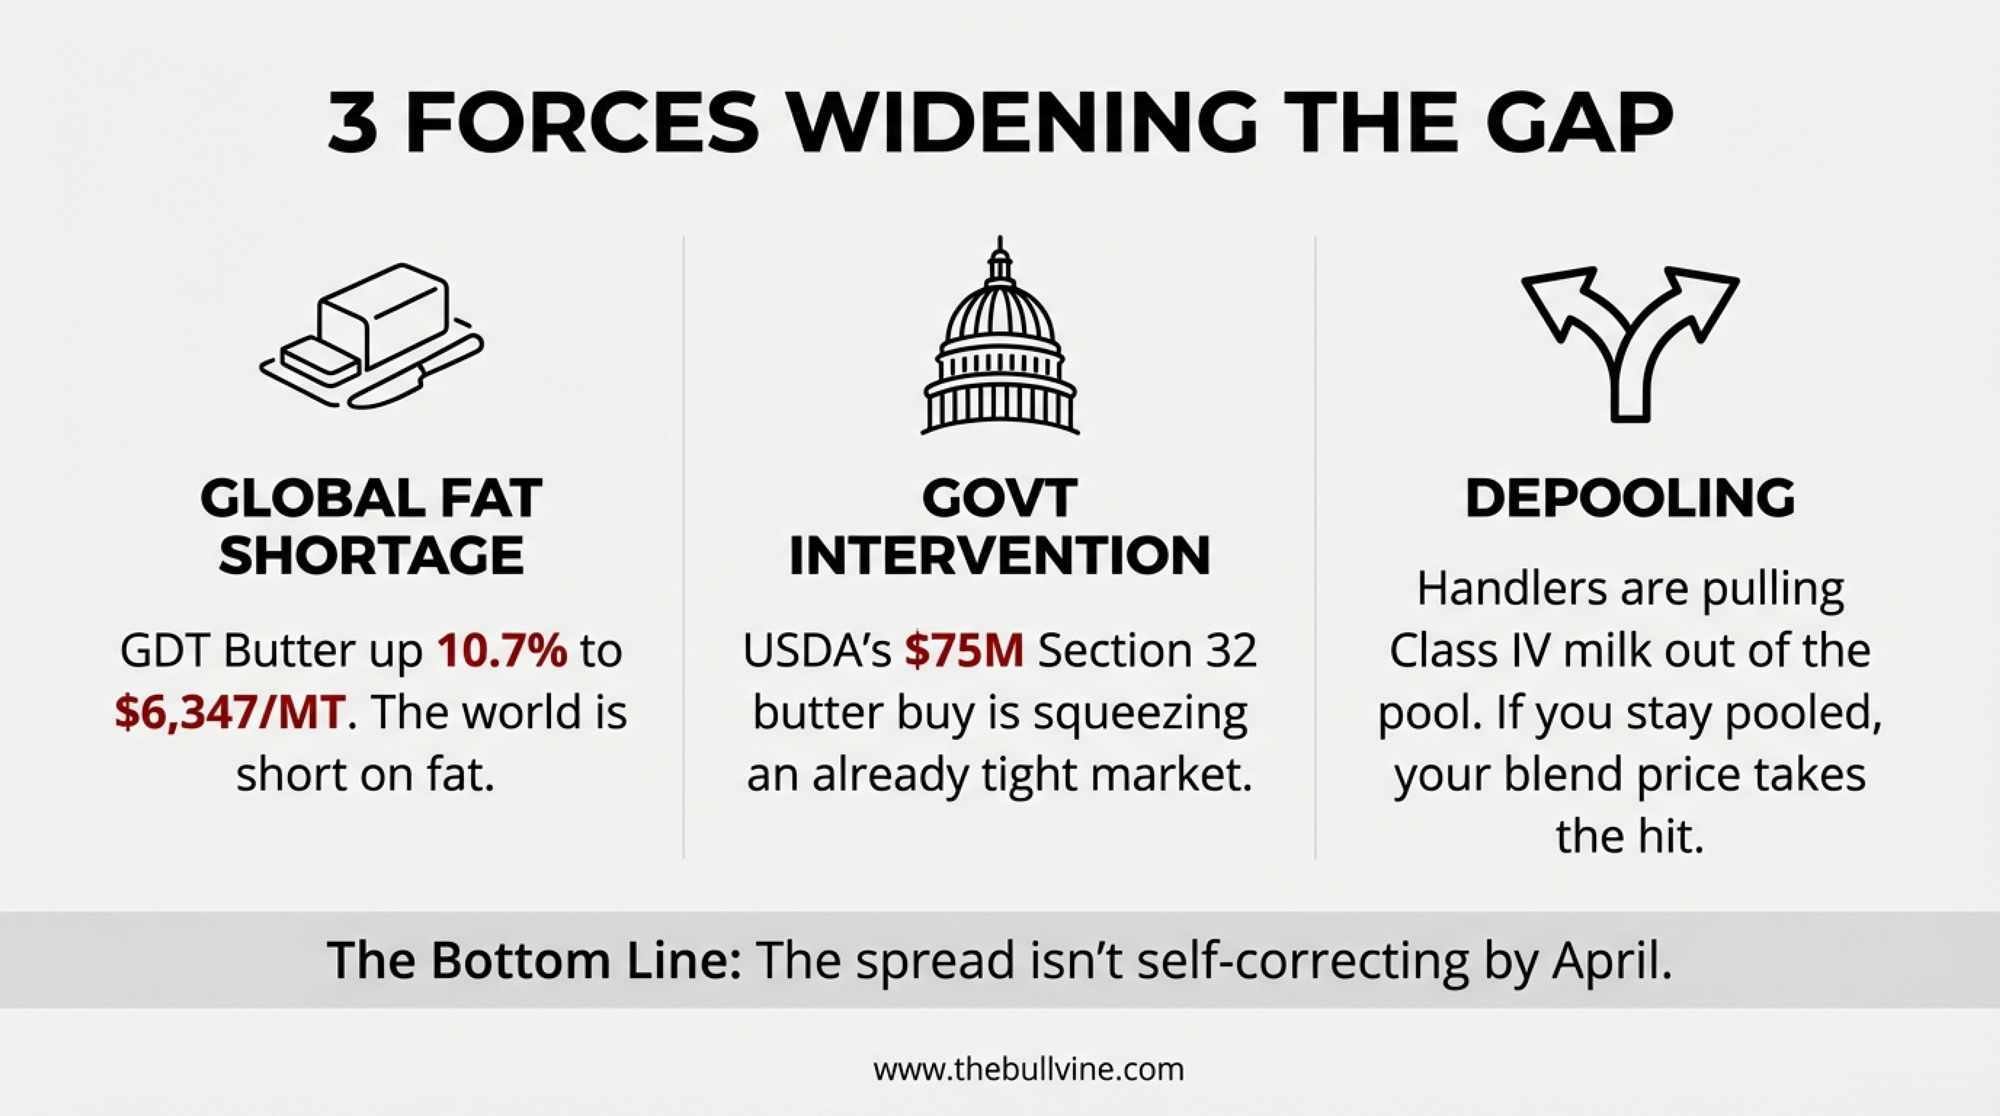
Global fat shortage. GDT Event TE398 — the fourth consecutive price increase — saw butter jump 10.7% to $6,347/MT. Anhydrous milk fat climbed 3.8% to $6,751/MT. Butterfat is tight worldwide, not just in the U.S.
U.S. powder premium over world price. CME spot NDM surged to $1.685/lb during the week ending February 20 — the highest since mid-2022. That sits well above the GDT SMP equivalent of roughly $1.44/lb protein-adjusted. The U.S. powder market is especially tight, and it’s dragging Class IV higher.
Government demand is stacked on top. The Section 32 butter buy adds $75 million in new purchasing power to a market already rationed by price. That’s demand creation at the worst possible moment for anyone hoping Class IV cools off.
CME spot butter jumped 16.5¢ to $1.87/lb for the week, a five-month high. Spot cheddar blocks rose 11¢ to $1.4975/lb — competitive, but nowhere near the butterfat rally. Whey fell 4¢ to $0.68/lb, bucking the trend entirely.
The Spring Flush Math Just Got Worse
That same 500-cow herd’s spring production ramp is about to collide with the largest national herd in over 30 years.
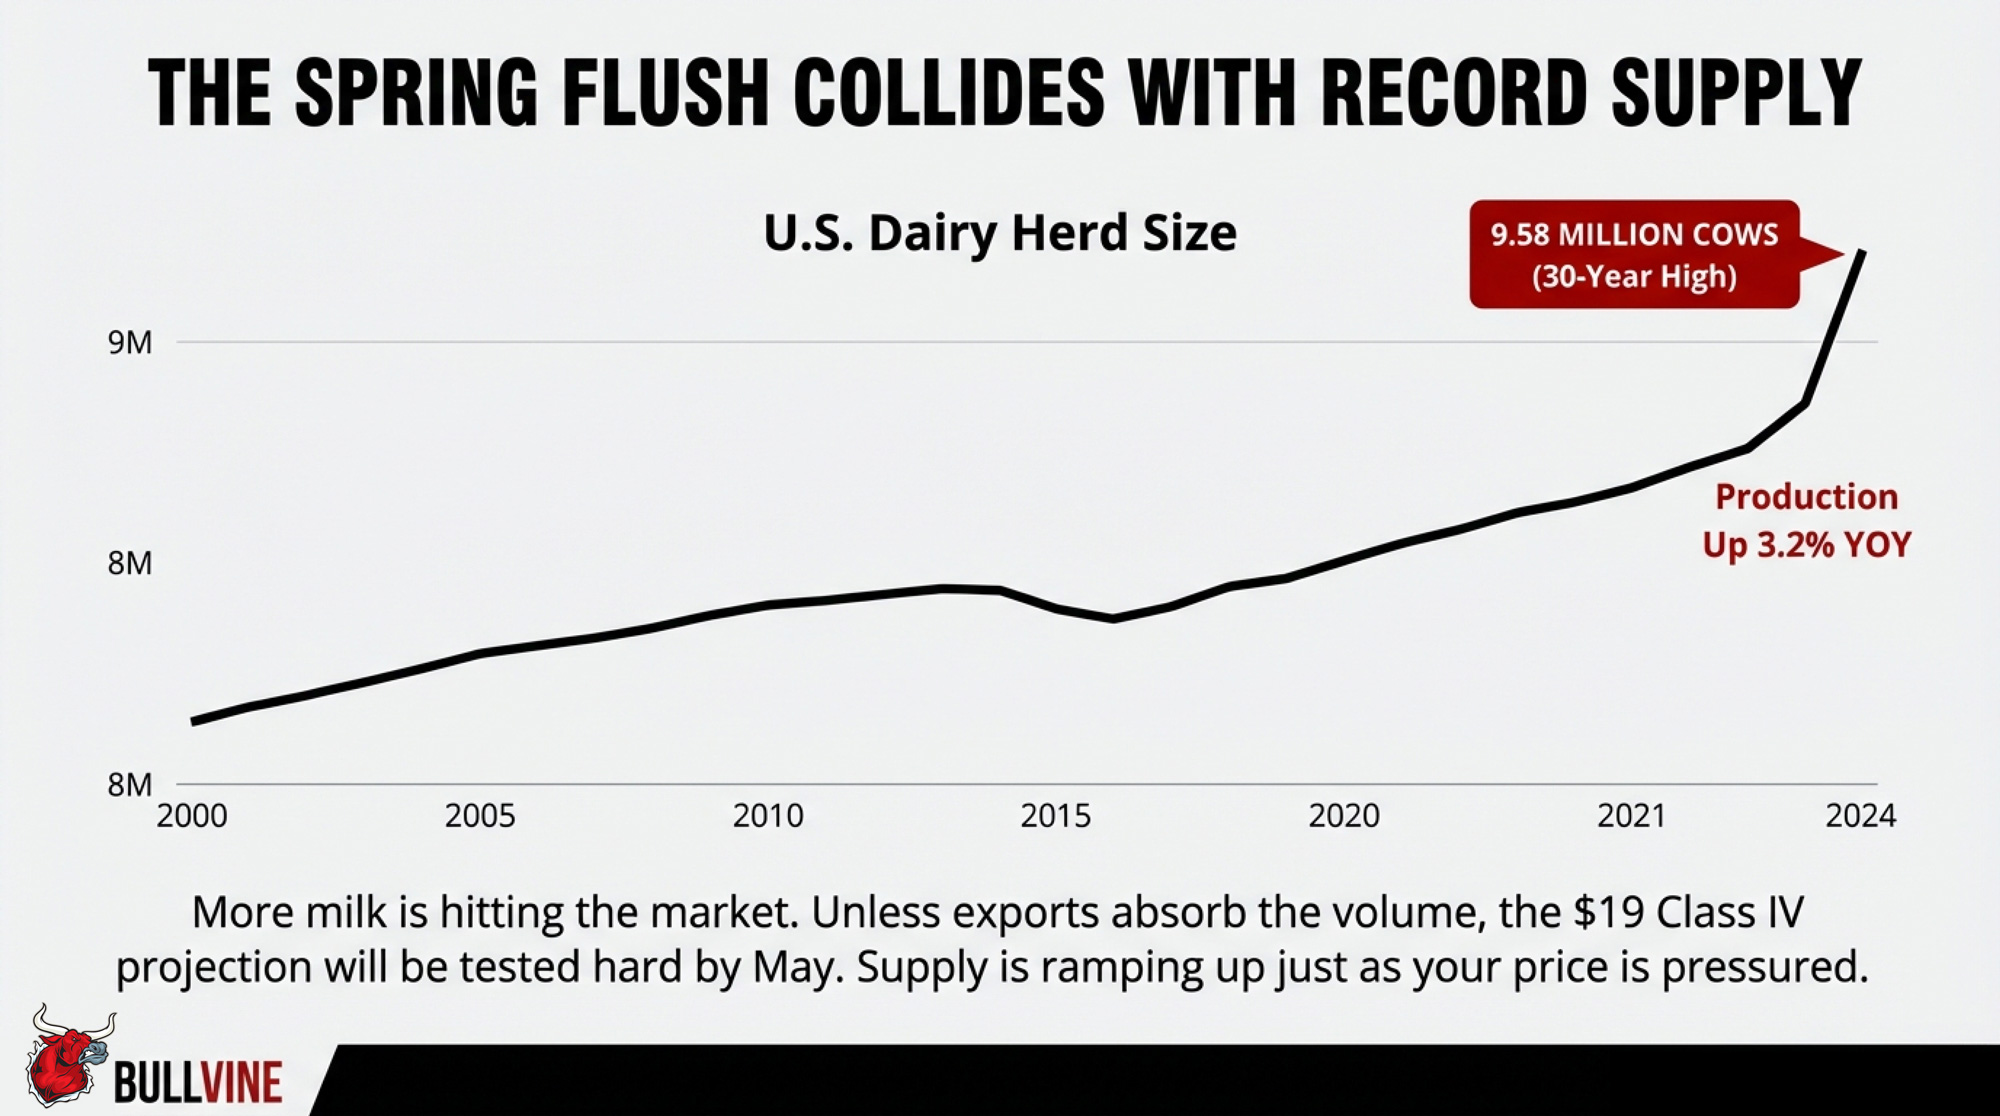
USDA’s January Milk Production report, released February 20, showed total U.S. production at 19.8 billion pounds, up 3.2% year-over-year. The herd itself reached 9.58 million head — up 189,000 cows from January 2025, up 14,000 from December, and the highest total since 1993.
Growth concentrated in the Great Lakes, Texas, and the Northern Plains. Kansas alone added 45,000 cows year-over-year. Wisconsin added 20,000, Idaho 22,000, and Michigan 15,000. On the other side: Washington lost 17,000, Pennsylvania shed 11,000, and New Mexico dropped 8,000. California’s per-cow yields surged 4.6% — from 1,960 to 2,050 lbs/cow in January — with avian influenza fully cleared.
More milk hitting the market should, in theory, ease commodity prices. But the butterfat complex isn’t responding to supply signals the way cheese is. If Section 32 purchases and export demand don’t absorb the extra volume, the futures curve’s $19+ Class IV projection gets tested hard by May, and the spread could narrow from the wrong direction.
But One Thing Already Broke in Their Favor: DMC
Here’s the turn for that 500-cow operation. The safety net they may have treated as an afterthought in 2025 just became the most important enrollment of the decade.
December 2025’s Dairy Margin Coverage margin came in at $9.42/cwt, triggering the first and only payment of 2025 — a thin $0.08/cwt. January doesn’t look thin.
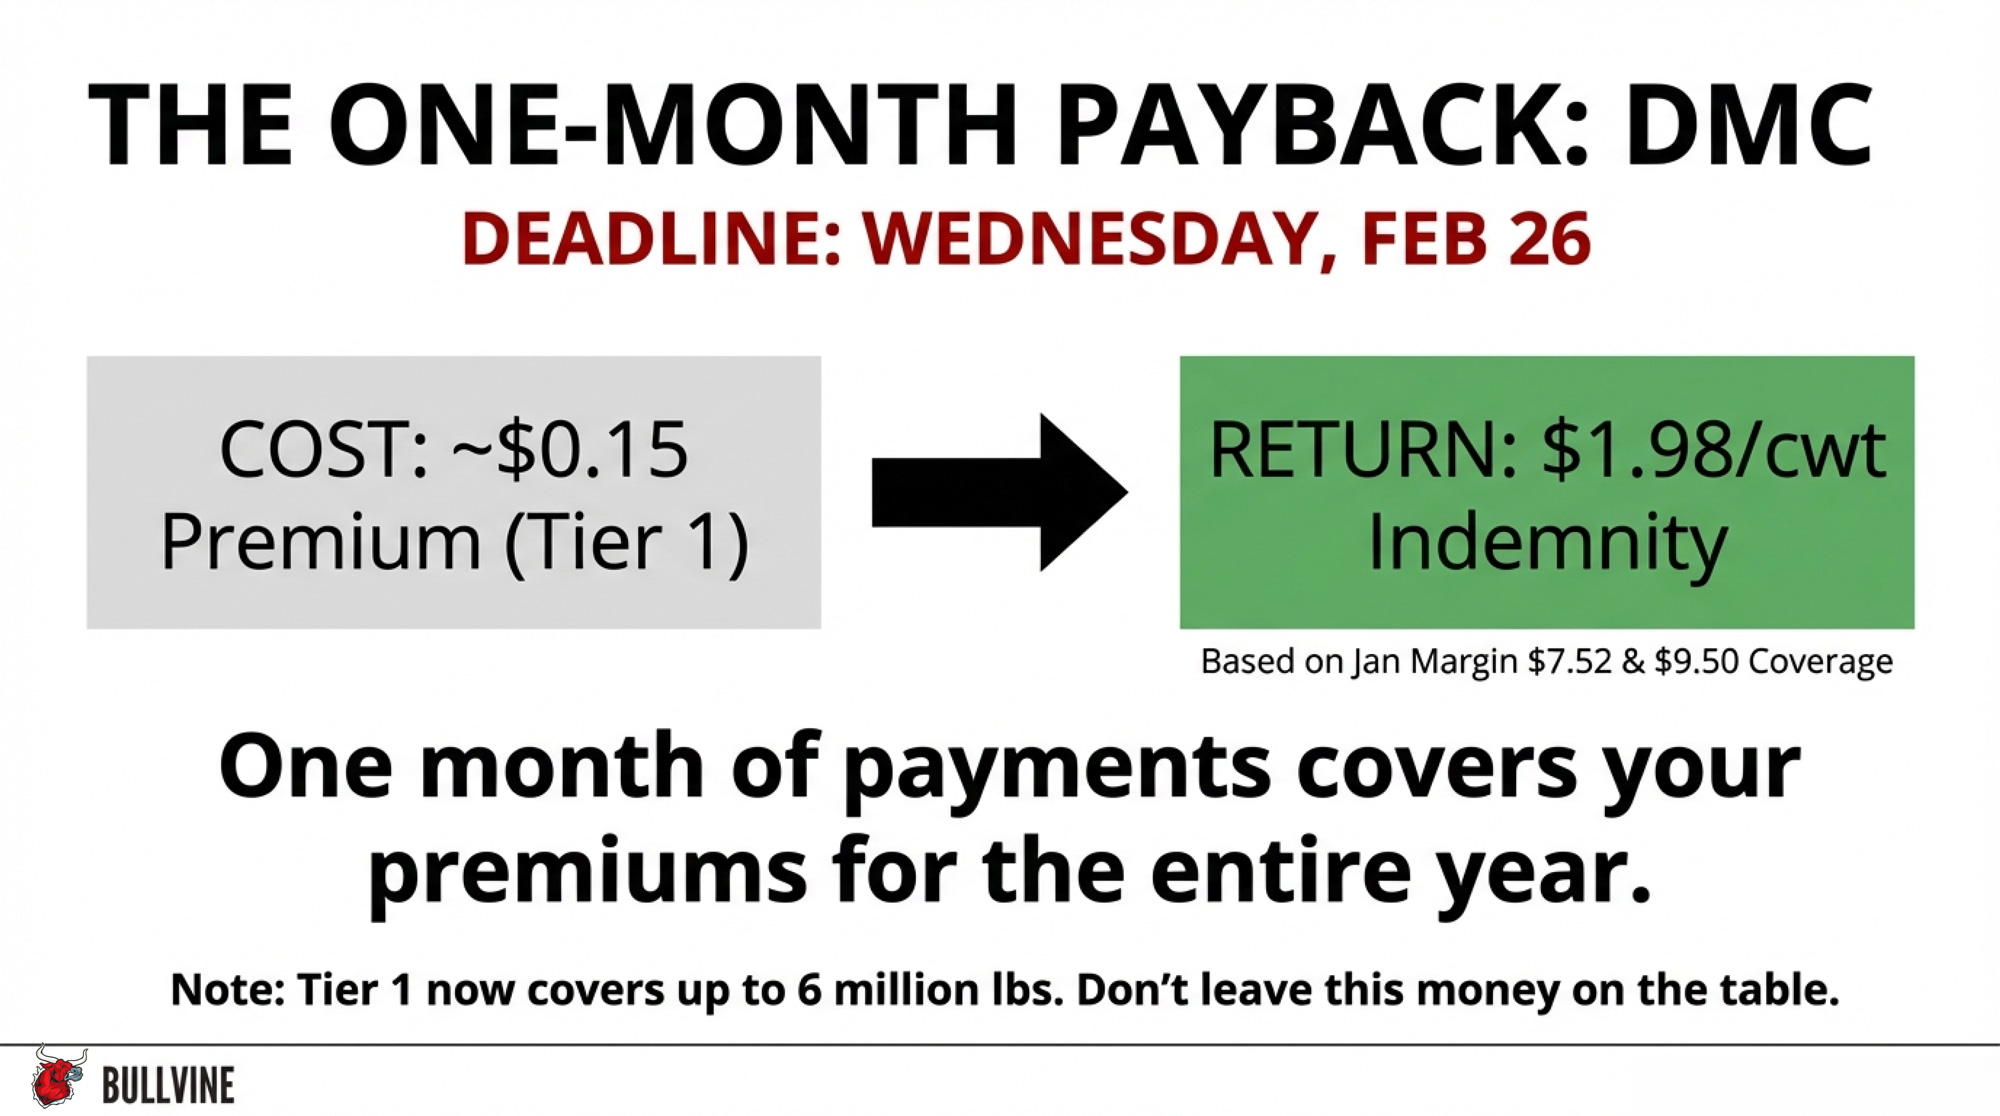
The Center for Dairy Excellence projects the January margin at $7.52/cwt. At $9.50 coverage, that’s a $1.98/cwt indemnity. On 5,000 cwt of monthly Tier 1 production (a 6-million-pound annual allocation), that’s roughly $9,900 in a single month — enough to cover the full year’s premium several times over.
NMPF’s William Loux confirmed the direction: he expects DMC payments through the first quarter and probably through the first half of the year.” USDA projects margins below $9.50/cwt through July.
Enrollment closes February 26. Under the One Big Beautiful Bill Act:
- Tier 1 expanded from 5 million to 6 million pounds — covering herds up to roughly 250–350 cows at the $0.15/cwt premium for $9.50 coverage.
- Highest production year from 2021–2023 becomes your new baseline.
- Six-year lock-in (2026–2031) earns a 25% premium discount — roughly $40,000 in savings on a 300-cow operation over the commitment.
The trade-off is real. You’re committed through 2031 regardless of where margins go. If margins recover to $12+ by 2027, you’re paying premiums on coverage you won’t trigger. But at $7.52 projected margins in January, the payback math is aggressive. If you haven’t enrolled, the decision framework is here.
Components: Where the Real Money Hides at $14.59 Milk
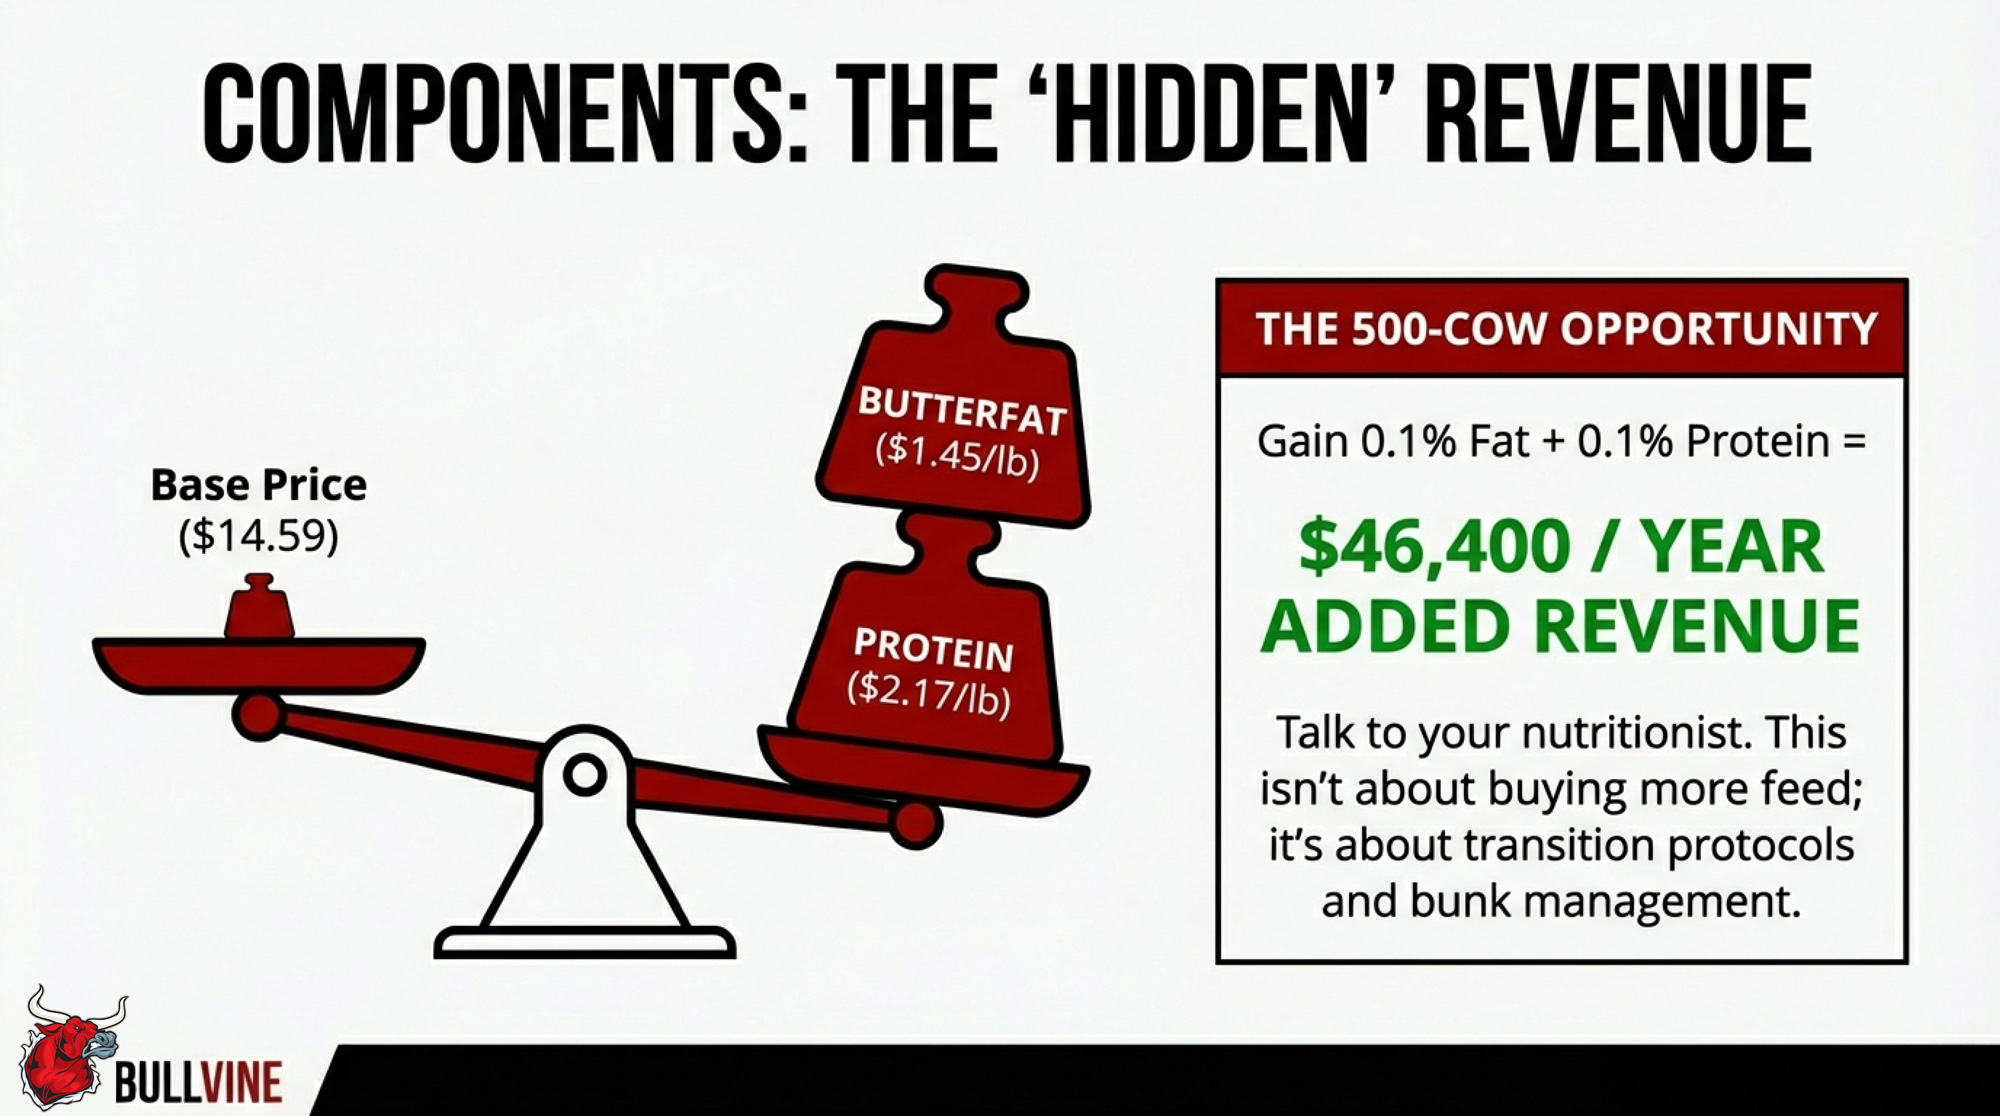
January FMMO component prices tell the story: butterfat at $1.4525/lb and protein at $2.1768/lb. In a $14.59 Class III environment — made worse by the June 2025 make-allowance hike that shifted roughly 90¢/cwt to processor cost recovery — components are the difference between breaking even and bleeding cash.
| Component Improvement | Additional Production (lbs/year) | FMMO Price ($/lb) | Annual Revenue Gain |
|---|---|---|---|
| 0.1% Butterfat | 12,775 lbs | $1.4525/lb | +$18,556 🔴 |
| 0.1% Protein | 12,775 lbs | $2.1768/lb | +$27,809 🔴 |
| Combined 0.1% BF + Protein | 25,550 lbs | — | +$46,365 🔴 |
| Per-Cow Monthly Impact (500-cow) | — | — | +$7.73/cow 🔴 |
Here’s the math on a 500-cow herd shipping 12.775 million lbs/year:
- Each 0.1% butterfat improvement: 12,775 lbs additional BF × $1.4525/lb = $18,556/year
- Each 0.1% protein improvement: 12,775 lbs additional protein × $2.1768/lb = $27,809/year
- Combined 0.1% gain in both: roughly $46,400/year — or $7.73/cow/month
If you’re below 4.0% fat and 3.1% protein, talk to your nutritionist this week. The herds making component gains aren’t spending more per cow — they’re tightening transition protocols, adjusting TMR formulations, and managing bunk time. Those are $46,000 improvements at the cost of management attention, not capital.
What This Means for Your Operation
This week — before February 26:
- DMC enrollment. At the projected January margin of $7.52/cwt, one month’s indemnity at $9.50 coverage equals $1.98/cwt across your Tier 1 production. USDA projects margins below $9.50 through July. The deadline is Wednesday.
- DRP weighting review. With a $2.99/cwt same-month Class III–IV spread, your election weighting is the single highest-dollar decision you’ll make this quarter. Call your risk management advisor this week.
Next 90 days — through the spring flush:
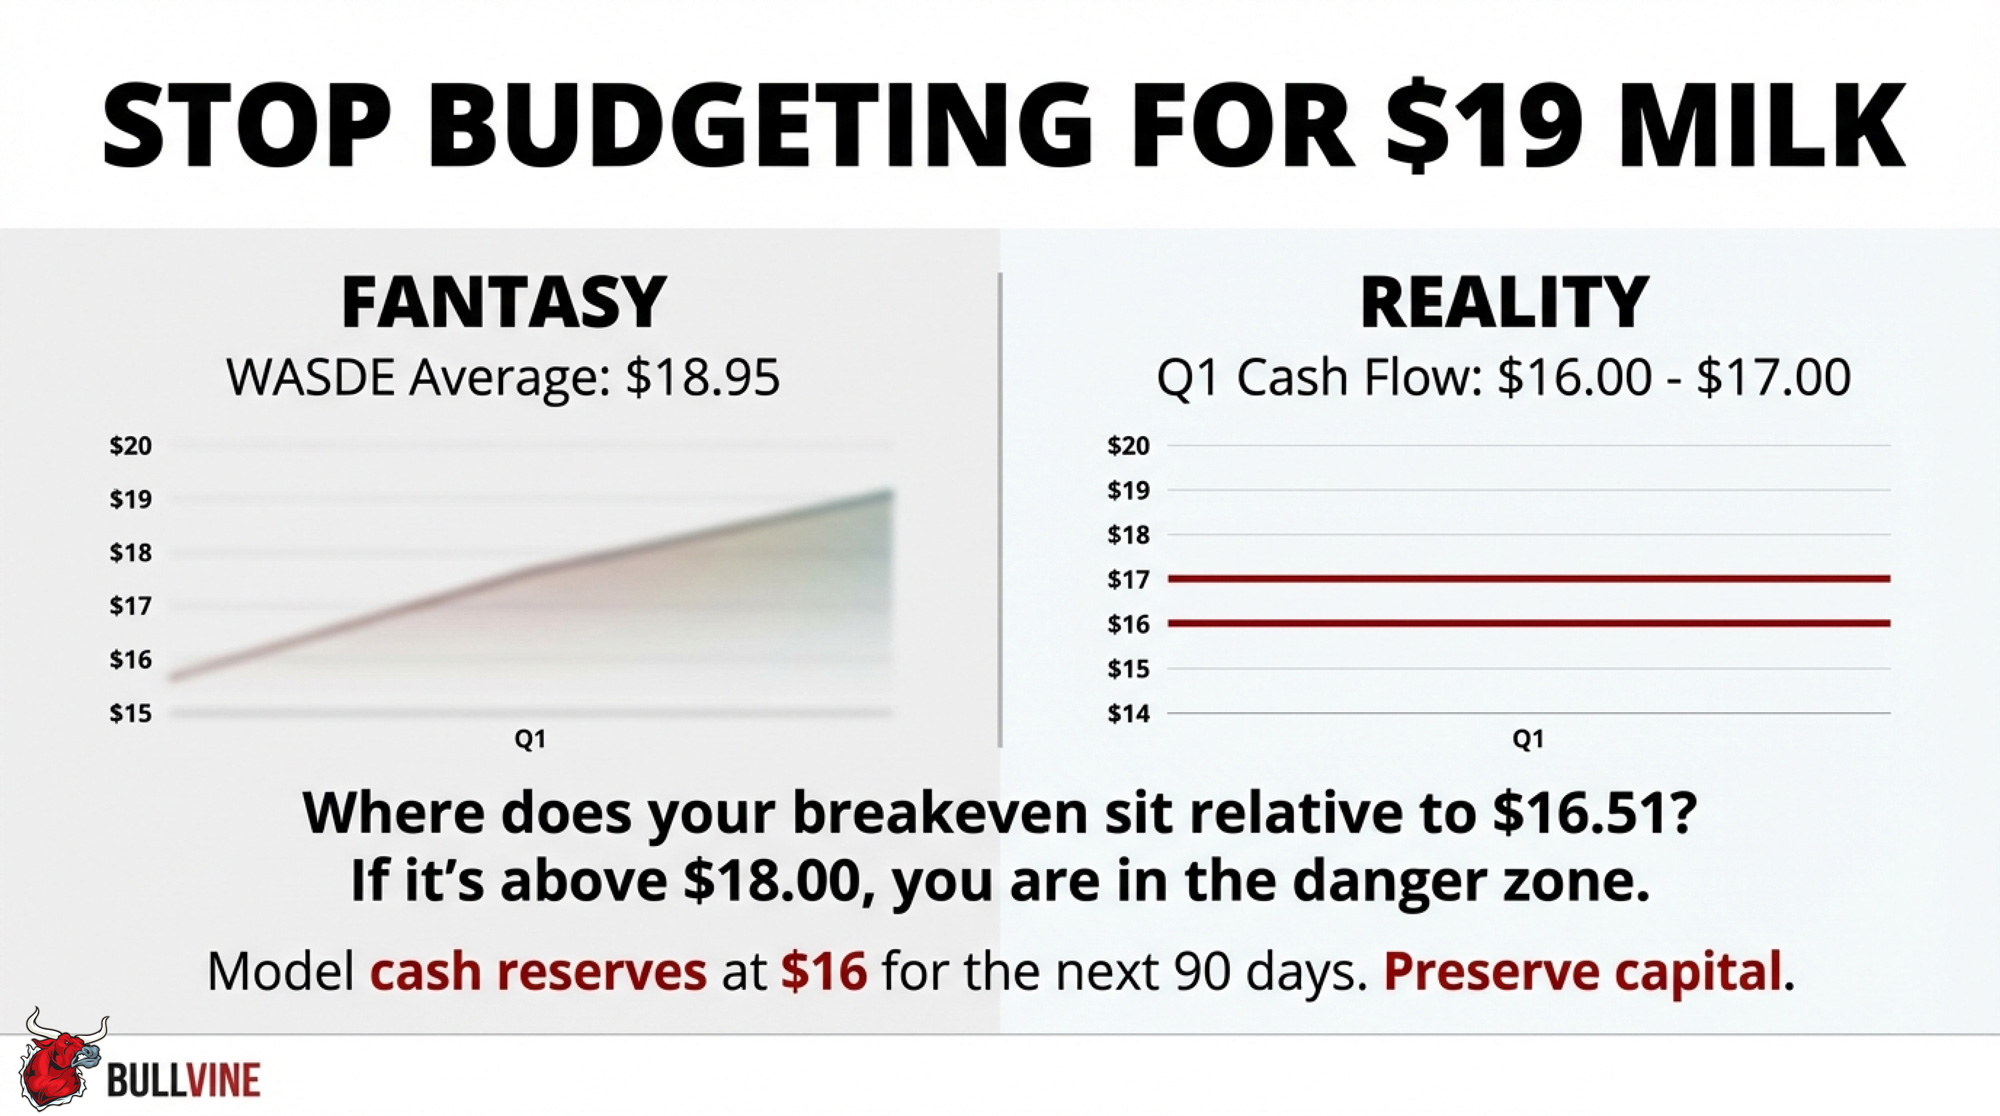
- Model cash flow at $16–$17 Class III, not the $18.95 annual WASDE average. Your March and April checks reflect January and February commodity prices, which were ugly. If your all-in cost of production sits above $18/cwt, model your cash reserve at $16 Class III for Q1 and count the months of runway.
- Pull your handler’s utilization report. In Federal Order 30, Class IV depooling thinned the pool all through 2025. If you don’t know where your milk is classified, you can’t evaluate whether this spread is working for or against you.
- Push components hard. At January’s $1.4525/lb butterfat and $2.1768/lb protein, each tenth of a percent in BF and protein combined is worth $46,400/year on a 500-cow herd. Talk to your nutritionist about transition cow protocols and bunk management — that’s where the cheapest gains live.
By year-end:
- Section 179 planning. The OBBBA raised Section 179 expensing to $2.5 million with 100% bonus depreciation through 2030. But borrowing to buy equipment to save on taxes only works if you can service the debt at $16 milk. Run those numbers with your accountant before your lender does.
- Watch the July USMCA review. The mandatory six-year joint review hits July 1, 2026. Canada and Mexico bought $3.6 billion in U.S. dairy in 2024 — roughly 44% of the $8.2 billion total export value that year. In 2025, U.S. dairy exports surged to a confirmed $9.51 billion, nearly matching the $9.54 billion record set in 2022. But Canada’s TRQ fill rates still average just 42%. NMPF’s Shawna Morris argues that Canada remains “technically compliant with USMCA’s text, commercially limiting in practice.” If you’re in a co-op with significant North American export exposure, the July outcome shapes your 2027 milk price more than anything on the CME right now.
Key Takeaways
- If your handler’s blend is more than $1.50/cwt below a pure Class IV value, this spread is actively costing your herd real money.
- At $7.52/cwt projected January margin, one DMC indemnity month at $9.50 can pay several years of premiums on your Tier 1 volume — but only if you’re enrolled before February 26.
- Each combined 0.1% gain in butterfat and protein is worth about $46,400/year on a 500-cow herd at today’s component prices.
The Bottom Line
The futures curve says relief is coming. Your January check says it hasn’t arrived yet. That 600-cow Wisconsin freestall operation profiled in The Bullvine’s January analysis — the one facing a $250,000 margin gap between full cost of production and what 2026 futures actually deliver? They stress-tested at $16 milk, trimmed 50–75¢/cwt from their breakeven through tighter heifer programs and lease renegotiations, and showed their lender a plan built off conservative numbers. The lender, seeing they were budgeting off realistic prices and actively adjusting, worked with them on amortization flexibility.
The producers who come out of this spring in good shape won’t be the ones who waited for $19. They’ll be the ones who ran their numbers at $16 and made decisions accordingly.
Where does your breakeven sit relative to $16.51 Class III? That’s the only number that matters this week.
Complete references and supporting documentation are available upon request by contacting the editorial team at editor@thebullvine.com.
Learn More
- GT Thompson’s 2026 Farm Bill Math: DMC Pays Your 200‑Cow Dairy $1,800, Make Allowances Cut $42,240 – a 23 to 1 Hit – Stop guessing about the Farm Bill’s impact. This breakdown exposes the 23-to-1 gap between new DMC payments and structural make-allowance losses, arming you with a 90-day playbook to protect your margins before the math catches up.
- FMMO Pays $1.71/lb for Butterfat Worth $2.95: What USDA’s December Report Tells You About Your Milk Check in 2026 – Uncover the hidden forces draining your component check. This report reveals why your butterfat is worth $1.24 more on the global market than your check reflects, arming you with the data to negotiate better processor premiums.
- Dairy Tech ROI: The Questions That Separate $50K Wins from $200K Mistakes – Cut through the trade-show hype and discover which innovations actually move the needle. This guide exposes the $200,000 mistakes in automation, arming you with the scale-specific ROI benchmarks that separate profitable disruptors from the struggling.
 Join the Revolution!
 Join the Revolution!
Join over 30,000 successful dairy professionals who rely on Bullvine Weekly for their competitive edge. Delivered directly to your inbox each week, our exclusive industry insights help you make smarter decisions while saving precious hours every week. Never miss critical updates on milk production trends, breakthrough technologies, and profit-boosting strategies that top producers are already implementing. Subscribe now to transform your dairy operation’s efficiency and profitability—your future success is just one click away.


