


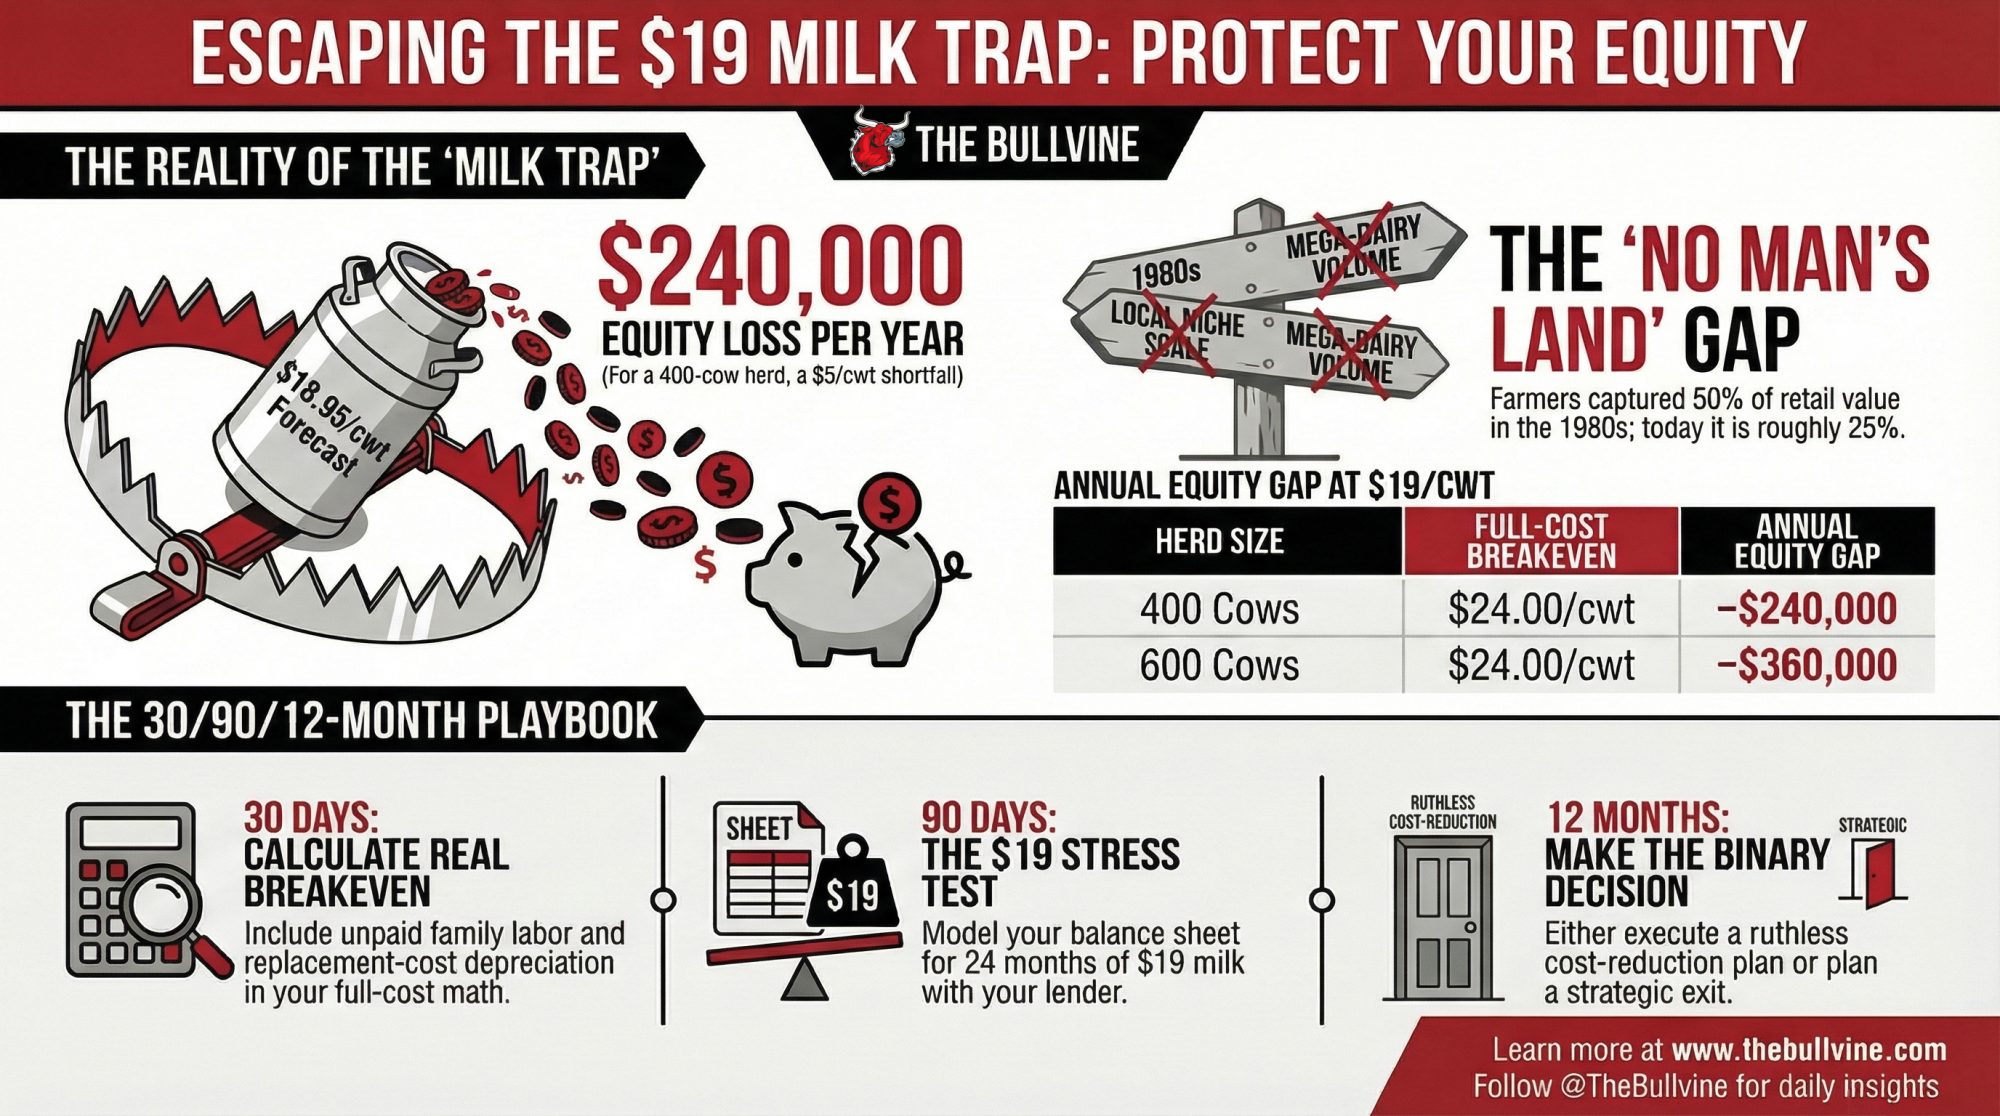
At $19 milk, a 400‑cow herd can watch $240,000 in equity vanish in 12 months. The kicker? Retail prices barely blink—and your co‑op’s plants keep humming.
Executive Summary: USDA’s February WASDE pegs 2026 all‑milk at $18.95/cwt while full costs for many 300–500 cow herds sit in the low‑ to mid‑$20s, creating a structural gap you can’t efficiency‑your‑way out of. For a 400‑cow herd shipping 120 cwt/cow, a $5/cwt shortfall is roughly $240,000 a year coming straight out of family equity, not your feed mill or co‑op. At the same time, farm‑value share of the total dairy basket has slid into the mid‑20s while processors and retailers capture the growth from cheese, yogurt, and value‑added products. A handful of big co‑ops now market most U.S. fluid milk, which means many mid‑size herds effectively have one practical buyer and an announced price, not a negotiated one. The article walks through the barn math, the processing and policy mechanics behind “cheap milk,” and why 400‑cow commodity herds are stuck in a no man’s land between direct‑to‑consumer scale and mega‑dairy leverage. It then lays out a 30/90/12‑month playbook to calculate your real breakeven, stress‑test $19 milk with your lender, and decide whether you’re staying, pivoting to a premium path, or planning a strategic exit while you still have equity.
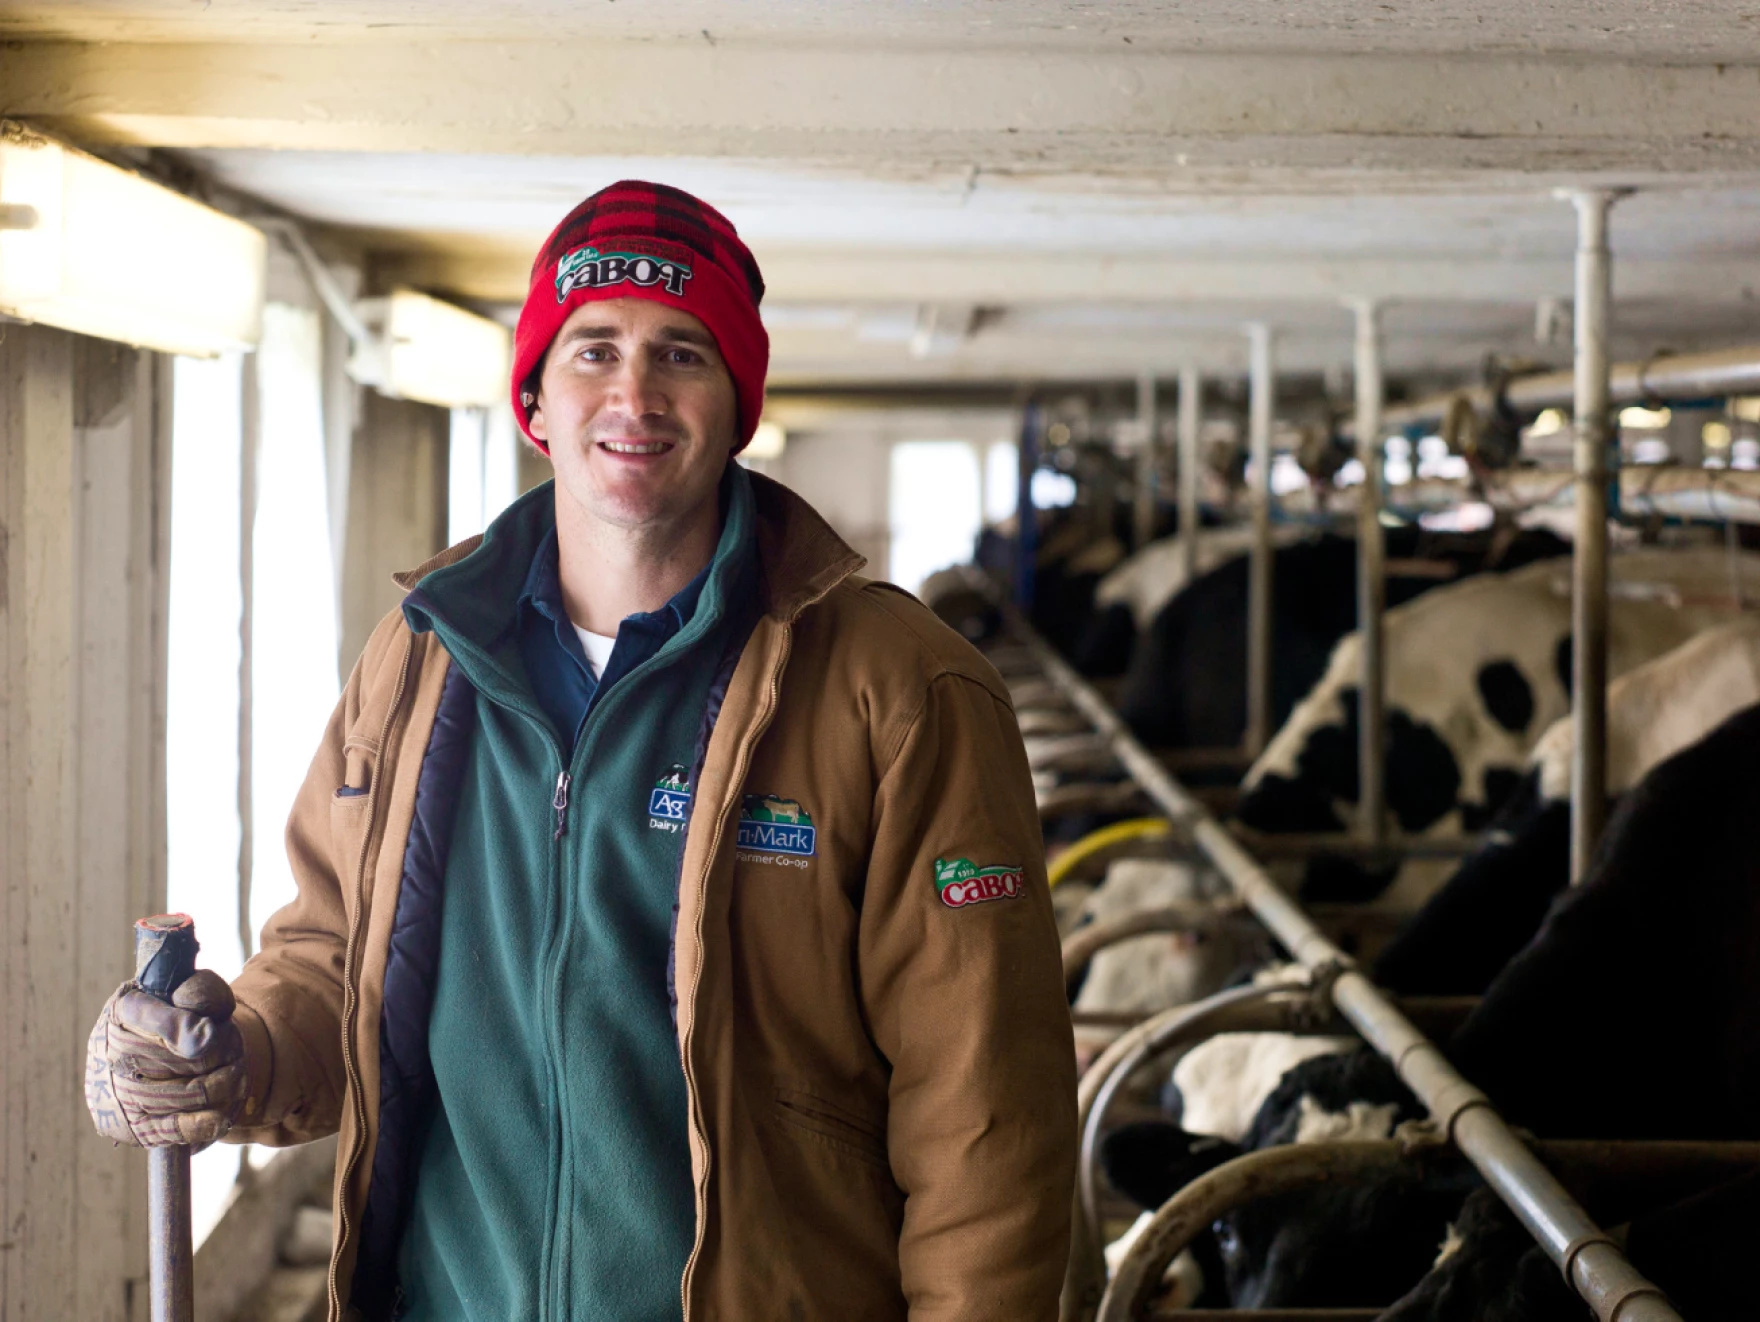
Blake Gendebien milks cows and runs for Congress in northern New York. Earlier this year, he told voters that milk prices “currently are no higher than they were in the 1980s.” PolitiFact dug into Bureau of Labor Statistics data and rated the claim Mostly True: since January 1980, the retail price of whole milk has roughly doubled — from about $2.03 to $4.03 per gallon — while overall consumer prices have more than quadrupled over the same period (U.S. national averages through early 2026).
Adjusted for inflation, milk is cheaper now than when many of your freestall barns were first poured.
If you’re a 400‑cow operator shipping into a commodity market, that “cheaper milk” story isn’t a win — it’s your pricing trap.
The Food Dollar: Where Did Your Share Go?
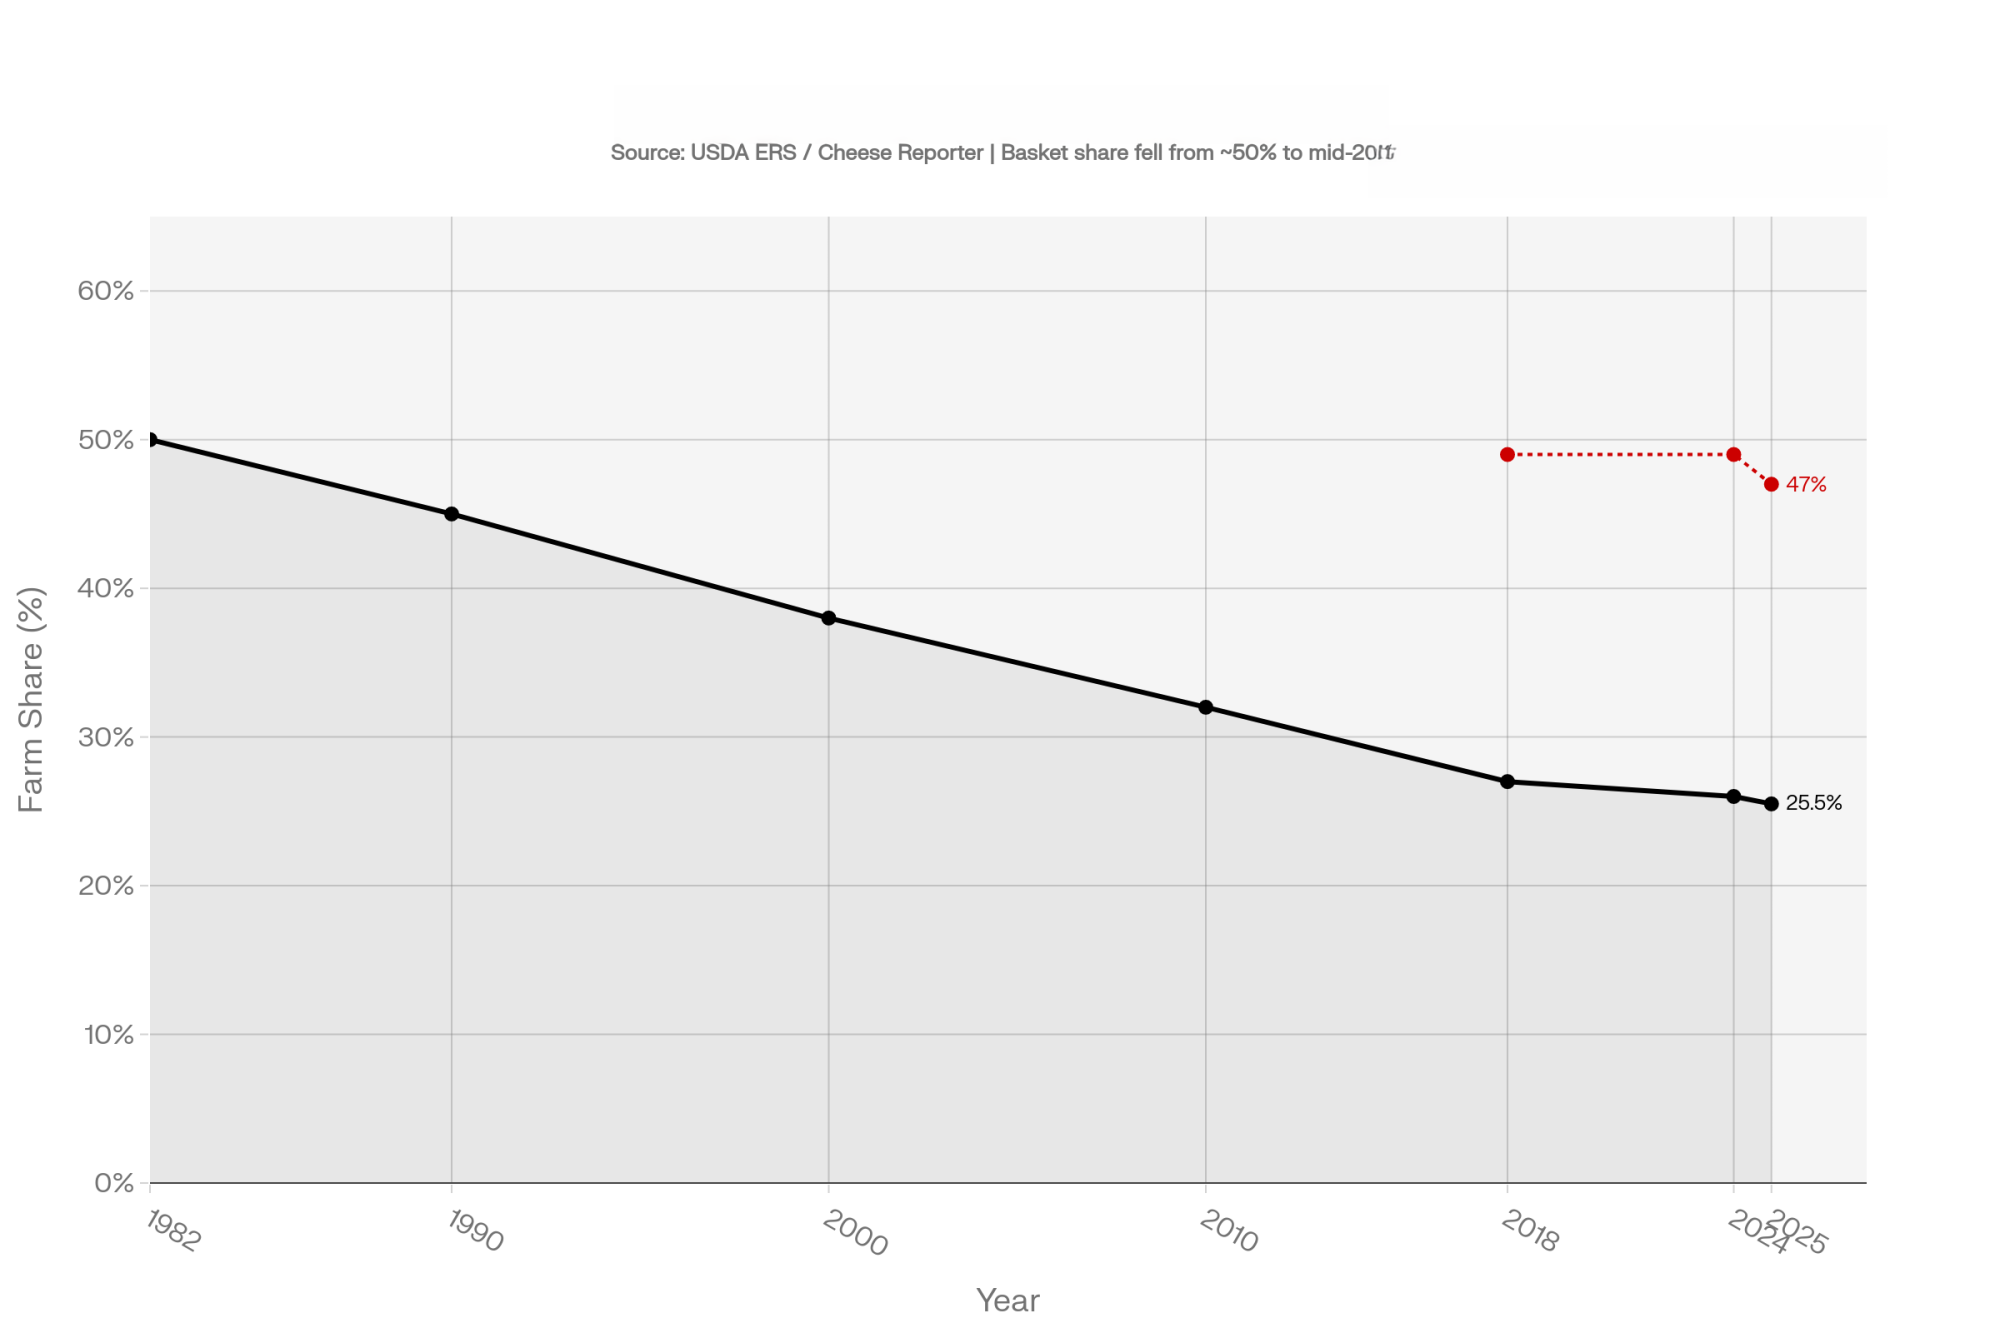
In the early 1980s, USDA Economic Research Service data and historical price‑spread estimates suggest U.S. dairy farmers captured on the order of half of the retail value of the average dairy product basket — milk, cheese, butter, yogurt, the whole cart. That’s based on food‑dollar farm‑share levels in the early 1980s plus reconstructed dairy price‑spreads, not a single official dairy‑basket point, so treat it as an informed estimate rather than a precise cent value.
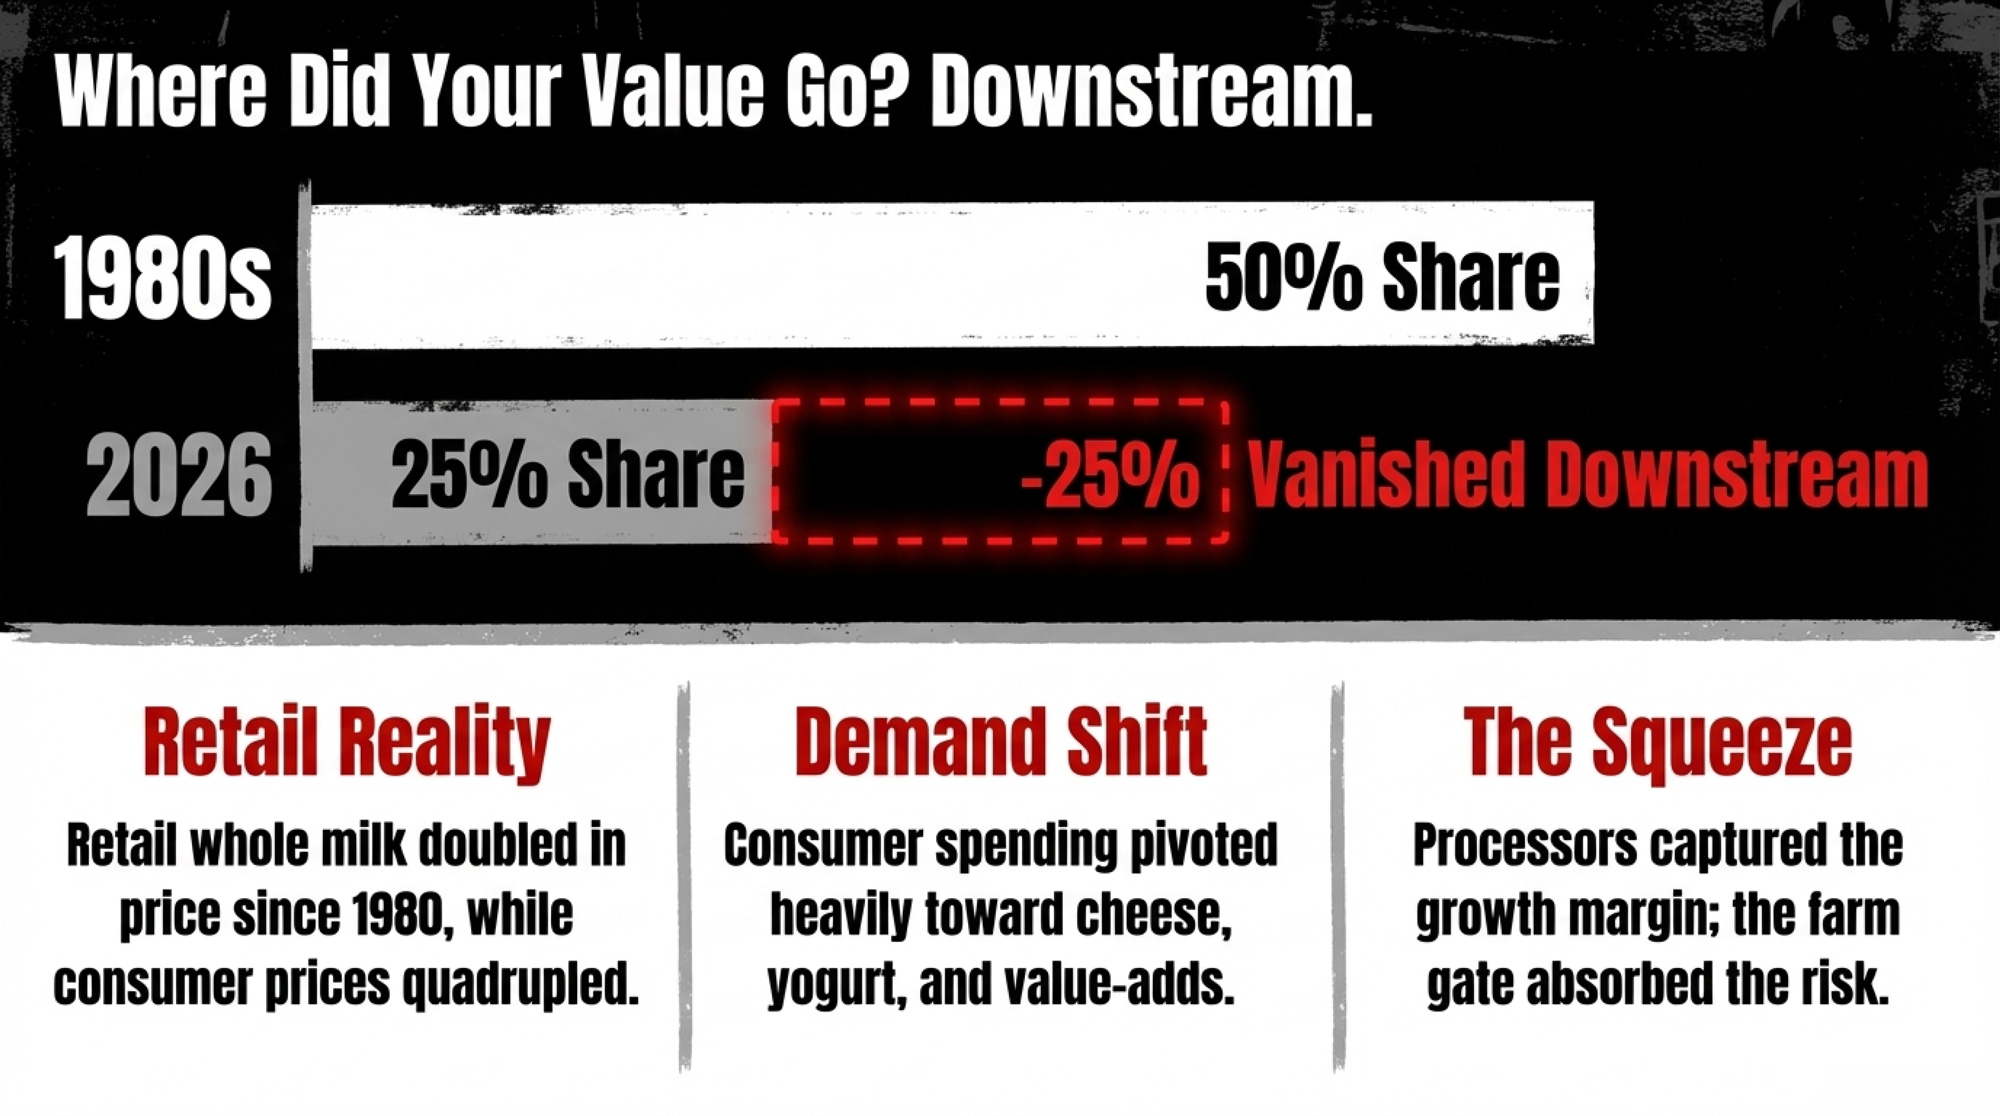
By 2025, that farm‑value share across the dairy basket had dropped to about 25–26%, according to USDA ERS farm‑to‑retail price‑spread data summarized by Cheese Reporter in April 2026. In the same report, ERS data showed the farm share of a gallon of whole milk at 47%.
Two clarifications that matter for this conversation:
- For fluid whole milk alone, USDA ERS data show the farmer still receives roughly half the retail price — the farm share for whole milk declined from 49% to 47% between 2024 and 2025.
- For the total dairy product basket, where consumer spending has shifted heavily toward cheese, yogurt, ice cream, and other processed products, the farm‑value share has fallen into the mid‑20s — because the additional processing, marketing, and retail value in those products accrues downstream.
The system quietly shifted from paying you for milk to paying the chain for “dairy products” — and most of that extra value never came back up your lane.
The Global Reality: Prices Rise Fast, Fall Slow
A long run of academic work on dairy price transmission in Canada, parts of Europe, and other markets often finds the same pattern: retail prices tend to move up more quickly when farm‑gate prices rise than they move down when farm‑gate prices fall.
Some studies document several‑month lags before retail prices fully reflect lower farm prices, especially in markets where processing and retail are more concentrated. When your milk cheque drops fast, and the shelf price barely budges, that’s what you’re living.
That “up fast, down slow” pattern is the fingerprint of pricing power — and it’s on the processor/retail side, not in your parlor.
What Does $19 Milk Really Mean for a 400‑Cow Dairy?
Here’s the math that matters when you sit down with your lender.
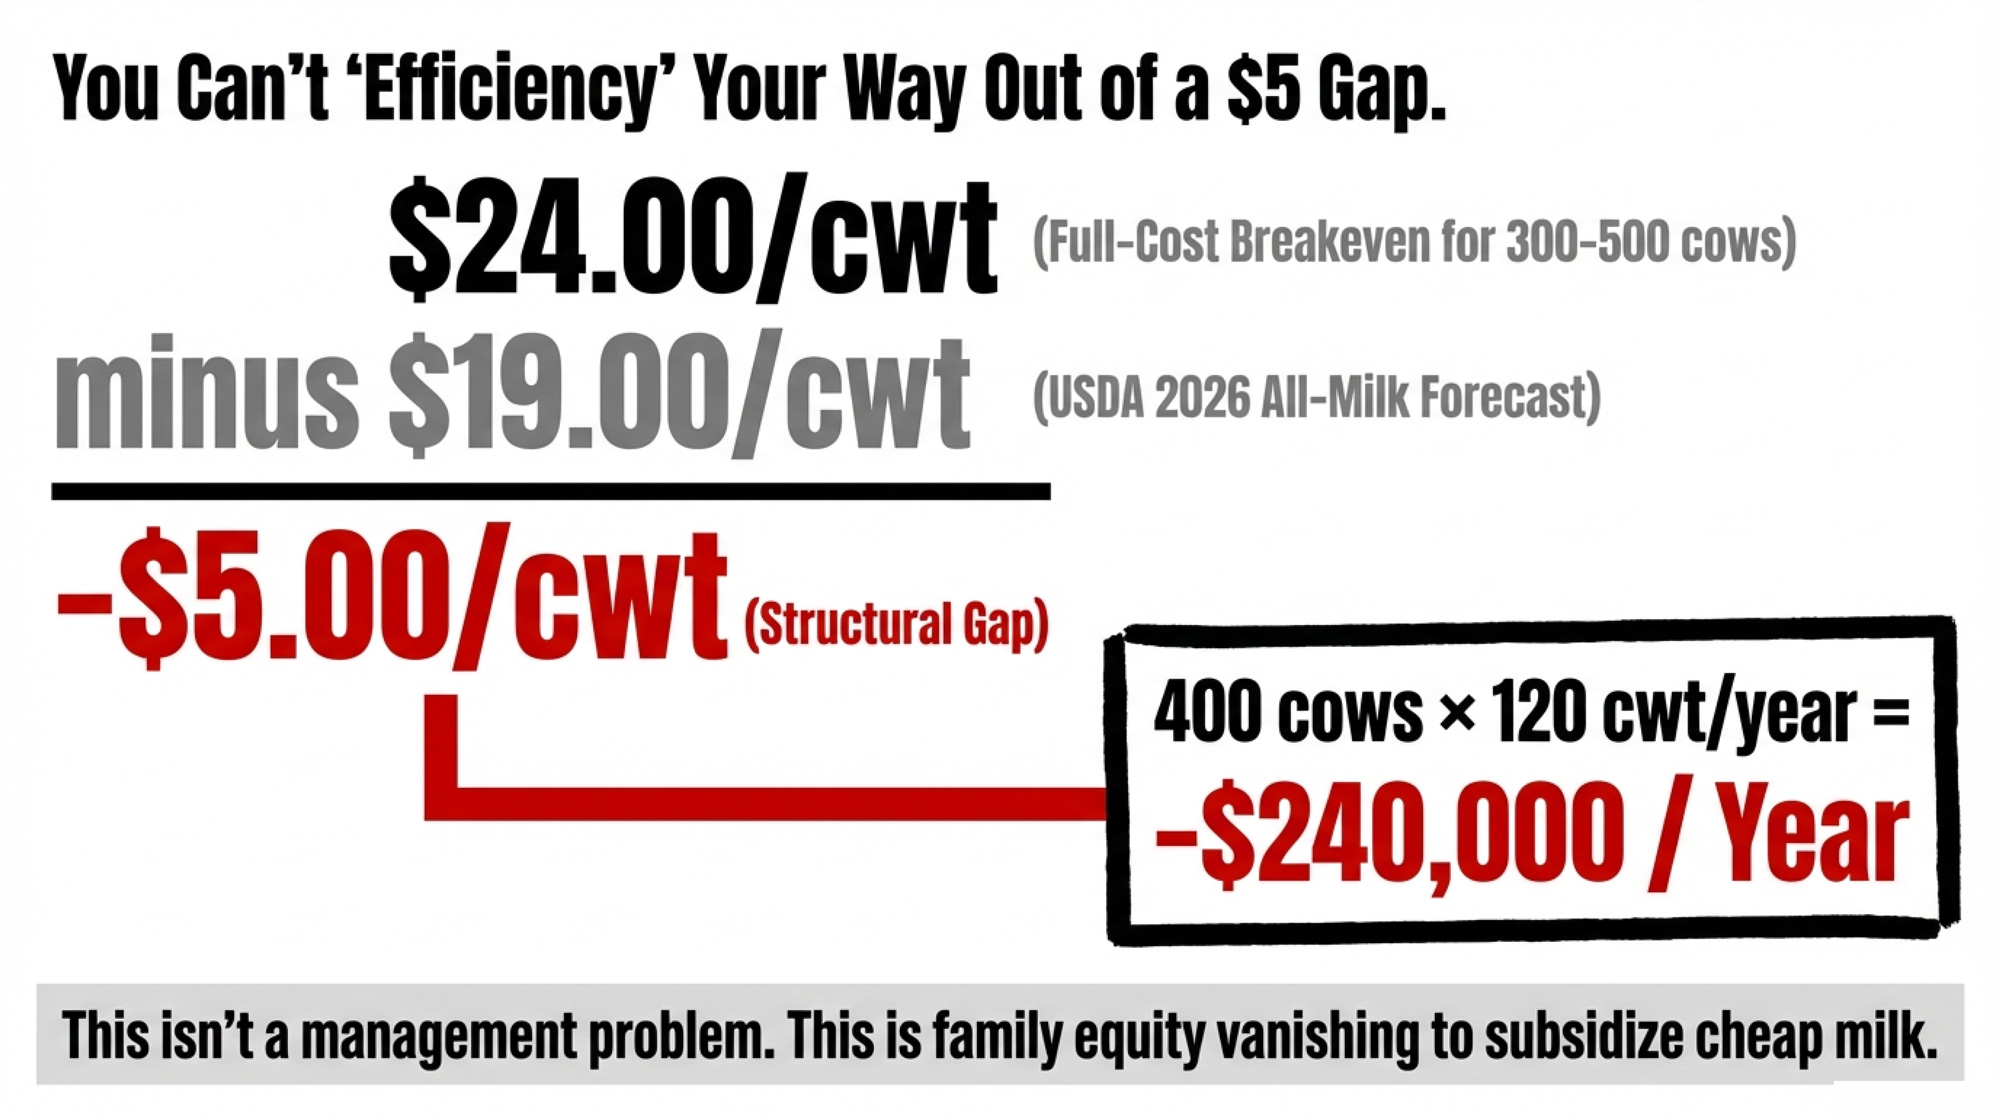
USDA’s February 2026 World Agricultural Supply and Demand Estimates (WASDE‑668) put the 2026 all‑milk price forecast at $18.95/cwt, up from earlier projections but still below many farms’ full cost of production. For simplicity, we’re rounding that to $19/cwt as a working number for barn math.
On the cost side, USDA ERS cost‑of‑production data and The Bullvine’s February 2026 analysis found full costs — including unpaid family labor valued at $18–22/hour and depreciation at replacement cost — near $19.14/cwt for 2,000‑plus cow herds, with smaller herds substantially higher. For 300–500 cow herds, that realistically puts full costs somewhere in the low‑ to mid‑$20s.
Split the difference. Use $24/cwt as a mid‑range full‑cost breakeven for a 400‑cow commodity herd.
Running the Numbers: Annual Gap at 400 Cows
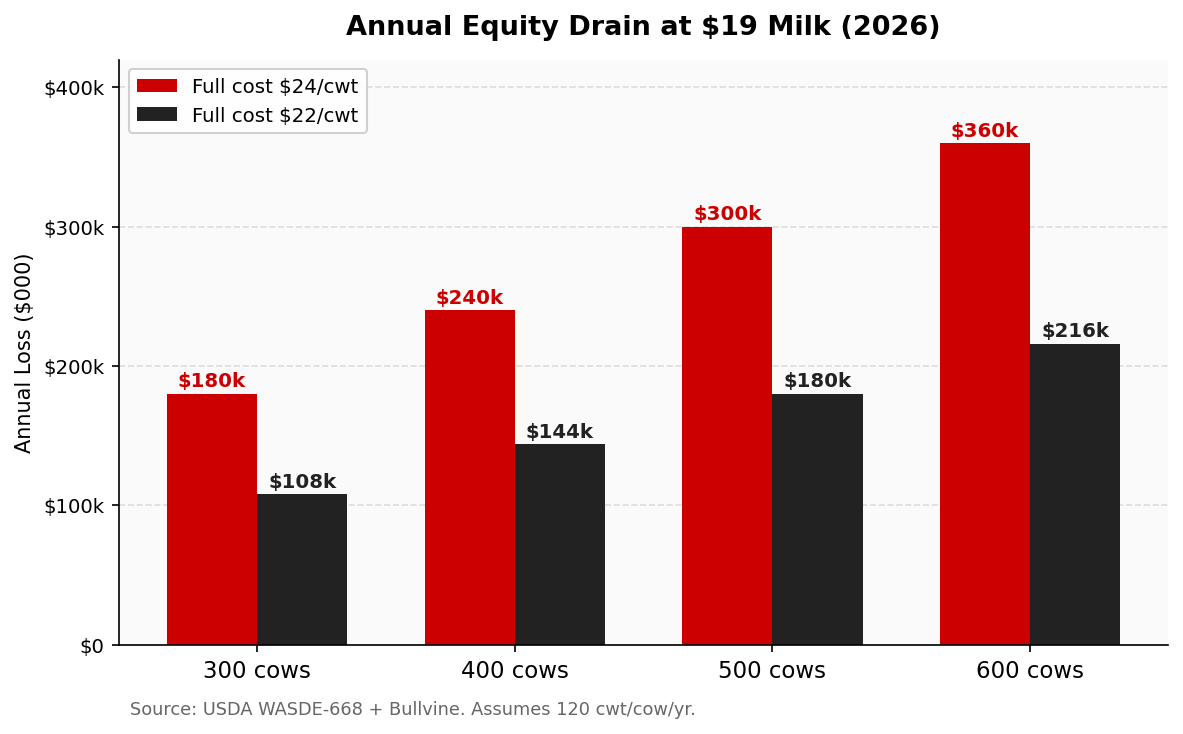
- Full‑cost breakeven (mid‑range): $24.00/cwt (300–500 cow herd, including unpaid labor and depreciation)
- Projected 2026 all‑milk price: $19.00/cwt (USDA $18.95/cwt forecast, rounded)
- Gap: −$5.00/cwt
- Assume 120 cwt shipped per cow per year (~24,000 lbs)
400 cows × $5.00/cwt × 120 cwt = −$240,000/year 600 cows × $5.00/cwt × 120 cwt = −$360,000/year
If your actual full‑cost breakeven is $22/cwt — leaner operation, lower debt — the gap shrinks but doesn’t vanish:
400 cows × $3.00/cwt × 120 cwt = −$144,000/year
This is the kind of barn math Gendebien is pointing at when he tells voters milk is “no higher than the 1980s.” He’s right about the price. He’s also describing why the farms behind that price are disappearing.
If your full cost sits above $19, you’re not “breaking even with belt‑tightening” — you’re bleeding equity, one cwt at a time.
Now layer this on top: while you absorb that gap, Leprino Foods committed about $1 billion to its Lubbock, Texas, mozzarella complex, Hilmar Cheese announced a roughly $600 million facility in Dodge City, Kansas, and IDFA’s Michael Dykes has highlighted more than $11 billion in new or expanded U.S. dairy manufacturing investments across multiple states.
You’re told to “manage through the cycle” while processors invest billions into plants designed around abundant, relatively cheap milk. That isn’t a coincidence — it’s how their business model works when the supply side carries most of the price risk.
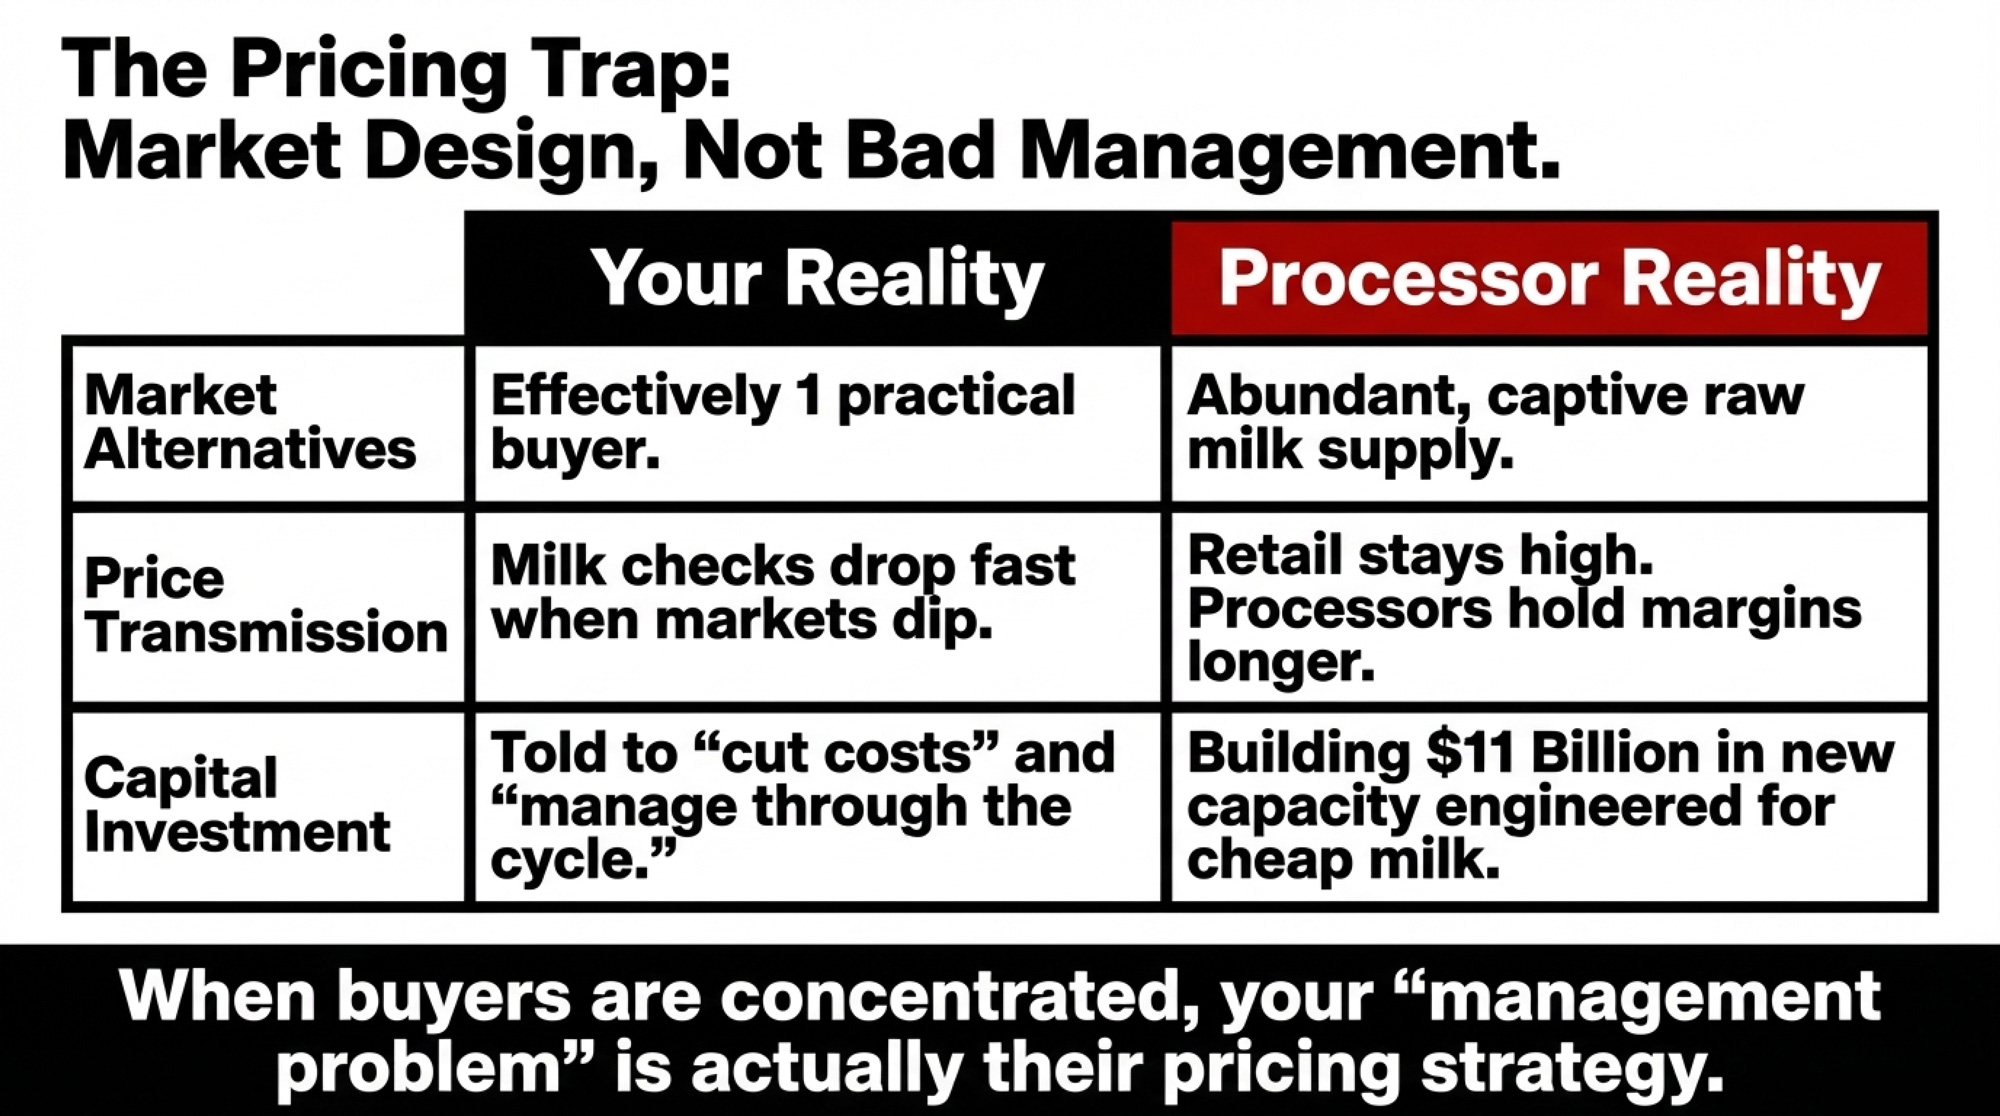
The Pricing Trap: Management Problem or Market Design?
Every time margins get thin, the message is the same: cut costs, tweak rations, adopt new tech, manage risk better. And if none of that works, the implication is clear — you just aren’t competitive enough.
International research on dairy supply‑chain bargaining tells a different story. Several studies across the EU, Iran, and other markets find that processors hold significantly more leverage than farmers when prices are set — and that this asymmetry can be more pronounced for smaller operations than for mega‑dairies. The structural tilt isn’t about your skills. It’s about how many buyers there are for your milk.
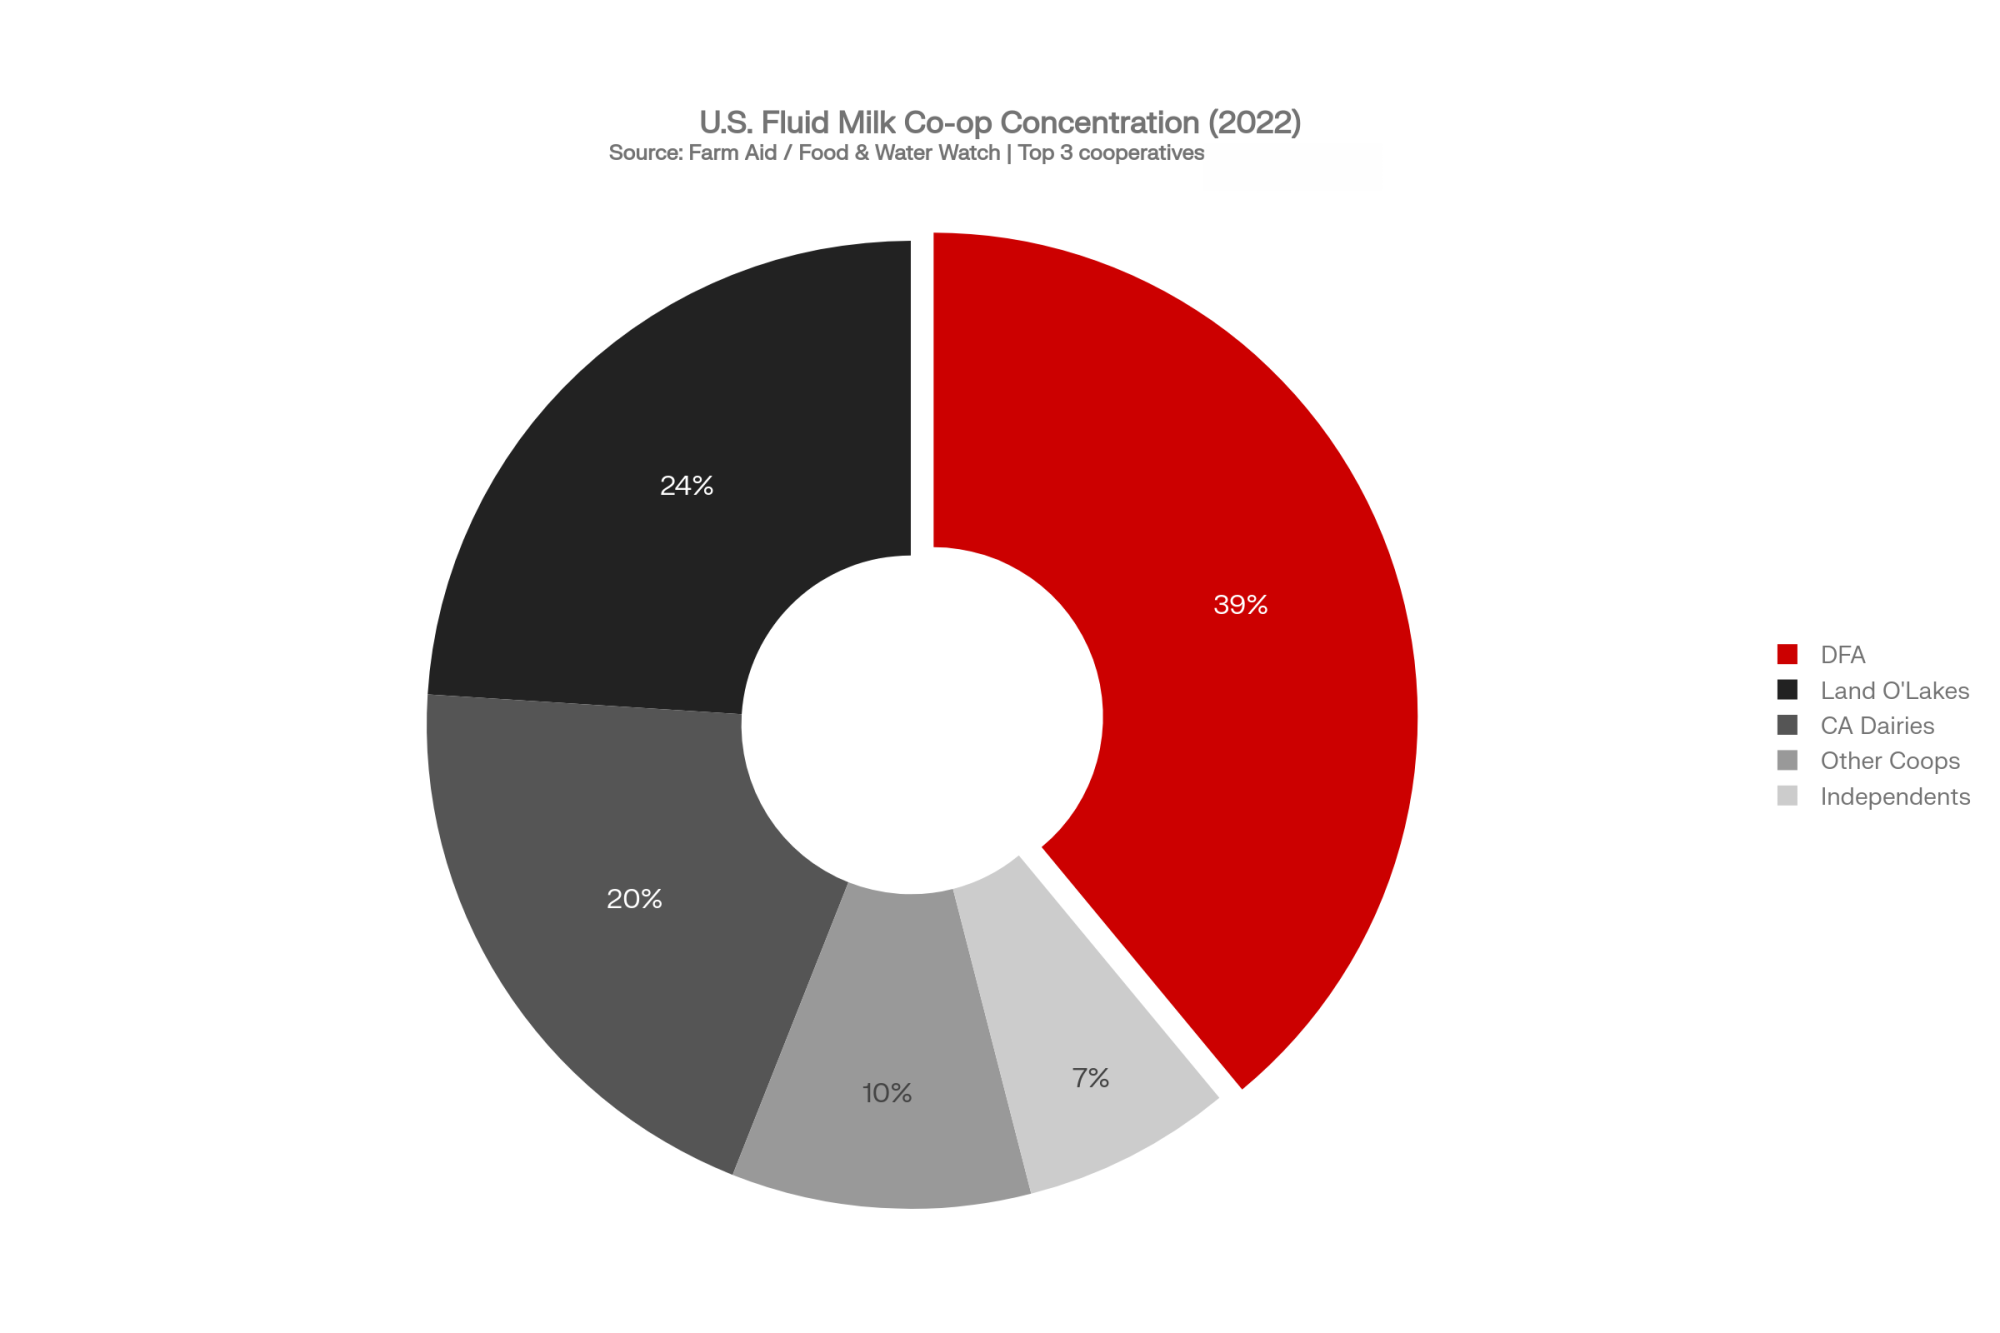
A 2023 Farm Aid analysis, citing Food & Water Watch’s The Dirty Dairy Racket report, noted that Dairy Farmers of America is the largest U.S. dairy cooperative, marketing about 39% of all fluid milk sales, and that in 2022 just three cooperatives — DFA, Land O’Lakes, and California Dairies — together marketed around 83% of all U.S. fluid milk. In a lot of U.S. milk sheds, producers say that once they factor in co‑op territories and hauling realities, they effectively have only one practical buyer if they want to stay in Grade A markets in their region.
When there’s effectively only one practical buyer in your area, and that buyer also owns processing plants, your leverage over price is limited. Under most Federal Order structures, producers are essentially working off an announced price plus premiums, not a fully negotiated one.
In July 2022, a federal class‑action lawsuit filed in Vermont alleged that DFA used its dominant Northeast position in ways that limited farmers’ marketing alternatives and kept farm‑gate prices lower to benefit its processing interests. DFA responded in a public statement that the allegations were “baseless and completely without merit,” and as of early 2026, the case remains pending before the court.
Separately, Dairy Farmers of America and Select Milk Producers have agreed to settle a Southwest price‑fixing case for a combined total of about $34 million. Reuters and other outlets report that DFA agreed to pay roughly $24.5 million and Select about $9.9 million, and coverage notes that the settlement allows the co‑ops to resolve the case without continuing litigation and without any findings of liability against them.
The more concentrated your buyers are, the more your “management problem” starts to look like their pricing strategy.
The Processing Paradox: $11 Billion in Plants Is a Warning Sign
On paper, billions in new dairy processing capacity sounds like a success story. New jobs, new export volume, and more demand for milk. That’s how it’s sold at ribbon cuttings.
For a 400‑cow commodity herd, it’s more complicated.
Those plants are engineered to run flat‑out. They’re built on the assumption that raw milk will stay plentiful and relatively cheap. Their investors win when:
- Milk supply is reliable and abundant.
- The spread between farm‑gate prices and wholesale/retail prices stays wide enough to cover costs and returns.
- Price transmission lets them hold margin longer when your milk cheque drops.
When you see a new plant announced in your region, the right question isn’t “Will this save my dairy?” — it’s “How much of that investment depends on my milk staying cheap?”
The Canadian Contrast: Stability at a Price
North of the border, Canada runs dairy on different rules. The Canadian Dairy Commission uses a national formula — built roughly on 50% indexed cost of production and 50% Consumer Price Index — to set annual farm‑gate adjustments for industrial milk. For 2026, that formula produced about a 2.33% increase in the support price effective February 1, based on a 2.7% increase in the cost of production and a 1.9% CPI rise. When input costs rise, part of that pain is explicitly built into what farmers receive.
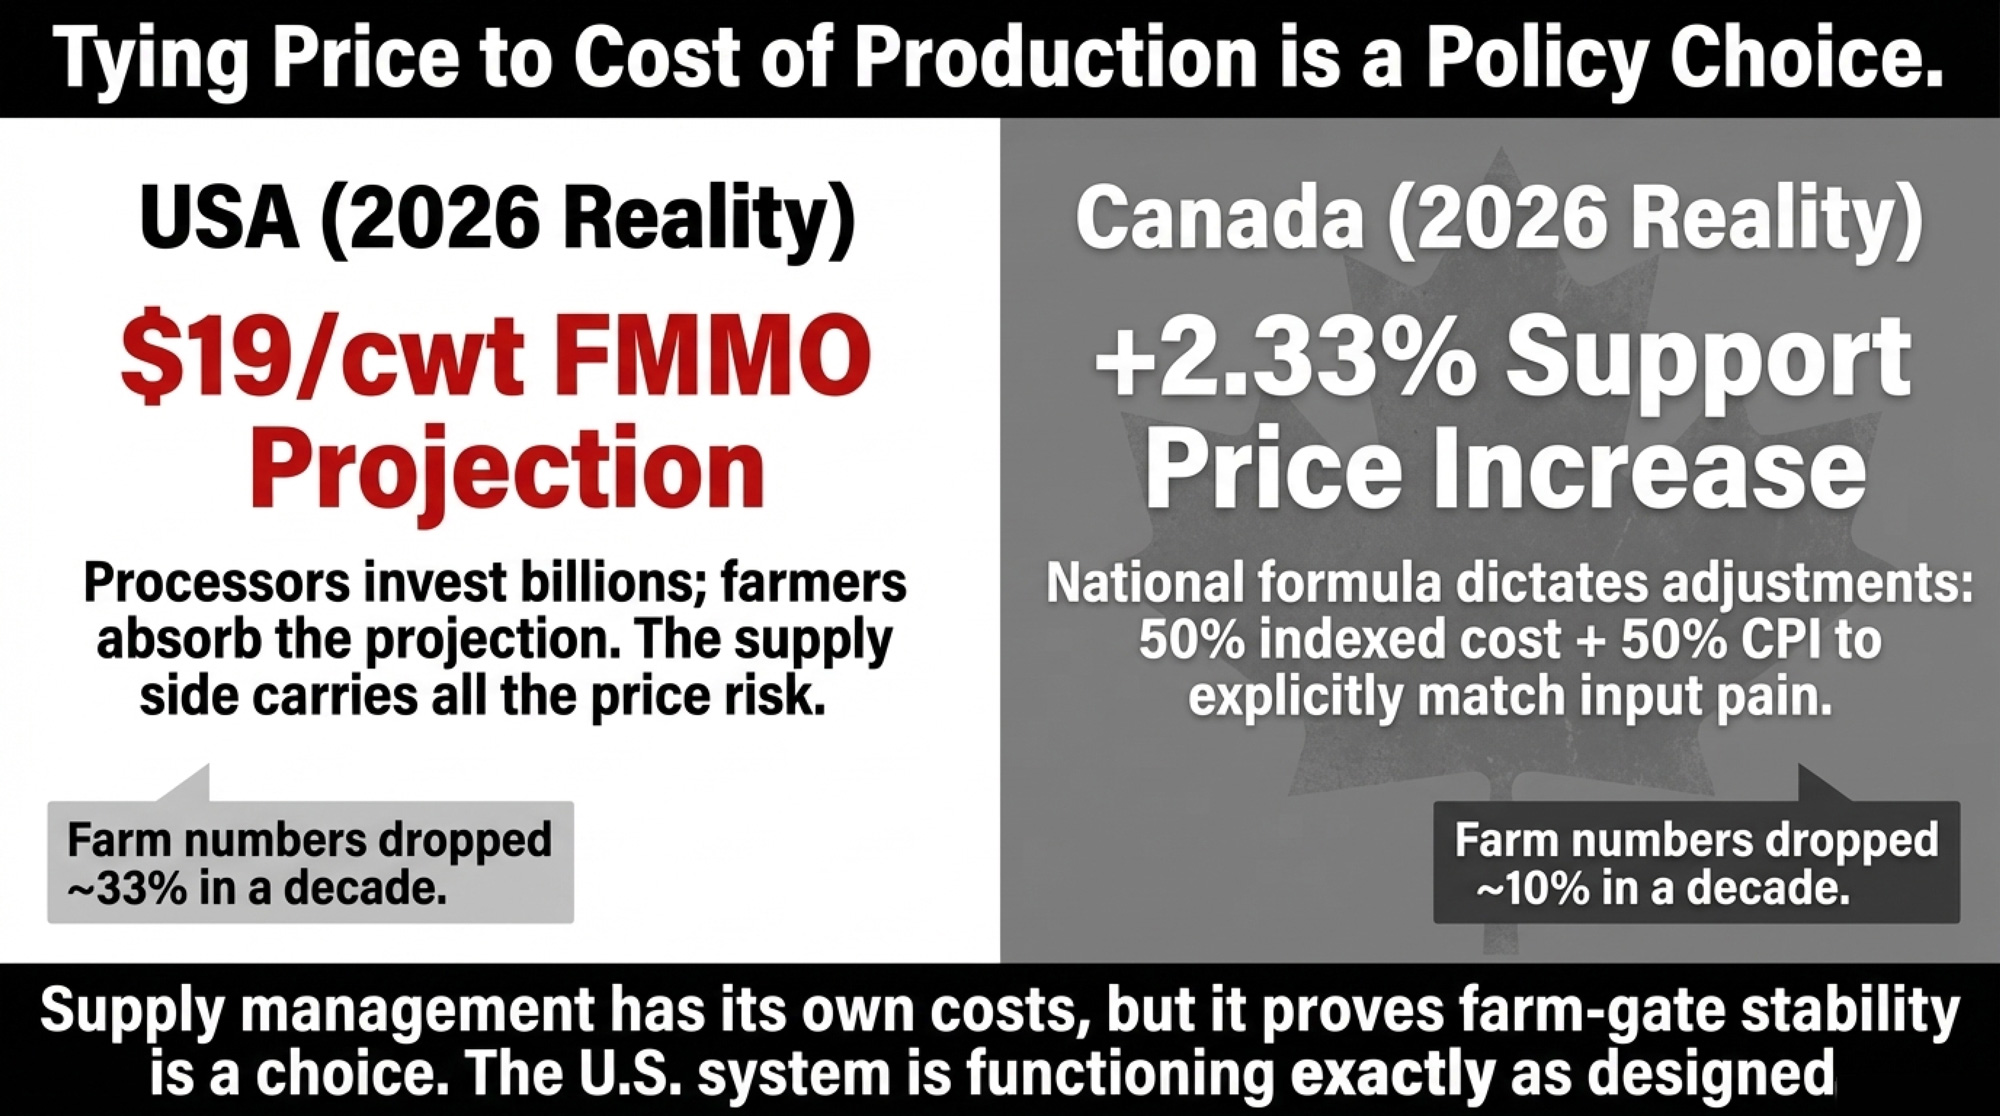
Between the mid‑2010s and early 2020s, Canadian census and USDA data show dairy farm numbers dropping by roughly a tenth in Canada and by around a third in the U.S. Both countries are consolidating. The pace looks very different on the ground.
Stability has a bill. Multiple Canadian policy and think‑tank analyses estimate that supply management raises the average household’s annual cost for dairy, eggs, and poultry by roughly CAD $300–$450, compared to an open market. High quota values also create a steep barrier for young or new entrants — a different kind of problem than what U.S. operators face, but a real one.
During COVID, when U.S. producers dumped milk and scrambled for emergency payments, a 2020 Canadian policy paper found that supply‑managed sectors were “more resilient” because “producers are generally more financially stable, losses are pooled, and production and marketing efforts are coordinated.”
Canadian supply management isn’t a fantasy — it’s proof that tying farm‑gate prices to the cost of production is a policy choice, not an economic impossibility.
| Factor | 🇨🇦 Canada (Supply Managed) | 🇺🇸 United States (Open Market) |
|---|---|---|
| Farm-gate price setting | Formula: 50% cost of production + 50% CPI | FMMO announced price + premiums; no cost-of-production link |
| 2026 price adjustment | +2.33% effective Feb. 1 (cost + CPI formula) | USDA WASDE forecast: $18.95/cwt — below many farms’ full cost |
| Farm number decline (2015–2023) | ~10% reduction | ~33% reduction |
| COVID resilience | Supply-managed sectors “more resilient”; losses pooled | U.S. producers dumped milk; emergency payments required |
| Consumer cost premium | ~CAD $300–$450/household/yr for dairy, eggs, poultry | Lower shelf price; cost burden shifted to farm balance sheets |
| New entrant barrier | High quota values ($30,000–$40,000+/cow equivalent) | Low entry barrier; market access not guaranteed |
| Processor relationship | Coordinated; farm price moves with input costs | Processors capture spread asymmetry; “up fast, down slow” |
| Verdict | Stable farms, high consumer cost, closed to growth | Cheap milk, consolidating farms, processor-advantaged pricing |
The 400‑Cow “No Man’s Land.”
A 100‑cow pasture dairy with low debt and a strong local brand might have a shot at direct‑to‑consumer or niche premiums. A 4,000‑cow desert unit has the volume, scale, and lender relationships to negotiate harder and spread fixed costs.
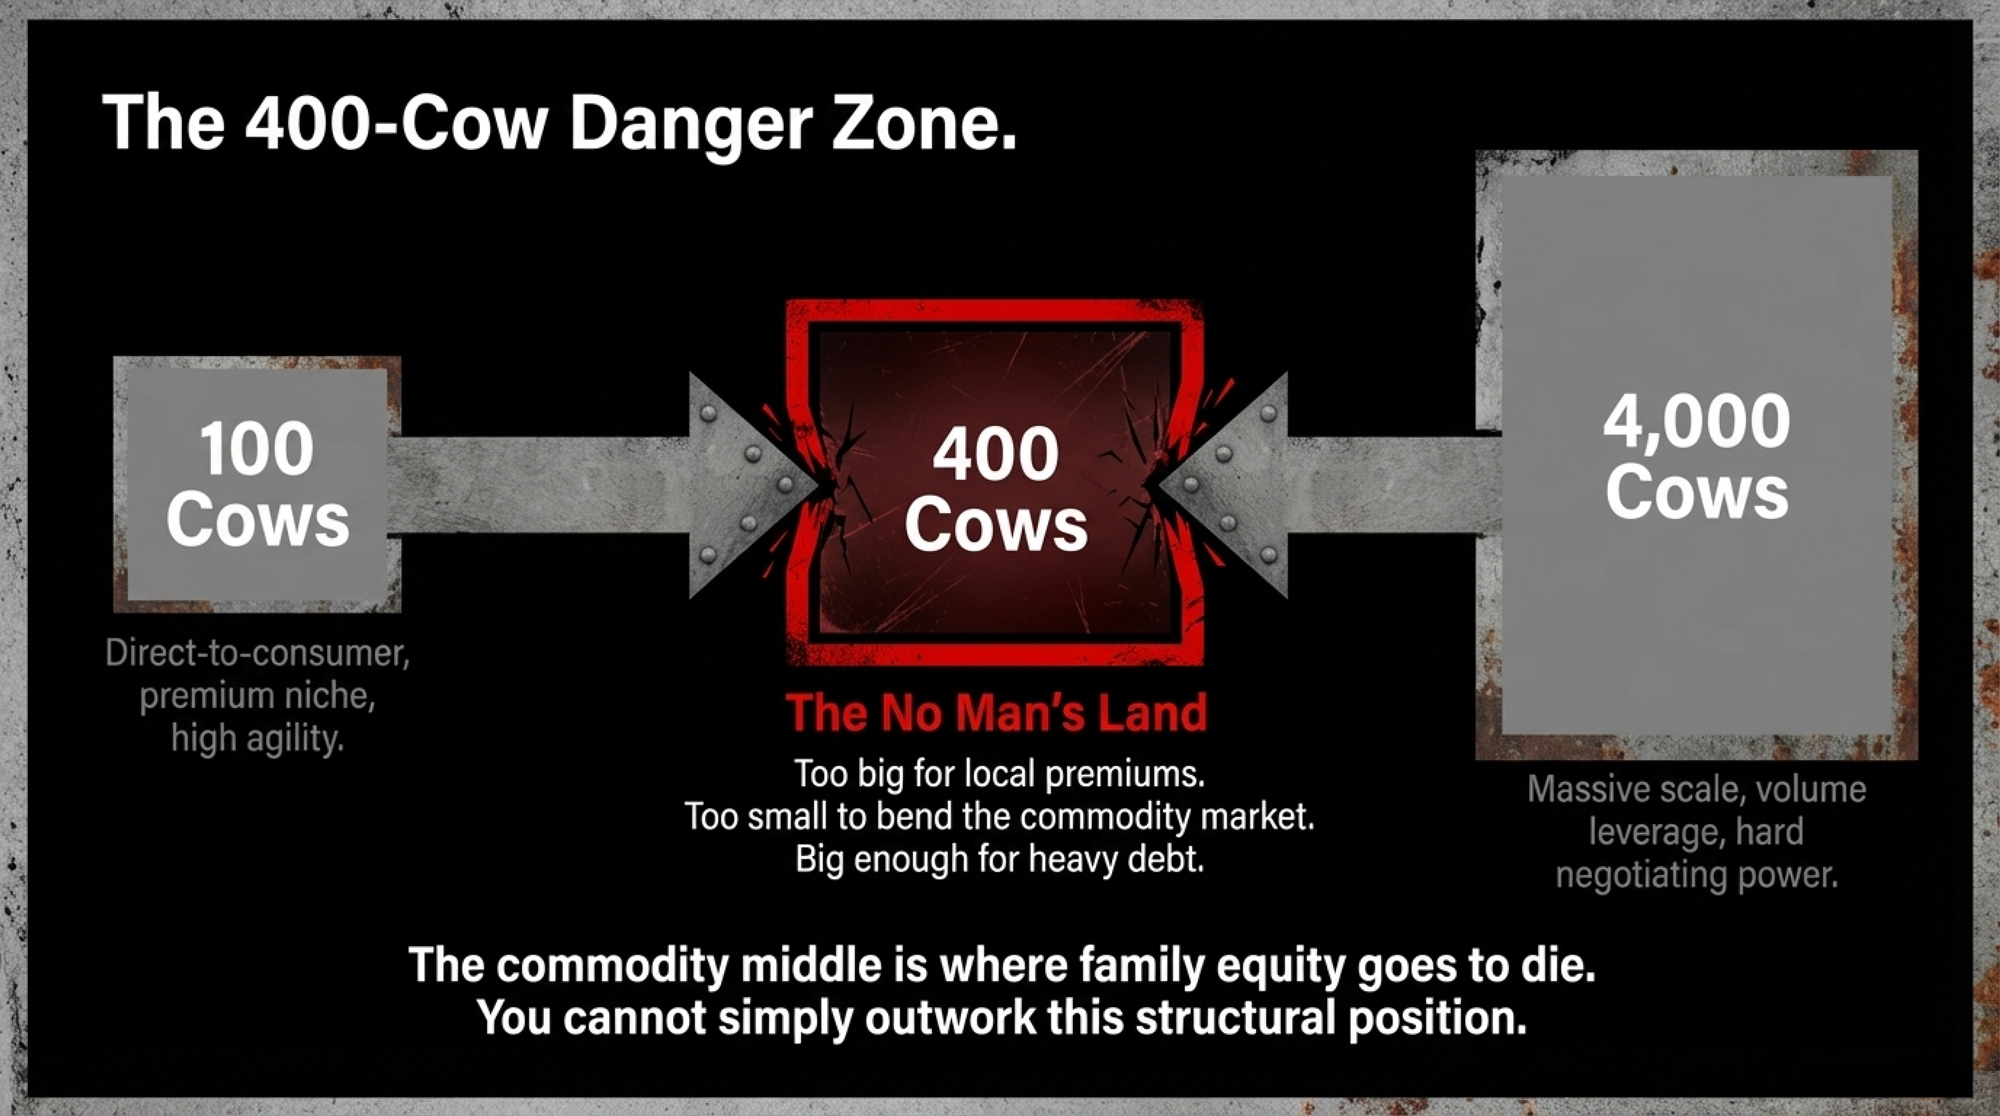
A 400‑cow commodity dairy? That’s the tough middle.
You’re often:
- Too big for most local, direct‑to‑consumer plays to move the needle on total volume.
- Too small to have the volume leverage, economies of scale, or bargaining power of the mega‑dairies.
- Deep enough into capital investment that “just quitting” isn’t a simple decision, but not big enough to dictate terms.
The 400‑cow herd sits in dairy’s no man’s land: big enough to carry real debt and overhead, not big enough to bend the market.
The Playbook: What to Do Before Summer 2026
The system won’t be fixed in the next 12 months. Your job is to make decisions that assume it won’t — while keeping enough equity to benefit if it ever does.
| Herd Size | Full Cost/cwt | 2026 All-Milk | Gap/cwt | Annual Equity Drain | 24-Mo Stress Risk | Action Signal |
|---|---|---|---|---|---|---|
| 300 cows | $24.00 | $19.00 | –$5.00 | $180,000 | HIGH | Exit planning warranted |
| 300 cows | $22.00 | $19.00 | –$3.00 | $108,000 | MODERATE | Stress-test with lender |
| 400 cows | $24.00 | $19.00 | –$5.00 | $240,000 | HIGH | Exit planning warranted |
| 400 cows | $22.00 | $19.00 | –$3.00 | $144,000 | MODERATE | Stress-test with lender |
| 500 cows | $24.00 | $19.00 | –$5.00 | $300,000 | CRITICAL | Restructure conversation now |
| 500 cows | $22.00 | $19.00 | –$3.00 | $180,000 | HIGH | Exit planning warranted |
| 600 cows | $24.00 | $19.00 | –$5.00 | $360,000 | CRITICAL | Restructure conversation now |
| 600 cows | $22.00 | $19.00 | –$3.00 | $216,000 | HIGH | Exit planning warranted |
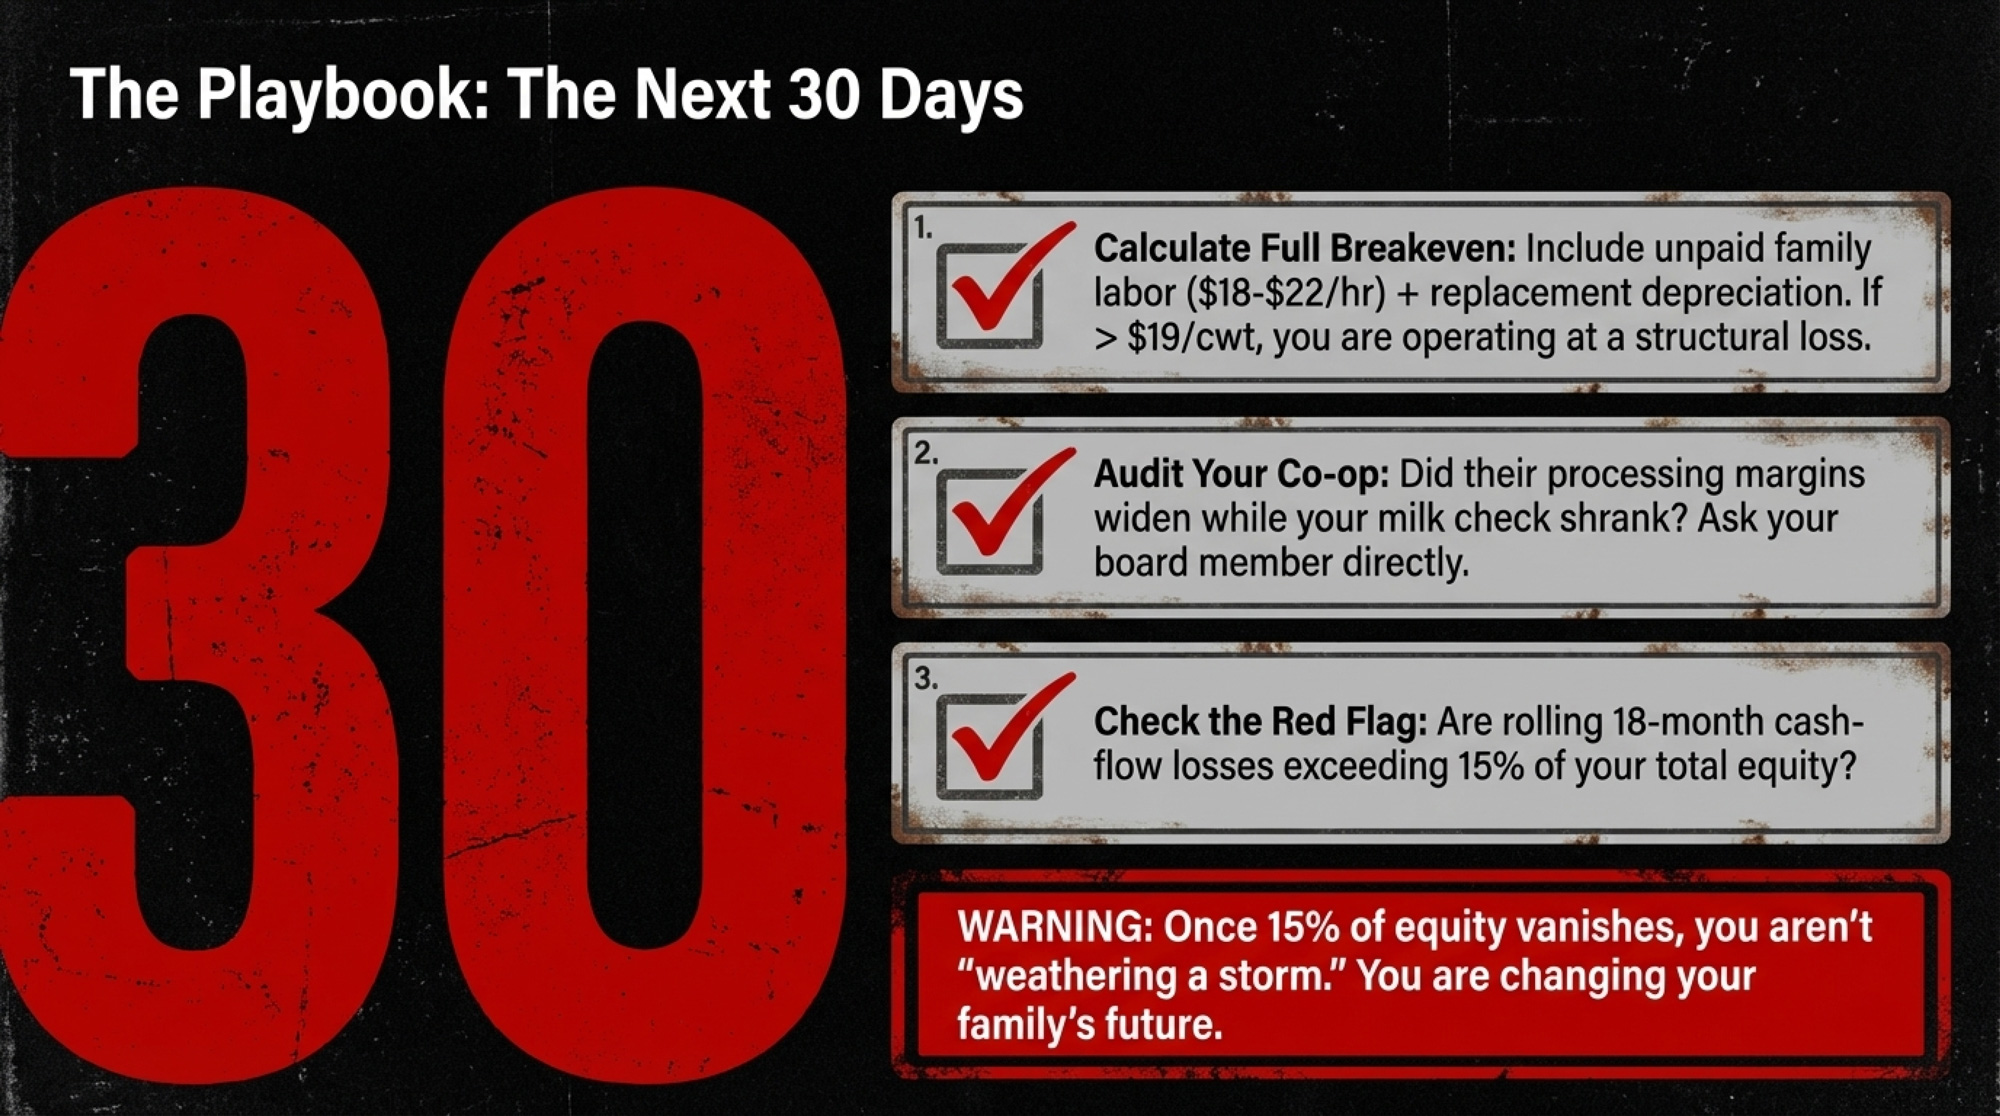
In the Next 30 Days
- Calculate your real breakeven — not cash breakeven, full breakeven. Include unpaid family labor at $18–22/hour, depreciation at replacement cost, and a management return. If your full breakeven sits above the latest USDA all‑milk outlook (~$19/cwt), you’re running at a loss on a full‑cost basis. If your full‑cost breakeven is above $19, your first problem isn’t efficiency — it’s that you’re selling below cost.
- Pull your co‑op’s latest annual report or financials. Look at their processing margins alongside the farm‑gate price they announced. Then ask yourself one question: Did that spread widen when milk prices fell? If it did, you’re looking at the asymmetry this article describes — happening in your own supply chain. Ask your co‑op board member directly: “How did processing margins change between 2022 and 2024 while my milk price moved?”
- Red flag threshold: Your rolling 18‑month cash‑flow projection shows cumulative losses exceeding 15% of equity. Once 15% of your equity is gone to cover losses, you’re not “weathering a storm” — you’re changing the shape of your future.
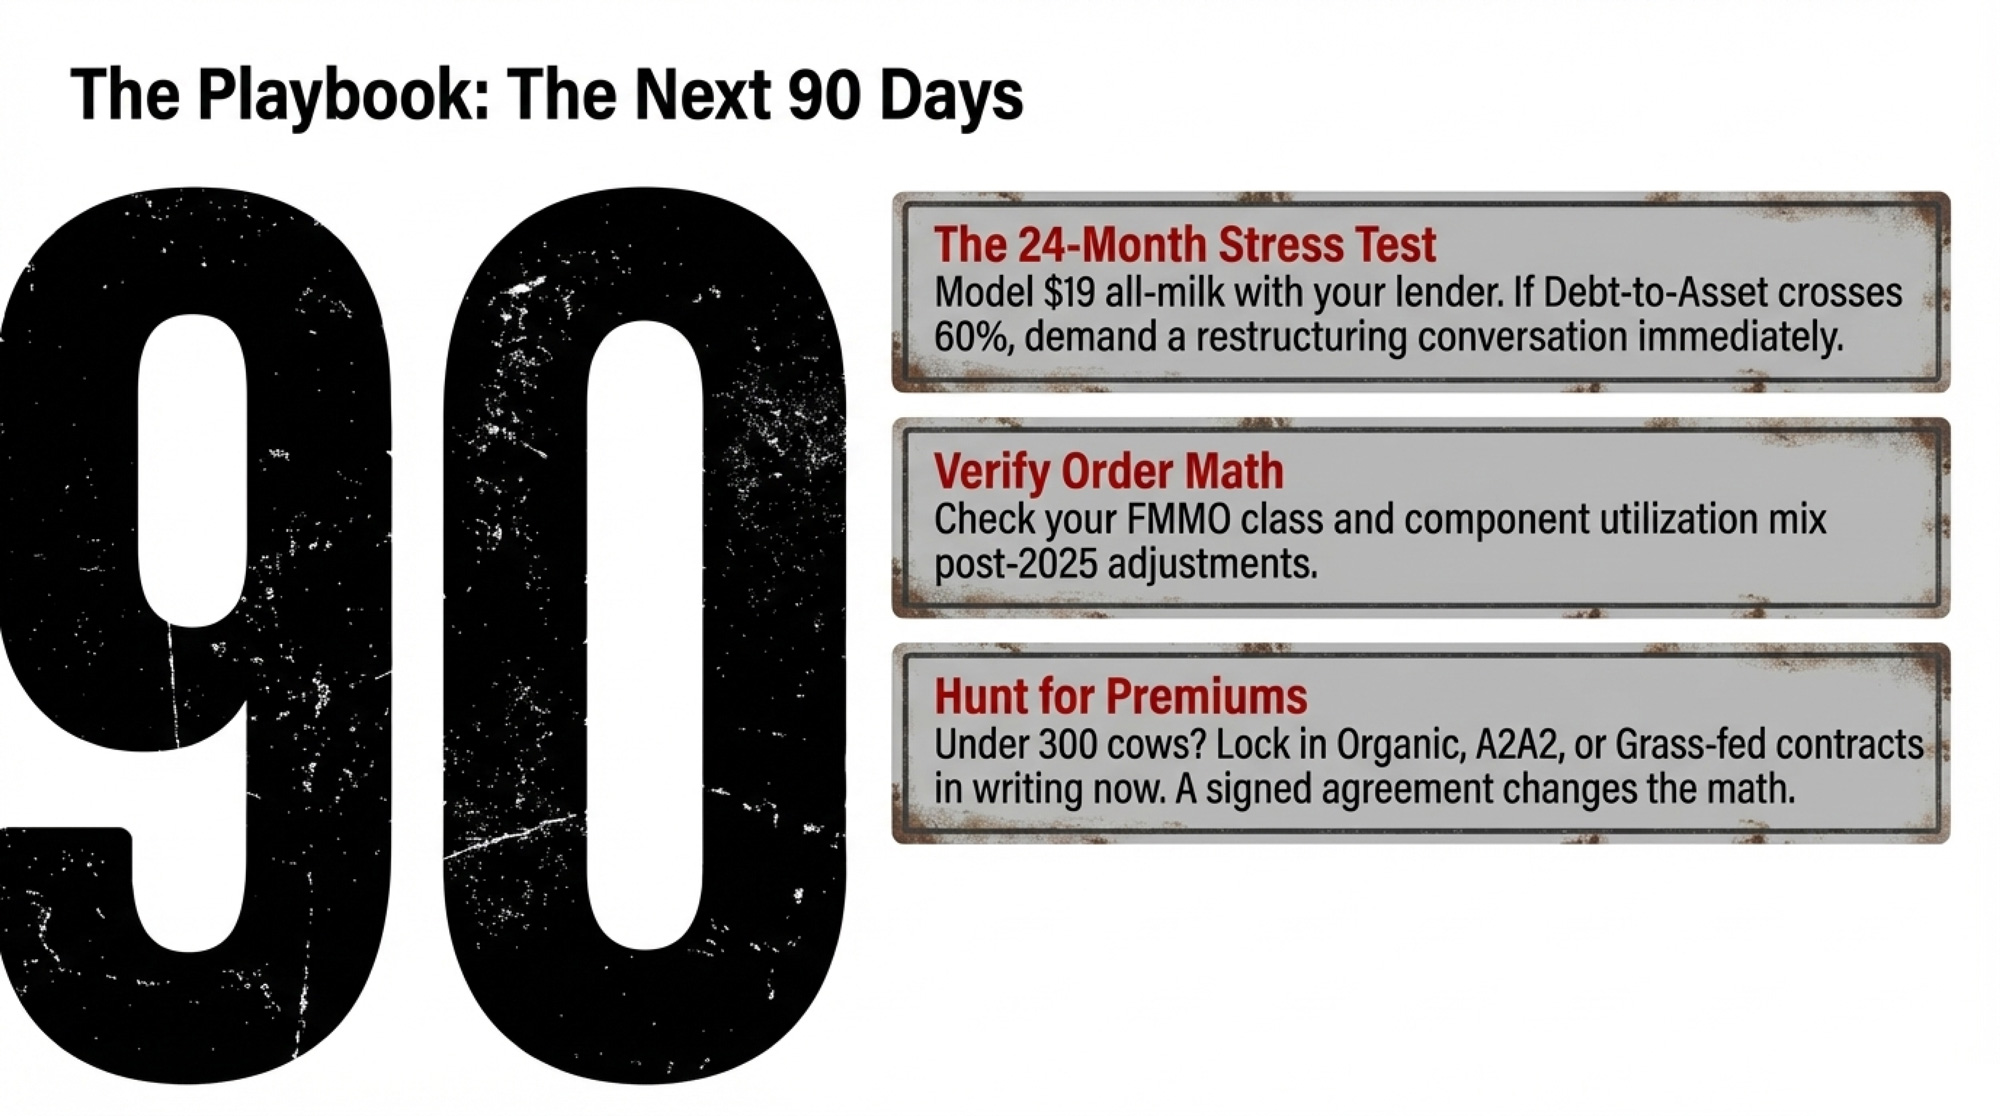
In the Next 90 Days
- Run a $19 milk stress test with your lender. Model your balance sheet at 24 consecutive months of $19 all‑milk with your current cost structure. If your debt‑to‑asset ratio crosses 60% under that scenario, you need a restructuring conversation, not just a prayer for better prices.
- Check your FMMO class and utilization mix. If you haven’t re‑read your order’s pricing rules and your co‑op’s pooling/premium structure since the 2025 adjustments, do it now. Component and class dynamics can move your net check more than you think.
- If you’re under 300 cows with low debt and meaningful pasture, and a processor has expressed interest in organic, grass‑fed, or A2A2 supply at premium terms — get it in writing this quarter. Specialty contracts won’t magically fix your economics, but a signed agreement changes the math on whether a 3‑year transition is worth the pain.
- If you’re 600+ cows with high leverage, your path is different: every dollar of overhead efficiency matters more, the margin for error on feed procurement is thinner, and your lender conversation is about debt‑service coverage, not expansion. Know your number.
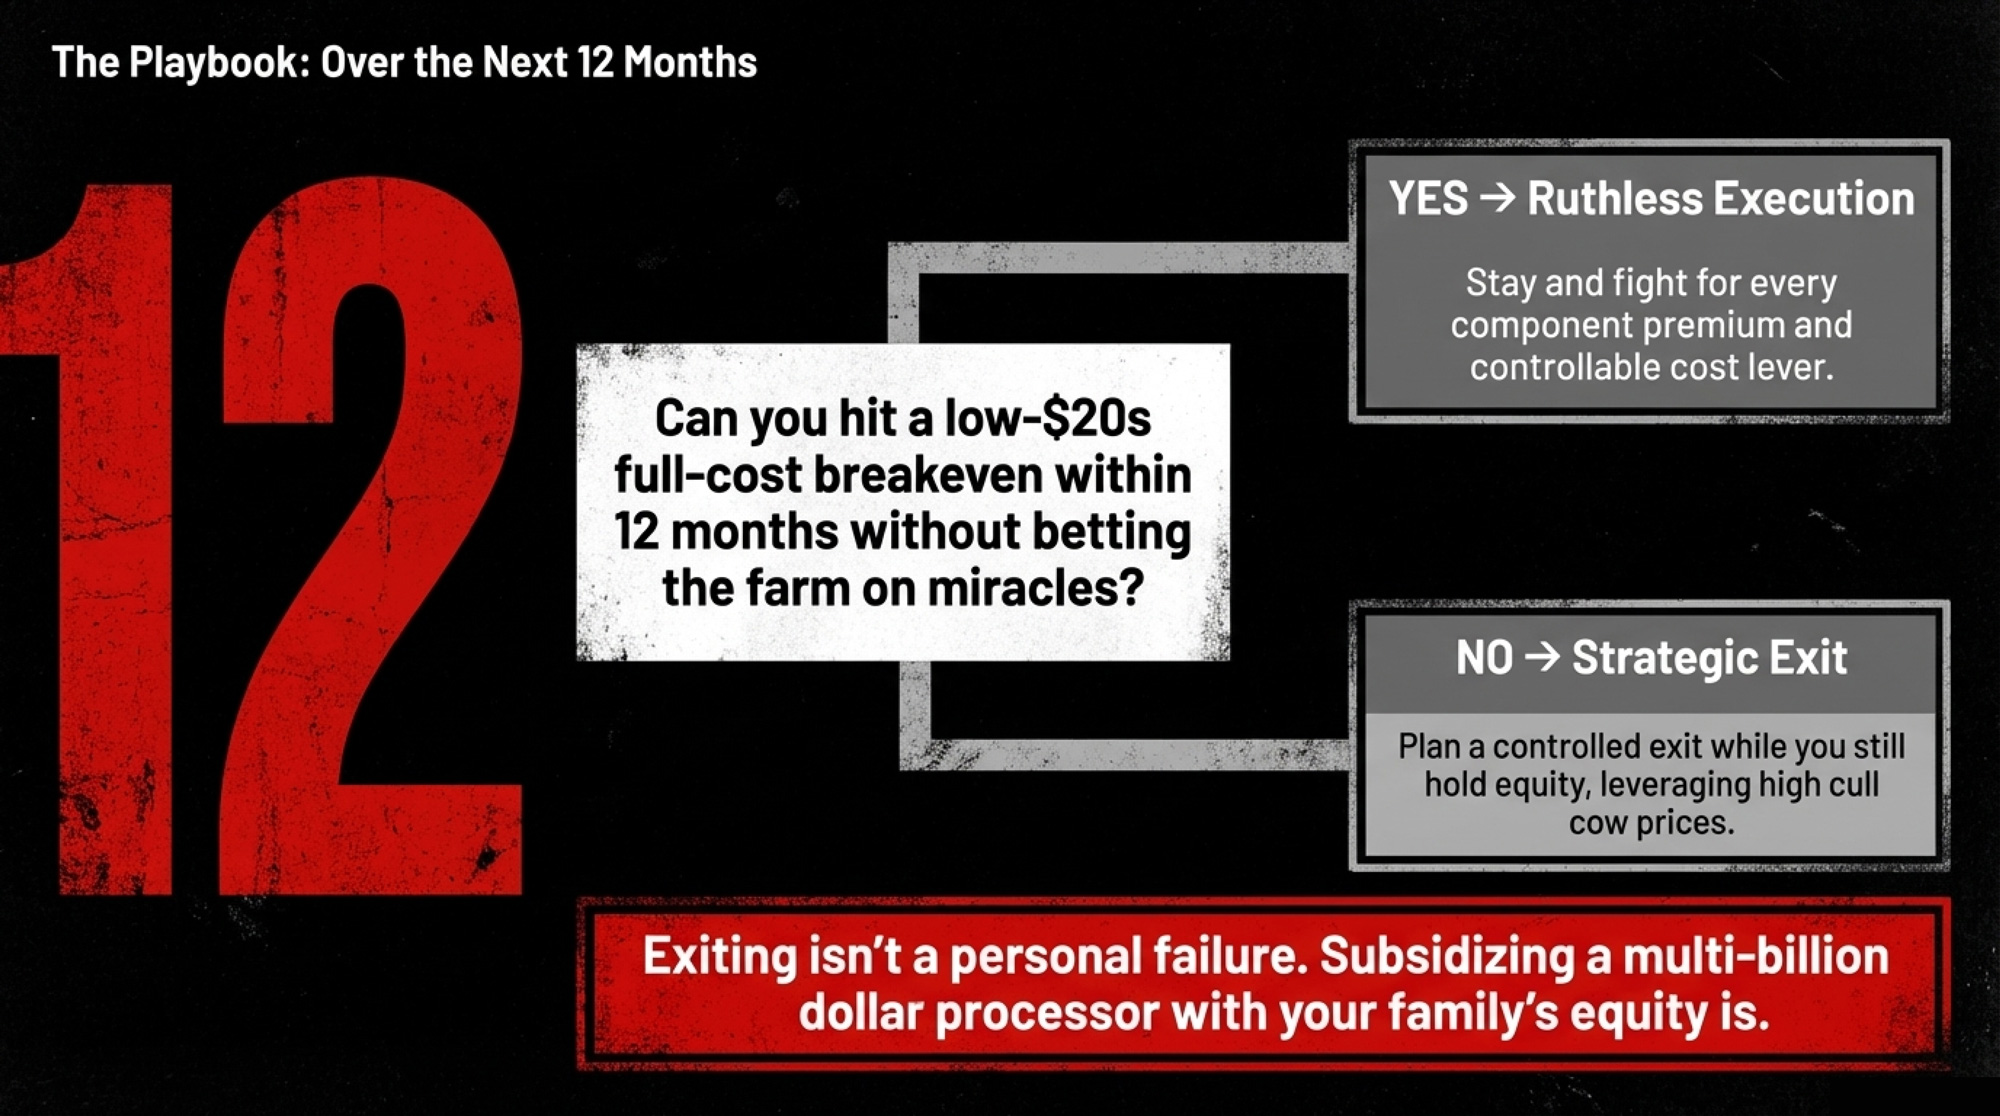
Over the Next 12 Months
- Make the binary decision. Can you realistically get your full‑cost breakeven into the low $20s within a year or two — without betting the operation on debt and miracles? If yes, execute ruthlessly on every controllable cost lever and fight for every cent of component premium. If no, plan a strategic exit while you still have equity, strong cull cow prices, and beef‑on‑dairy premiums to work with.
- Audit your loyalty. Co‑op success — new plants, strong balance sheets, even healthy patronage checks at the organizational level — does not automatically translate into a higher milk check for you. Read your co‑op’s financials like you would a processor’s: how much value stays in the plant, and how much actually flows back to members?
- The critical threshold: If your full cost of production stays above the projected all‑milk price for two consecutive years, the gap is effectively coming out of your family’s equity, while the processing side continues to benefit from relatively cheap raw milk. At that point, you’re no longer just “hanging on” — you’re actively funding someone else’s business plan.
What This Means for Your Operation
- You’re not imagining the squeeze. Decades of farm‑share data, price‑transmission research, and bargaining‑power studies confirm that the dairy supply chain is structured so that most of the risk and price adjustment lands on your side.
- Your efficiency gains work both ways. When you push more milk through the parlor, you help keep processors’ unit costs low and plant capacity full. Unless your contract structure captures some of that value, the benefit flows downstream.
- Your co‑op is a partner and counterparty at the same time. A co‑op that runs plants and export programs has a real structural tension between paying you more and protecting its processing margin. That doesn’t make them villains — it means you should read their balance sheet with the same skepticism you’d apply to a private processor.
- Canadian‑style supply management isn’t on the table this decade. But it proves that tying farm‑gate prices to the cost of production is a policy choice, not an economic impossibility.
- Waiting for prices to recover is a bet, and recent USDA outlooks suggest it’s a risky one. Treat the $18.95/cwt forecast as a base case, not a worst case. If your full‑cost breakeven doesn’t work at that level, your job this year is to close that gap or decide when and how you’ll exit.
- The most important number isn’t on the CME screen. It’s the ratio between what you’re paid per cwt and what a gallon of your milk sells for at retail in your nearest town.
Key Takeaways
- If your full‑cost breakeven sits more than $3/cwt above the latest USDA all‑milk outlook and you don’t have a clear, executable plan to close that gap, strategic exit planning should be on the table — not taboo.
- If your co‑op’s processing margins grew while your farm‑gate price lagged, that’s the bargaining‑power asymmetry at work — not bad management on your part. Stop treating a structural problem as a personal failure.
- If you haven’t run a $19 milk stress test with your lender for a full 24‑month horizon, do it in the next 90 days. The outcome of that meeting should drive whether you’re doubling down, pivoting to a premium path, or quietly lining up your best exit window.
The Bullvine Bottom Line
If you’re effectively subsidizing a processor’s growth with your own family’s equity, you’re not “weathering a storm” — you’re funding someone else’s expansion. It’s time to decide, with your own numbers in front of you, whether you’re truly a partner in that system — or just a donor.
What does your latest milk cheque say about which one you are?
Complete references and supporting documentation are available upon request by contacting the editorial team at editor@thebullvine.com.
Learn More
- GT Thompson’s 2026 Farm Bill Math: DMC Pays Your 200‑Cow Dairy $1800, Make Allowances Cut $42240 – a 23 to 1 Hit – Exposes the staggering 23-to-1 gap between new government payments and automatic formula deductions. This breakdown arms you with the “Make Allowance” math to see exactly how much your check is subsidizing processor cost recovery this year.
- Record Corn Won’t Save You: The $100K Margin Hit Coming for Mid-Size Dairies in 2026 – Reveals why cheaper feed is a mathematical mirage that can’t outrun a $1.80 drop in all-milk prices. This strategic analysis delivers a 2026 checklist to benchmark your operation against the “High Risk” middle-market cost curve.
- The $900/Cow Hit You Can’t Outbreed by April: Western Canada’s 70/25/5 Reckoning – Breaks down how a sudden shift in component payment ratios can vaporize $100,000 in annual revenue. This report delivers a disruptive nutrition and genomic blueprint to pivot your herd’s protein profile before the new pricing rules take hold.
 The Sunday Read Dairy Professionals Don’t Skip.
 The Sunday Read Dairy Professionals Don’t Skip.
Every week, thousands of producers, breeders, and industry insiders open Bullvine Weekly for genetics insights, market shifts, and profit strategies they won’t find anywhere else. One email. Five minutes. Smarter decisions all week.
