


5% of dairies don’t need government money. 70% can’t survive without it. Which are you?
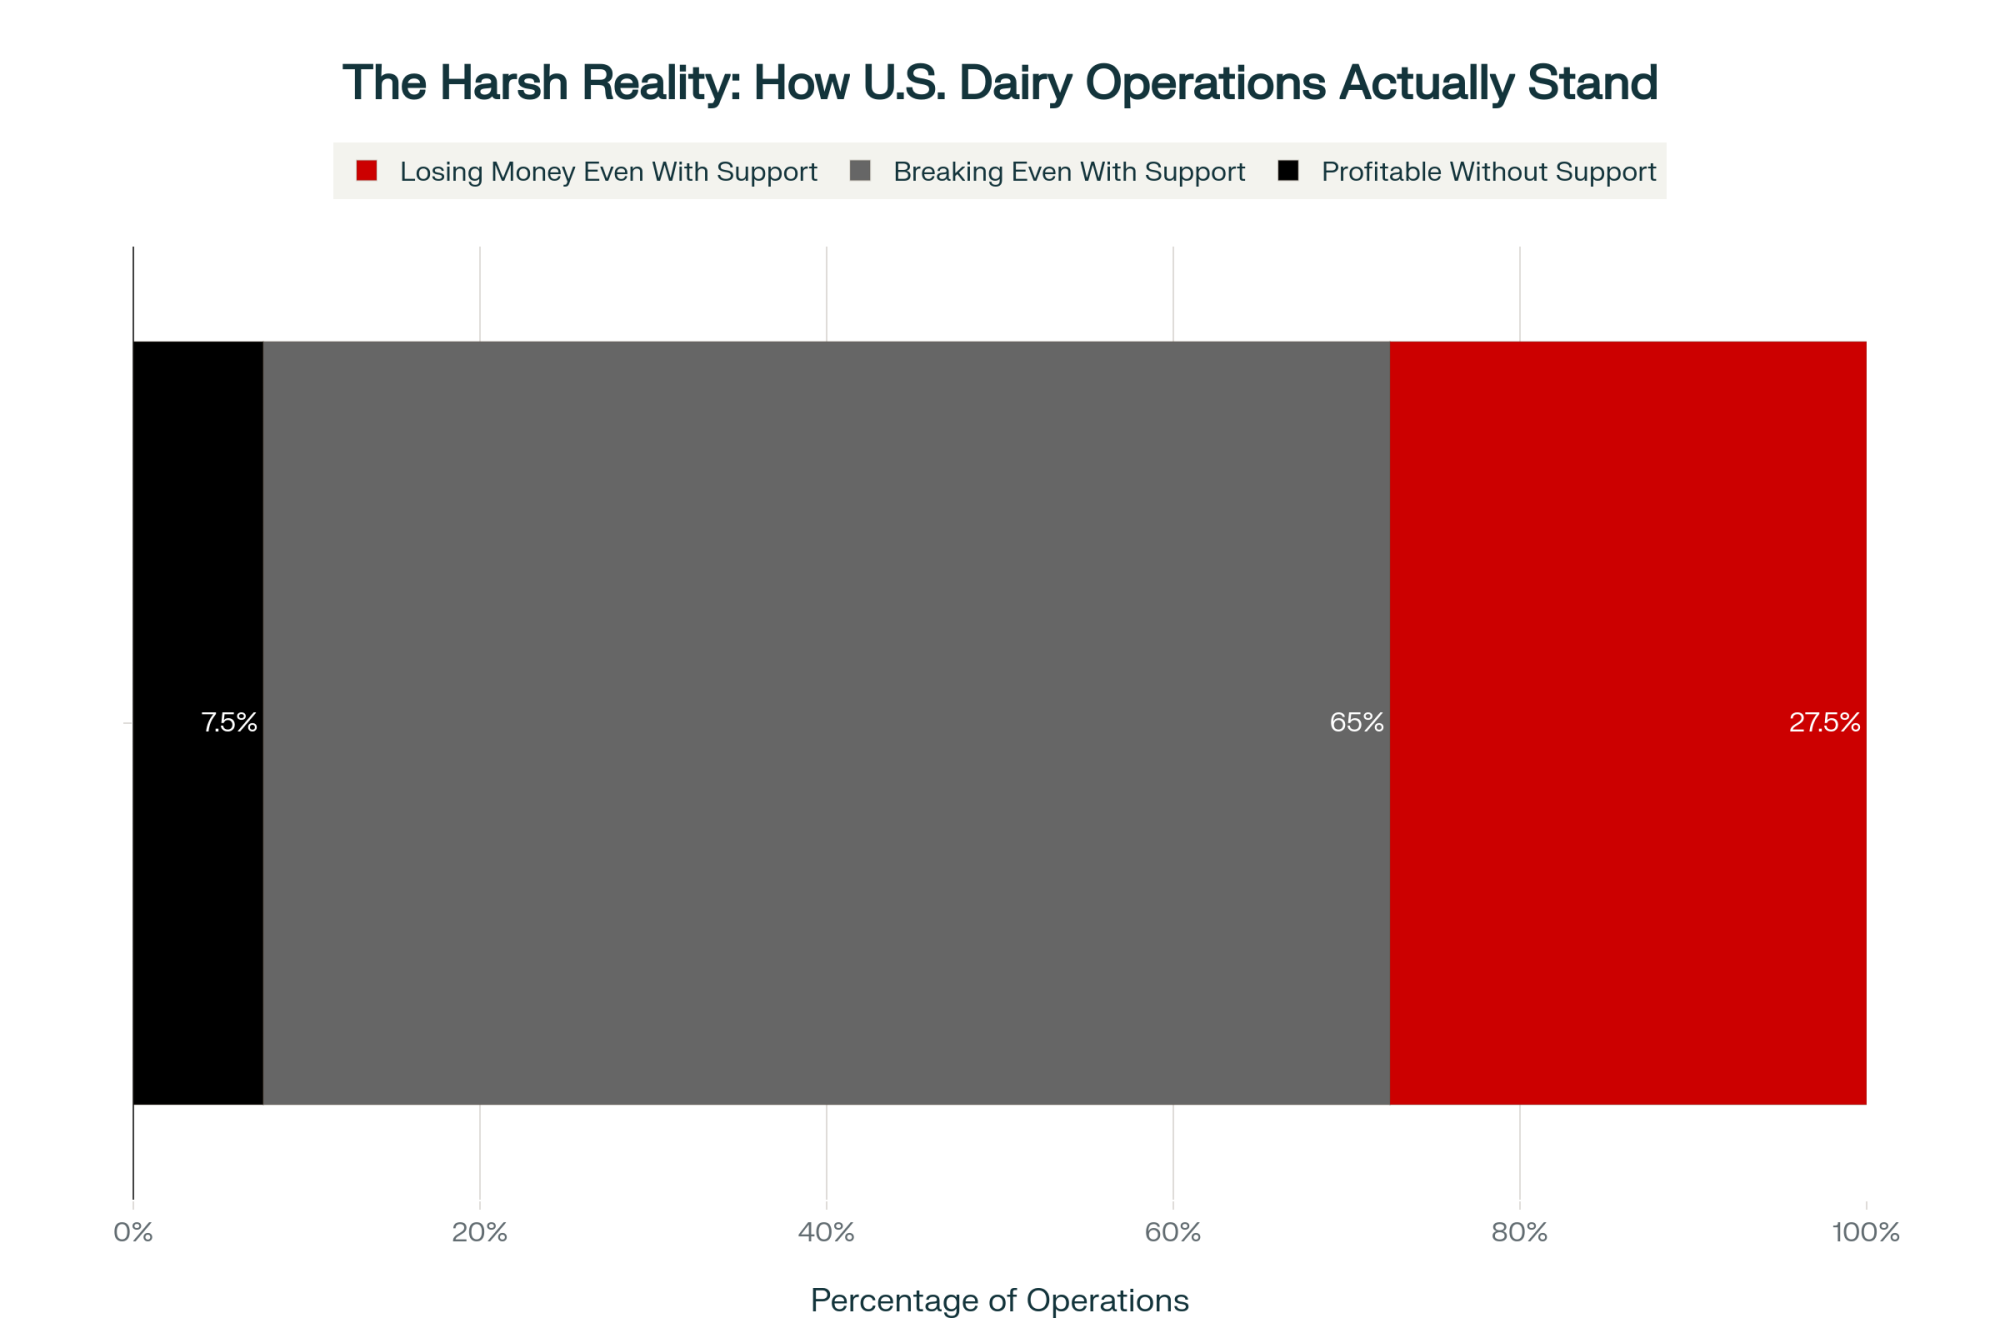
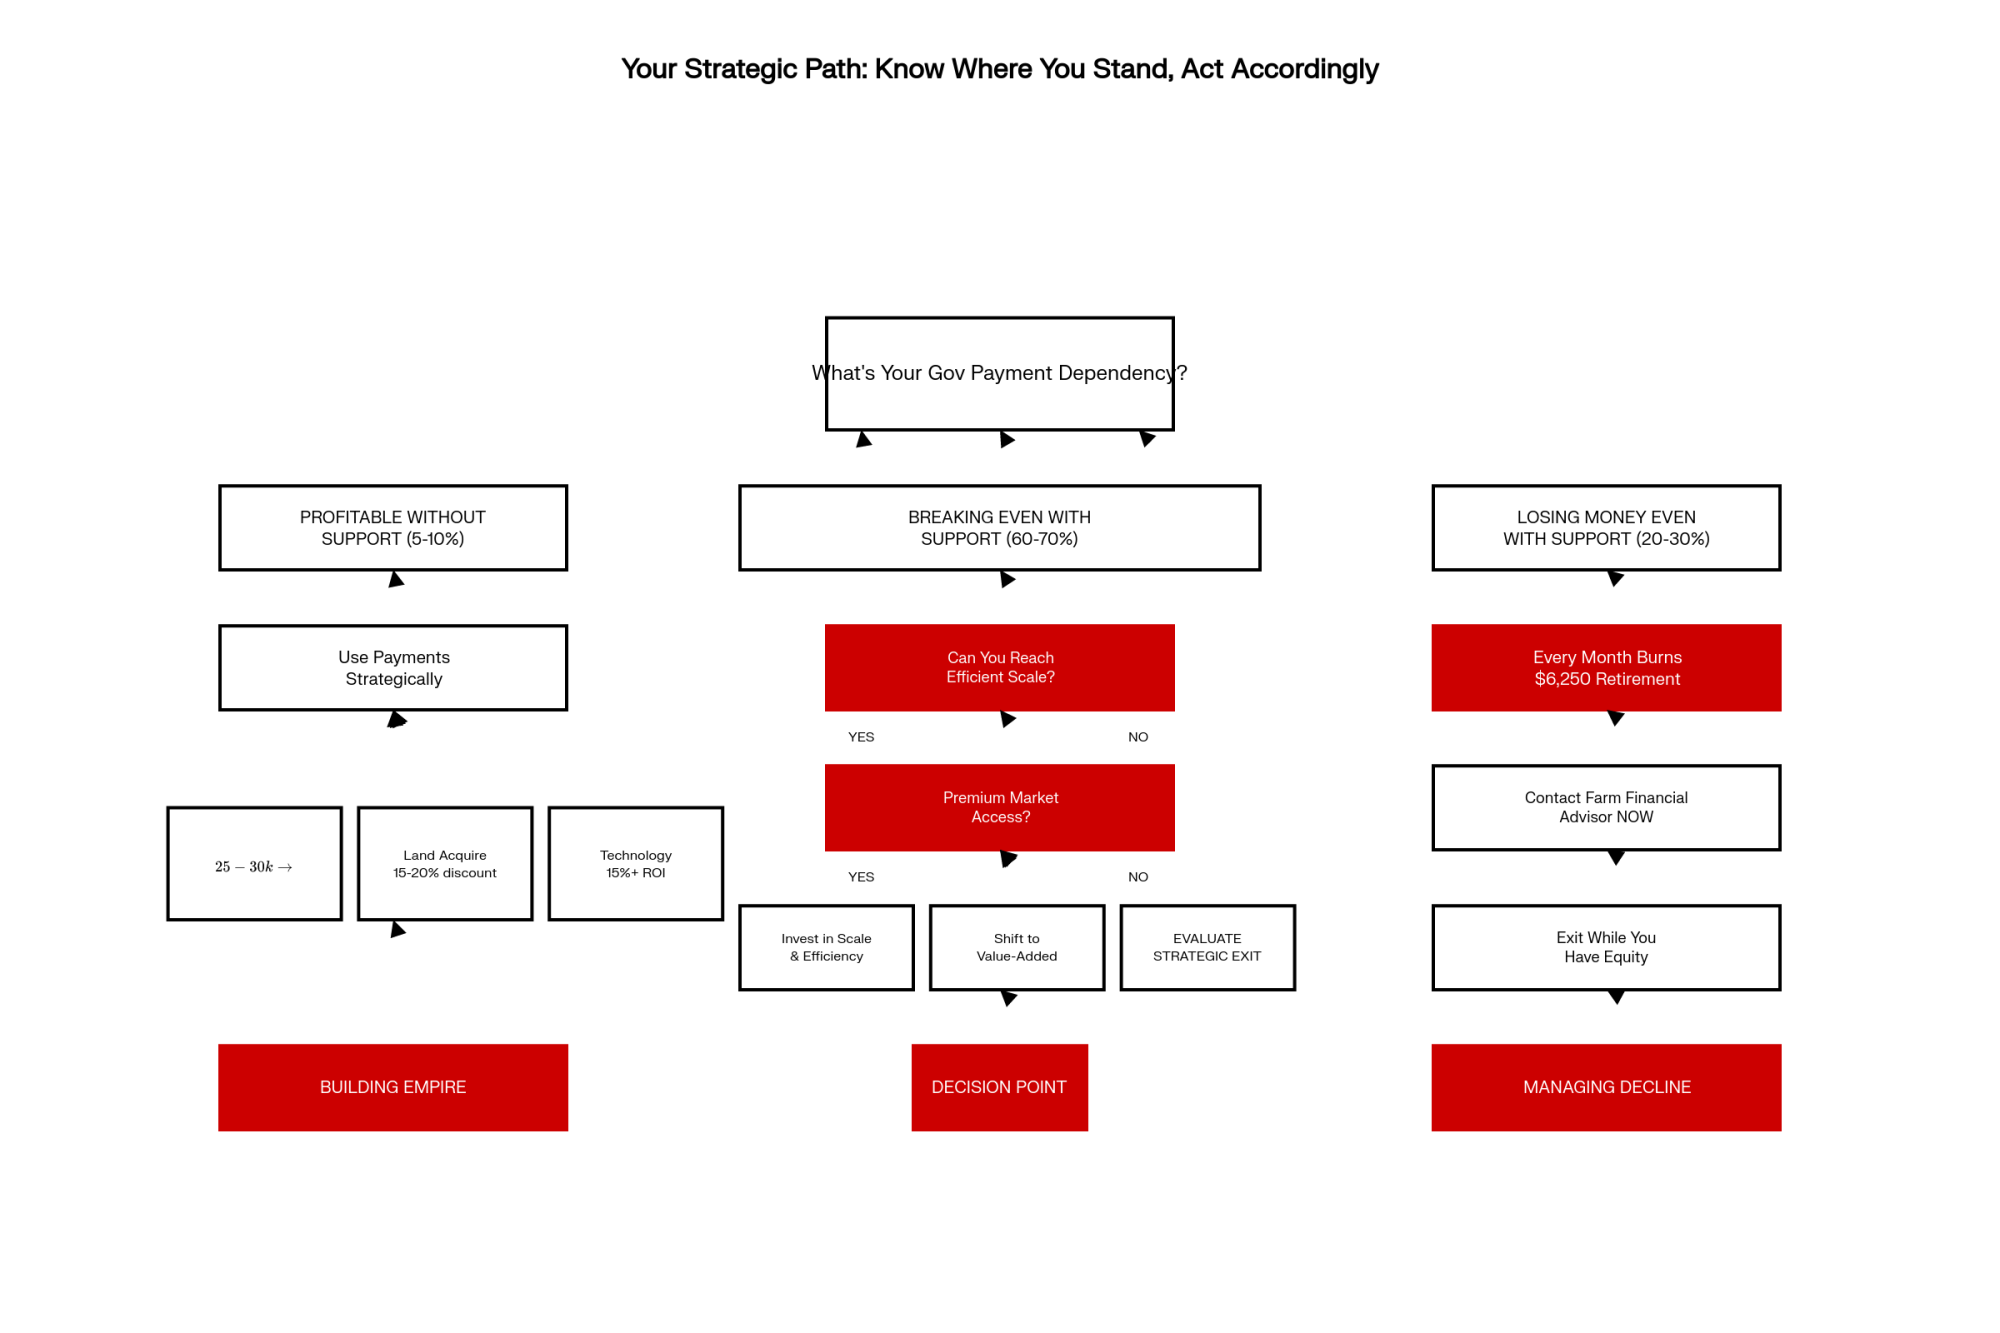
Executive Summary: Is that government check keeping you afloat? It’s costing you $6,250 a month in retirement income you’ll never get back. With payments now 22.4% of dairy income nationwide, our analysis of operations across the country reveals only 5-10% are genuinely profitable without support—while 60-70% just break even, and 20-30% lose money even with help. The math is simple but brutal: every month of losses converts retirement equity into operating expenses. Meanwhile, processors are betting $11 billion on milk supply that depends entirely on political decisions outside your control. The seven-step calculation in this article takes ten minutes and will show you exactly where you stand—and whether you’re building a business or managing a decline.
With FSA offices reopening and $3 billion in agricultural assistance flowing, what experienced dairy farmers are discovering about dependency ratios and strategic positioning
This morning brought a familiar sight to small towns across dairy country. Pickup trucks lined up at Farm Service Agency offices, farmers catching up on payments delayed by the recent three-week government shutdown.
Watching this scene unfold at our local FSA office, I couldn’t help but wonder… how many of these operations actually know what percentage of their income depends on these government programs?
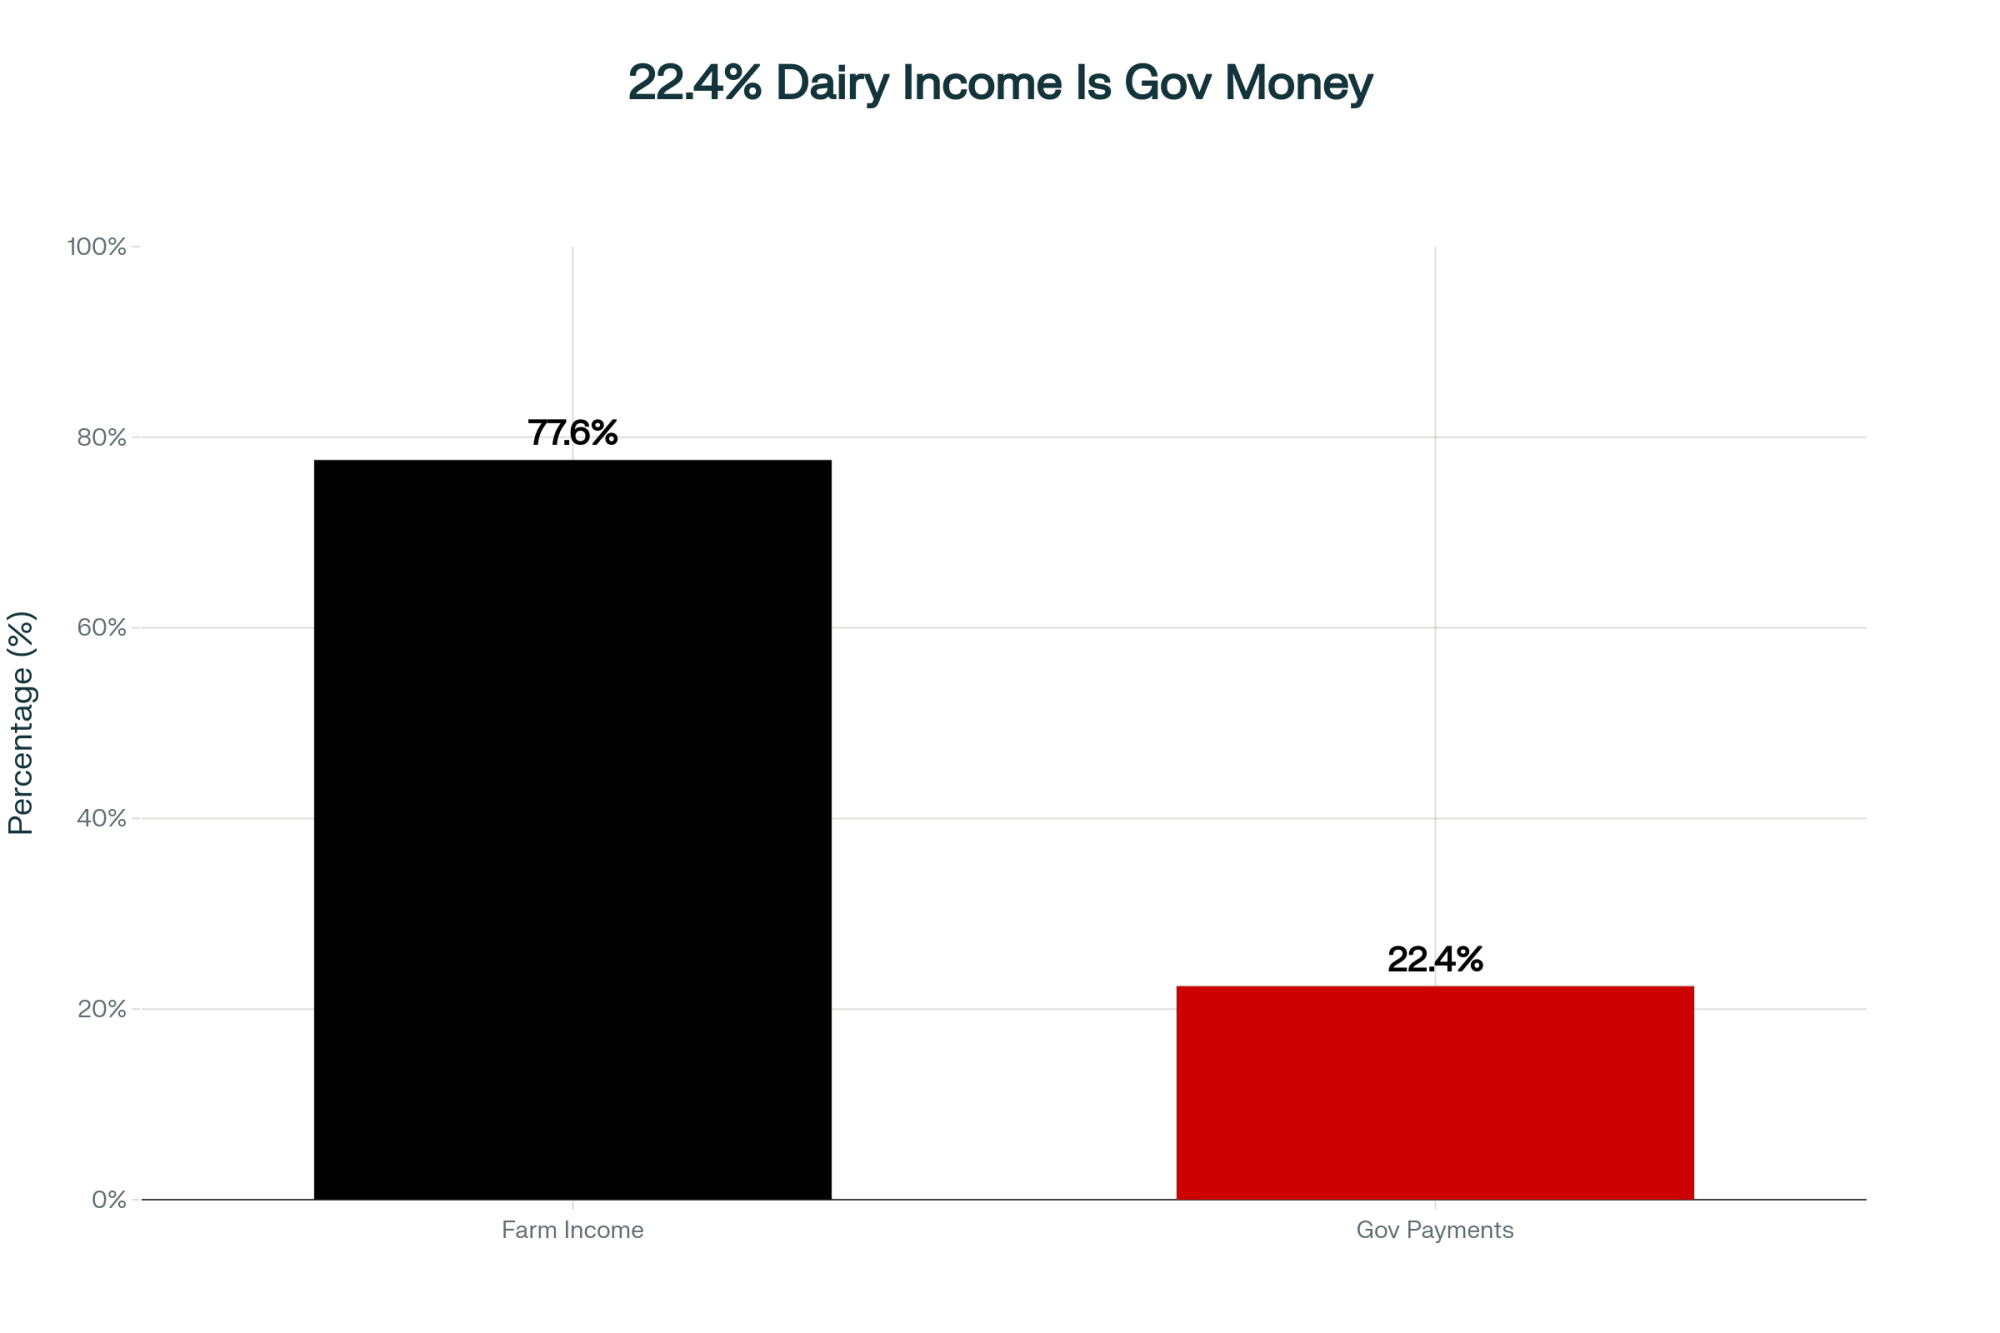
After talking with producers from Wisconsin’s rolling hills to the expansive operations in Texas this past week, something interesting is emerging. You know, USDA’s September 2025 Farm Income Forecast shows government payments are projected to make up 22.4% of net farm cash income this year. That’s not just a number—it’s telling us something important about where we are as an industry.
Understanding Where Different Operations Stand
Had a fascinating conversation at our regional dairy conference last week. Several financial advisors were sharing what they’re seeing across different operations, and honestly, the picture’s more nuanced than you might expect.
Operations Achieving Market Independence
So here’s what’s interesting—when you look at Cornell’s Dairy Farm Business Summary along with data from other land-grant universities, the analysis suggests maybe 5-10% of dairy operations have reached that point where they’re consistently profitable without government support. We’re talking about dairies milking over 1,000 cows with production costs below $18 per hundredweight, or those who’ve successfully tapped into premium markets.
I was talking with a Wisconsin producer last week—runs about 1,800 Holsteins—and his perspective really stuck with me. “For us,” he said, “the government payments are opportunity capital, not survival money. We’re putting everything into genomic testing because even tiny improvements in protein percentage mean six figures at our volume.”
And that’s the thing, isn’t it? These larger operations aren’t using support payments just to keep the lights on. They’re using them to pull further ahead.
The Challenging Middle Ground
Now, based on Farm Credit data from various regions, it appears roughly 60-70% of dairy operations face what consultants are calling a structural challenge. These farms—typically between 200 and 800 cows—are facing production costs in that $20-24 per hundredweight range, according to benchmarking from places like Farm Credit East.
You probably know operations like this. Built their facilities back when the economics looked completely different.
As Mark Stephenson from UW-Madison’s Center for Dairy Profitability points out, they’re often too big for premium niches but too small for real commodity-scale efficiencies.
Think about it this way—imagine a 450-cow operation in Pennsylvania (and there are plenty like this). Without government payments, they might face monthly losses of $6,000. With payments? They break even. But breaking even doesn’t build equity, and it sure doesn’t set up the next generation.
Operations Under Severe Stress
This is the tough part to talk about. Kansas State’s ag economics department analysis, along with other farm management programs, suggests that maybe 20-30% of dairy farms are losing money even with government support.
These operations typically show debt-to-asset ratios over 60%, maxed credit lines… you know the signs.
Financial advisors working with dairy—and they understandably don’t want their names attached to this—tell me about clients who probably should have transitioned out a couple of years back. But the government payments keep them going month to month. It’s less farming at that point and more… well, managing decline.
The Development of Dependency: How We Got Here
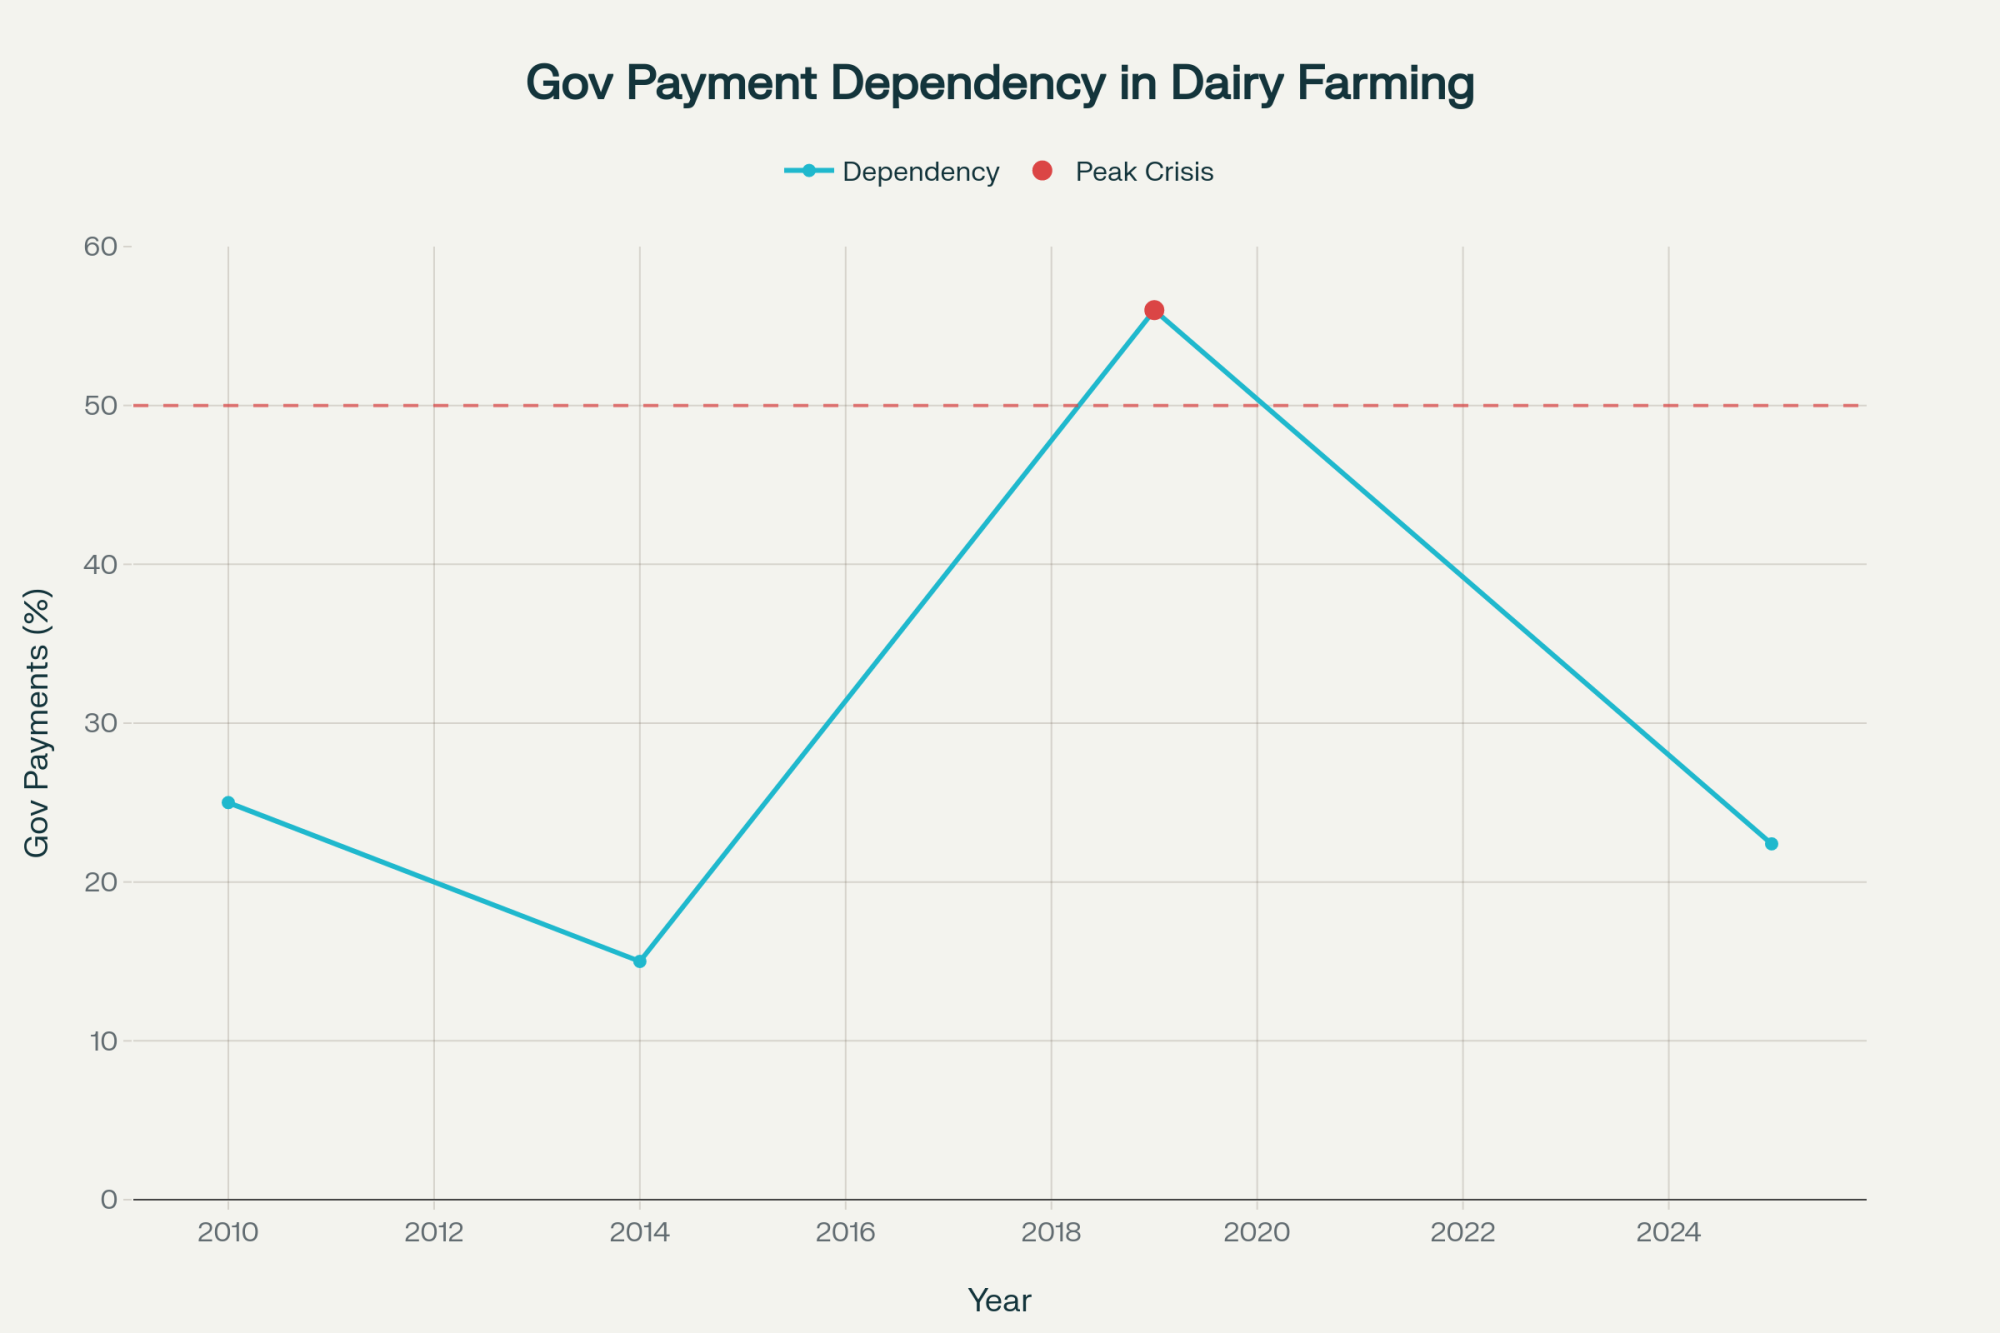
The University of Kentucky’s farm management program has been tracking the same group of farms since 2010, providing us with a unique window into how things have developed. Their data shows something remarkable—when government payments dropped in 2014 after the Farm Bill got delayed, net farm income didn’t just dip. It crashed 65% in one year.
By 2019, during all that trade disruption with China, those Kentucky farms were averaging $187,311 in government payments. Here’s what really gets me—that was 56% of their total net farm income. More than half their profitability came from Washington, not from selling milk.
And USDA’s latest Economic Research Service projections? They’re showing median farm income—not average, but median—at negative $1,189 for 2025. That means half of all farms would lose money just from farming. The $89,881 average off-farm income is what’s keeping many families afloat.
Strategic Approaches to Government Support
What I find really telling is how different operations use these payments. The patterns… they say a lot about who’s likely to be here in ten years.
Land Acquisition Strategies
Several larger producers I know in Idaho and Wisconsin keep careful tabs on neighboring operations. Not to be predatory, but to be ready.
As one explained at a recent field day, “We know who’s retiring, who’s struggling. When opportunities come up, we need to be positioned.”
Iowa State’s Beginning Farmer Center research shows that farmland in distressed sales typically sells for 15-20% less than in planned transitions. The financially strong operations? They know this. They keep cash ready.
Component Quality as Profit Center
Here’s something that’s changed—with cooperatives paying anywhere from 50 cents to over a dollar per hundredweight in component premiums —genetics isn’t just about better cows anymore. It’s a profit center.
Holstein Association USA’s 2025 Genetic Progress Report shows some impressive returns. Say you’ve got 900 cows and you bump protein by 0.08% through genomic selection. Doesn’t sound like much, right? But that could be $100,000 more annually. Pretty solid return on a $25,000-30,000 testing investment.
Technology Investment Discipline
The University of Minnesota’s dairy program research shows that successful operations won’t touch technology unless the projected ROI is at least 15%. That’s become kind of a benchmark.
Take robotic feed pushers—about $30,000. They eliminate a part-time position, improve feed efficiency. Wisconsin producers I know are seeing 60% first-year returns when you combine labor savings with better feed conversion.
Compare that to operations using government payments for emergency repairs on old equipment. Two different philosophies entirely.
The Financial Planning Reality Check
This is where that $6,250 monthly figure from our headline comes into focus. Cornell economists Loren Tauer and Christopher Wolf have done extensive work on farm exit timing, and their framework reveals exactly how each month of losses converts retirement security into operating capital.

Let me walk you through what this might look like for a typical 400-cow operation. Say you’ve got $1.5 million in equity right now. If you’re losing $75,000 annually without government payments, in five years you’re down to $1.125 million.
At a conservative 4% return, that’s $15,000 less annual retirement income. Forever.
As Dr. Tauer explained at a recent conference, “Every month of operating losses essentially converts $6,250 of retirement savings into operating capital.”
What concerns many of us in extension is how few producers have actually run these numbers. We don’t have comprehensive survey data, but informal polls at producer meetings suggest it’s pretty rare.
Your Quick Equity Assessment
Here’s the calculation to run tonight:
- Total assets (land, cattle, equipment): $_____
- Subtract all debts: $_____
- Current equity = #1 – #2: $_____
- Annual result without government payments: $_____
- Monthly impact = #4 ÷ 12: $_____
- Five-year projection = #4 × 5: $_____
- Retirement income impact (at 4%) = #6 × 0.04: $_____
Takes ten minutes. Could change your whole strategy.
“These payments don’t solve challenges—they reveal them. The question is how we use that information.” — Gary Sipiorski, Dairy Financial Consultant
International Comparisons: Why They’re Tricky
| Factors | New Zealand (1984) | United States (2025) | Advantage |
| Infrastructure Cost per Cow | $500-1,000 | $4,000-7,000 | NZ by 7X |
| Avg Debt-to-Asset Ratio | 20-30% | 43% (avg), 60%+ (struggling) | NZ by 2X |
| System Type | Pasture-based | Confinement | NZ – flexible |
| Average Herd Size | 125 cows | 337 cows (70% from 5% of farms) | US – more scale |
| Farm Count (1984/2025) | ~16,000 | ~31,000 | US has more |
| Impact of Subsidy Removal | ~800 farms lost (1%) | Unknown – catastrophic risk | NZ – survived |
| Capital Intensity | Low | Extreme | NZ – adaptable |
Everyone brings up New Zealand’s 1984 subsidy elimination, but… the comparison’s challenging when you look closer.
New Zealand had about 16,000 dairy farms averaging 125 cows on pasture. Infrastructure investment was minimal—maybe $500-1,000 per cow. Debt-to-asset ratios typically ran 20-30%.
When subsidies ended overnight, about 800 farms faced forced sales. That’s roughly 1% of all their agricultural operations.
Now look at us:
- USDA Census data shows: 70% of our milk comes from just 5% of farms
- Infrastructure requirements: Modern confinement facilities need $4,000-7,000 per cow
- Debt levels: Farm Credit analysis shows average debt-to-asset ratios around 43%, with struggling operations often over 60%
As Mark Stephenson from UW-Madison thoughtfully puts it, “Comparing New Zealand’s pasture system to our capital-intensive model is like comparing a bicycle to a freight train—both move, but the physics are completely different.”
Processing Capacity and Infrastructure Challenges
Here’s what adds complexity—the International Dairy Foods Association reports over $11 billion in new processing capacity under construction.
Major investments include:
- Fairlife’s $650 million New York facility
- Chobani’s $1.2 billion expansion
- Multiple Texas projects from Leprino, Great Lakes Cheese, and others
All these investments assume milk supply stays stable. But if support programs changed dramatically and even 10,000 farms exited quickly? Several economists think that’s actually conservative. You’d have massive overcapacity issues.
Remember Dean Foods in 2019? Fifty-four plants, thousands of affected farms. The whole system shuddered until Dairy Farmers of America stepped in. That showed us how vulnerable the supply chain can be.
Regional Cost Variations That Matter
Geography really matters in this business. Farm Credit data from different regions shows distinct patterns worth understanding.
Northeast and Upper Midwest:
- Production costs: $22-24 per hundredweight (Farm Credit East benchmarking)
- Challenge: Developed when transportation limits created natural market protection
- Reality: That advantage is long gone
Southwest (Texas and New Mexico):
- Production costs: $19-21 per hundredweight (regional studies)
- Challenge: Water access and environmental compliance eat up cost advantages
- Critical issue: Ogallala Aquifer depletion forcing hard conversations
West Coast (California and Idaho):
- Production costs: $16-18 per hundredweight for efficient operations (UC Davis cost studies)
- Advantage: Geography plus scale creates a competitive position
- Result: Clearest path to subsidy independence
Special Considerations for Different Farm Types
Smaller Operations (Under 200 cows)
Operations under 200 cows face particular challenges. Vermont extension data talks about a “triple squeeze”:
- Not enough scale for commodity competition
- Limited premium market access
- Old infrastructure is uneconomical to modernize
Some smaller farms make it work through creative differentiation—farmstead cheese, agritourism, direct sales. But as economists point out, these require different skills and serve limited markets.
Value-Added Operations
Farms with existing value-added enterprises have more flexibility. These operations might use government payments to expand processing capacity or improve visitor facilities rather than covering operating losses.
It’s a different strategic position entirely.
Beginning Farmers
Young farmers entering now face unique challenges:
- Land prices assume subsidies continue
- Competition from operations with decades of equity
- Making 30-year decisions without 5-year policy certainty
One recent dairy science graduate told me, “I run three scenarios—continued support, reduced support, no support. The spread between outcomes is huge.” That uncertainty makes traditional planning incredibly difficult.
Emerging Opportunities Worth Watching
Despite everything, there are some interesting developments.
The Innovation Center for U.S. Dairy’s 2025 report shows that carbon credits can generate $15-50 per cow annually for early adopters. Not game-changing yet, but it’s market-based income that doesn’t depend on politics.
Your processor relationship matters more than ever, too. Research on cooperative marketing shows that members typically get slightly lower prices, with much less volatility—often 40% less. When stability comes from government payments, that trade-off’s worth considering.
Practical Next Steps for Different Situations
If you’re already profitable without support: Use these payments strategically. Accelerate genetic programs with proven returns. Position for land acquisition at the right prices. Build processor relationships. But keep that 15% ROI discipline on technology.
If you’re in that structural challenge category: You’ve got decisions ahead. Can you realistically hit efficient scale? Are premium markets actually accessible with committed buyers? Would technology substantially cut labor costs?
Tough questions, but necessary ones.
If you’re struggling even with support: Time matters. Each month affects retirement security. Good agricultural financial advisors can help evaluate options while you still have them.
Resources to Help You Plan
Want to dig deeper? Here are specific tools that can help:
- Cornell’s Dairy Farm Business Summary – Provides detailed benchmarking data (contact your local Cornell Cooperative Extension)
- Penn State’s Center for Dairy Excellence – Offers free financial analysis tools, including FINPACK
- University of Wisconsin’s Center for Dairy Profitability – Has online planning tools and consultants
- Your local FSA office Can provide your operation’s historical payment data and dependency trends
- Farm Credit associations – Many offer free financial planning consultations to members
Most land-grant universities have dairy specialists who can help run scenarios specific to your situation. Don’t hesitate to reach out—that’s what they’re there for.
Looking Forward with Clear Eyes
Those government payments flowing from reopened FSA offices mean different things to different operations. For some, it’s growth capital. For others, maybe a window for strategic transition while preserving equity.
With a dependency rate of 22.4% according to USDA, massive processing investments assuming stable supply, and ongoing political discussions about support… the planning environment keeps evolving.
Operations that honestly assess where they are—not where they wish they were—and act thoughtfully will likely be better positioned regardless of policy changes.
The calculations take maybe twenty minutes with good numbers. That time investment might provide more strategic value than months of hoping things improve. The question is whether we’ll do the analysis while options exist or wait until circumstances force decisions.
You know, driving through dairy country each day, passing farms that’ve operated for generations… these aren’t easy conversations. But agriculture has always evolved. What worked before might need adjustment for what’s coming.
Acknowledging that reality, while difficult, serves everyone better than avoiding it.
The support payments are arriving. The strategic questions remain. And the decisions—well, those belong to each operation based on their unique circumstances, goals, and honest assessment of where they stand in today’s dairy economy.
What’s clear is that understanding your true financial position—including that monthly equity impact—gives you the power to make informed choices rather than having them made for you.
And in this business, that might make all the difference.
Key Takeaways:
- Your Monthly Reality: Every month you operate at a loss burns $6,250 of retirement income—that’s $375,000 over five years you’ll never recover
- The 90% Problem: Only 1 in 10 dairy operations is genuinely profitable without government support; everyone else is either treading water (60-70%) or actively sinking (20-30%)
- The Investment vs. Survival Test: Operations that’ll exist in 2035 use government payments for genetics, technology, and land acquisition—not monthly bills
- The $11 Billion Question: Processors are betting massive capital on milk supply that depends entirely on political decisions—if payments end, who supplies that milk?
- Your Next 10 Minutes: Use our seven-step equity calculation tonight—it’s the difference between knowing your position and discovering it when it’s too late
Complete references and supporting documentation are available upon request by contacting the editorial team at editor@thebullvine.com.
Learn More:
- Pick Your Lane or Perish: The 18-Month Ultimatum Facing 800-1500 Cow Dairies – This critical guide targets the 60-70% of operations stuck in the middle ground, providing a concrete 18-month deadline and methods to optimize either for commodity scale or premium specialization. It directly supports the strategic decisions required to stop converting equity into operating losses.
- AI and Precision Tech: What’s Actually Changing the Game for Dairy Farms in 2025? – Discover the real-world ROI of key technologies like precision feeding and automated health monitoring, which promise 2-4 year payback and up to $500 per cow in savings. This article provides the necessary financial benchmarks to invest government payments strategically for immediate, measurable efficiency gains.
- Global Dairy Outlook 2025: Navigating a Buyer’s Market – Extend your strategic planning beyond domestic policy by understanding how international trade, tariffs, and global milk consumption trends are shaping prices in 2025. This analysis is vital for assessing the $11 billion processing bet and determining your long-term market risk exposure.
 Join the Revolution!
 Join the Revolution!
Join over 30,000 successful dairy professionals who rely on Bullvine Weekly for their competitive edge. Delivered directly to your inbox each week, our exclusive industry insights help you make smarter decisions while saving precious hours every week. Never miss critical updates on milk production trends, breakthrough technologies, and profit-boosting strategies that top producers are already implementing. Subscribe now to transform your dairy operation’s efficiency and profitability—your future success is just one click away.


