


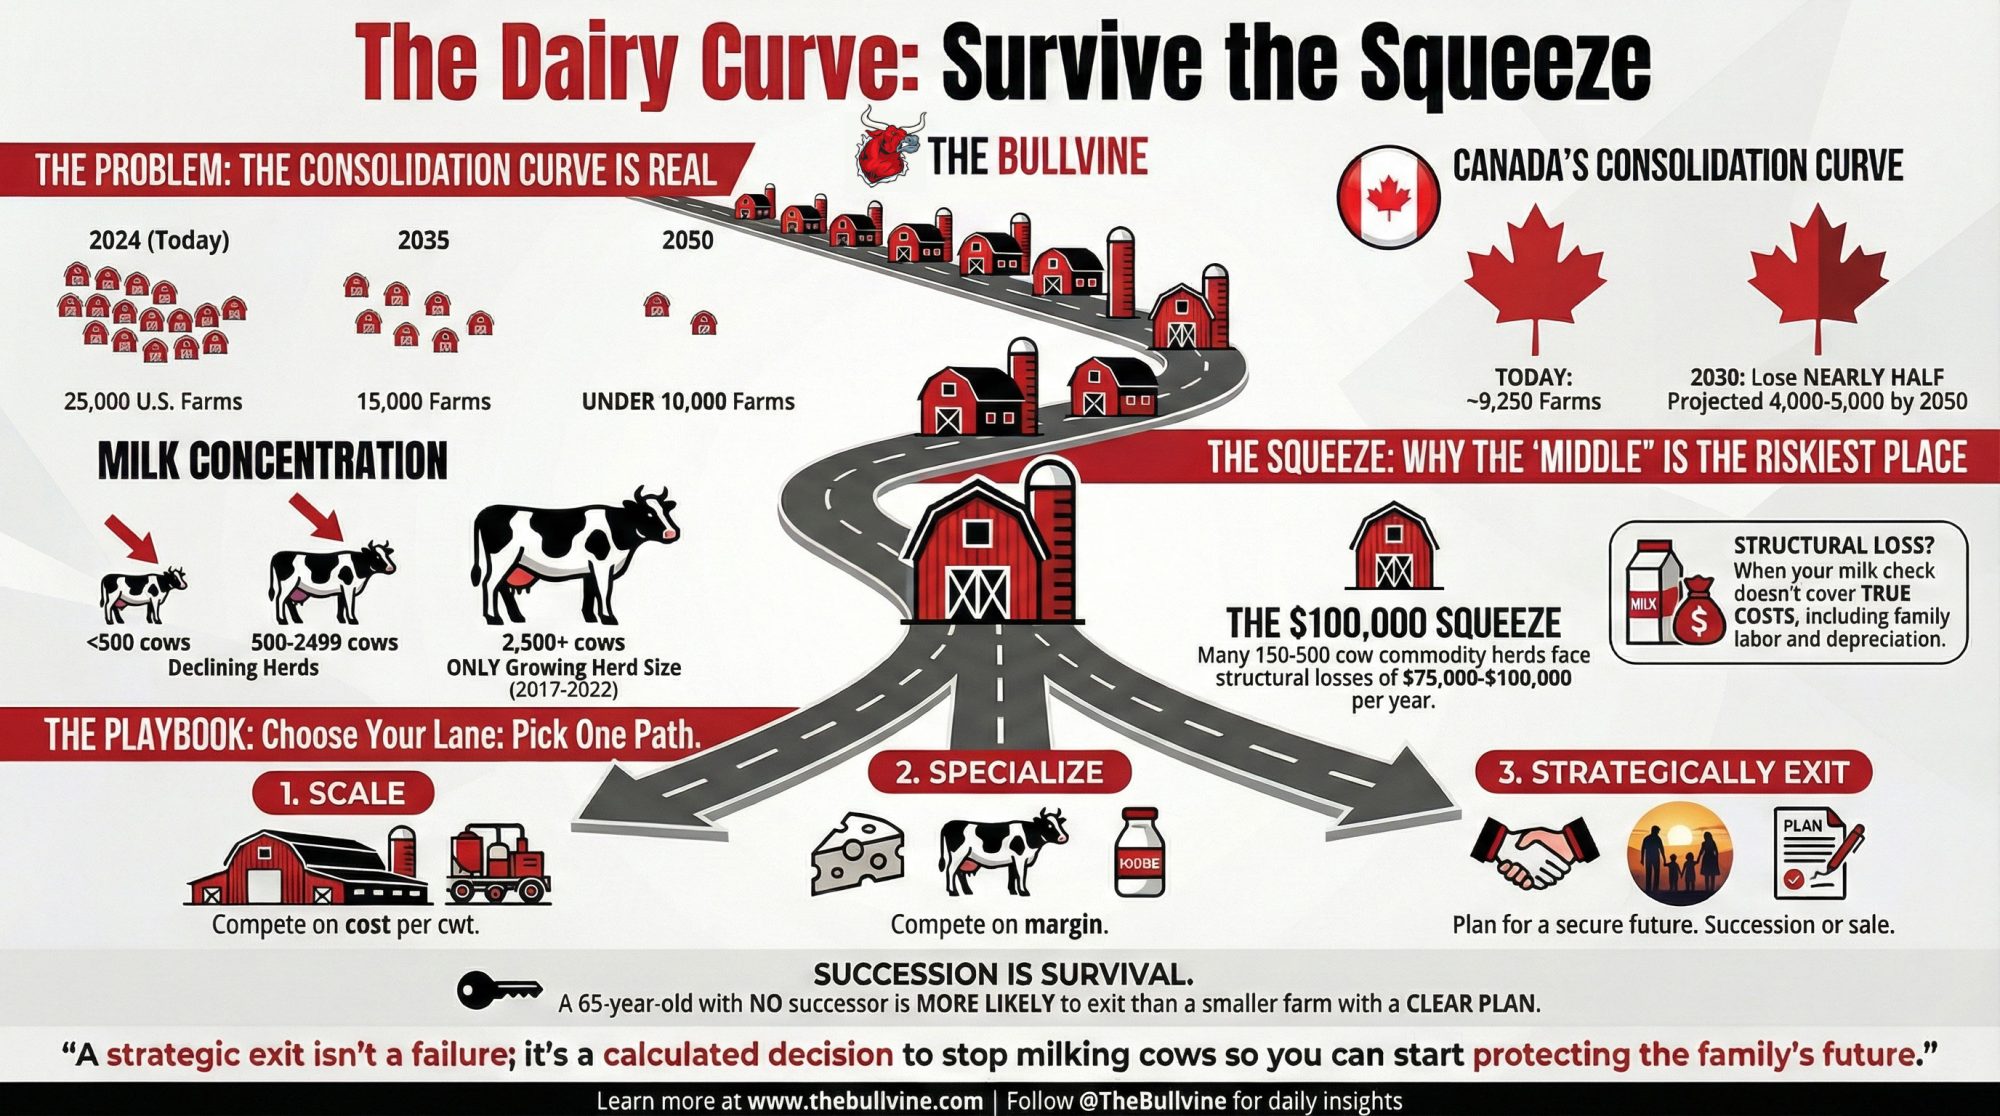
15,000 dairies by 2035. Under 10,000 by 2050. The Bullvine Dairy Curve shows exactly who survives that curve—and who gets priced out.
By 2035, roughly 15,000–16,000 U.S. dairies will be doing the work that nearly 30,000 did a generation ago—and the line between 5,000 and 15,000 herds by 2050 is being drawn right now in cost structure, technology, and succession decisions. What’s interesting is that you don’t have to buy into worst‑case doom to see it; you just have to follow the numbers we already have.
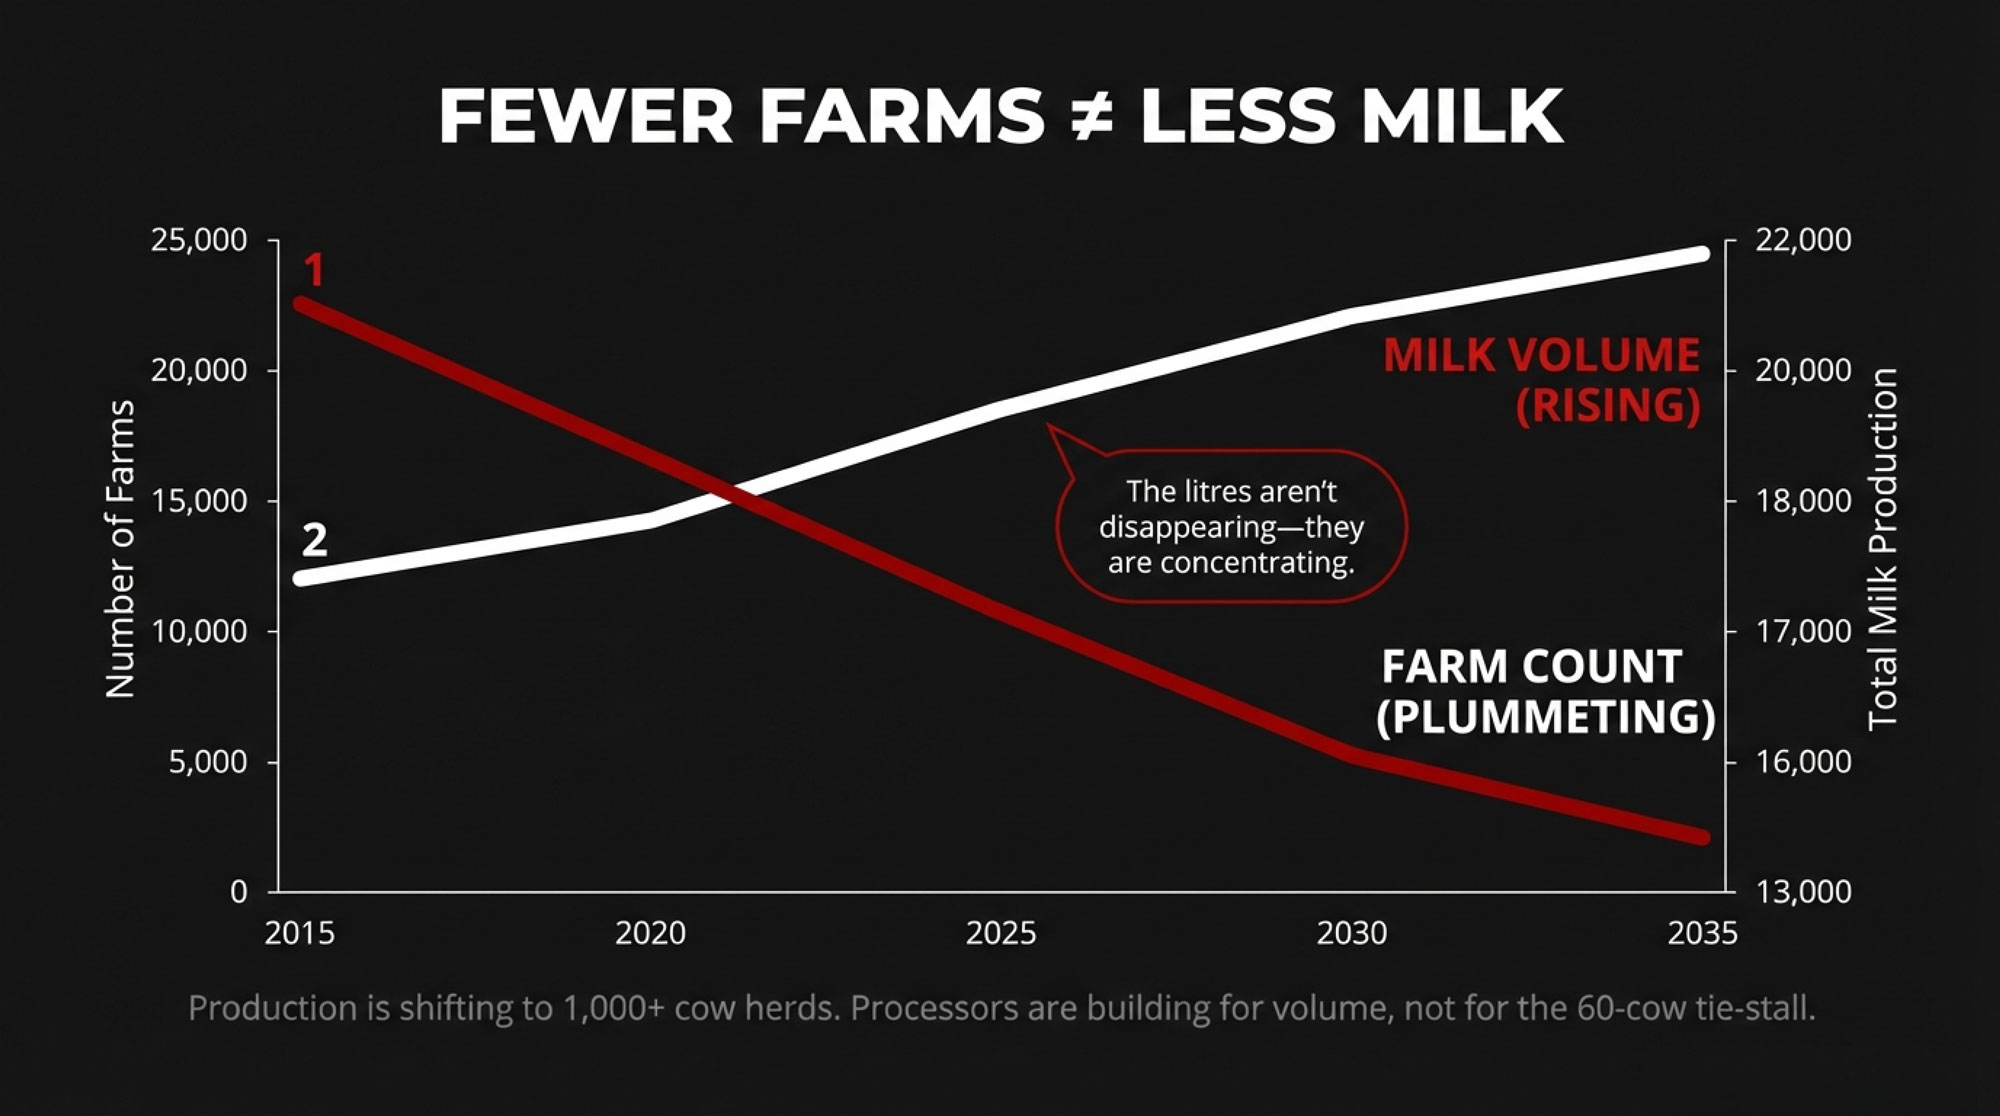
Almost 40% of U.S. dairies disappeared between the 2017 and 2022 Census of Agriculture, even as total milk output increased, and Canadian Agriculture and Agri‑Food Canada (AAFC) data show a similar “fewer farms, more milk” trend under supply management. Using those official data as the foundation, the Bullvine Dairy Curve points to three structural paths:
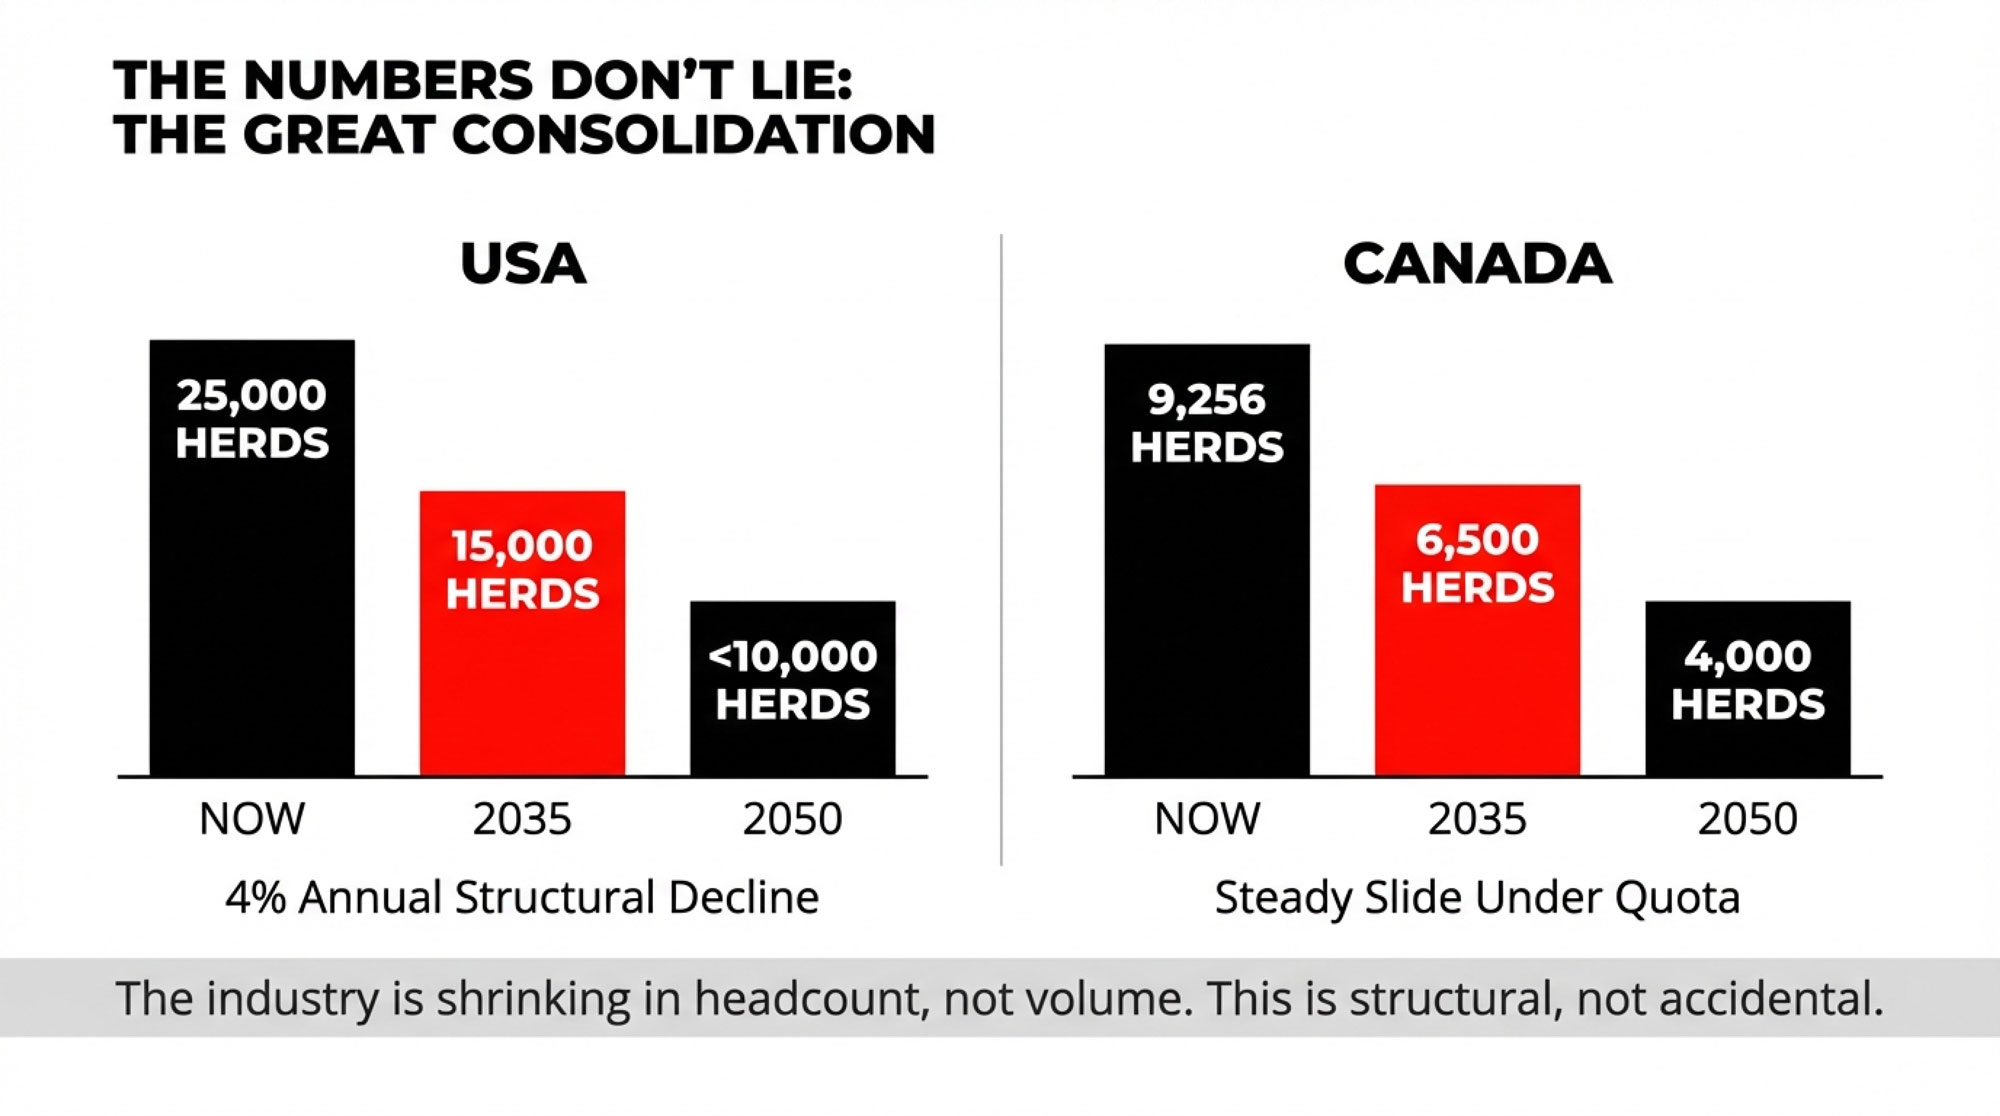
- A business‑as‑usual path where U.S. herd numbers decline around 4% per year and land in the 15,000–16,000 range by 2035 and well under 10,000—typically 8,000–9,000—by 2050; Canada tracks toward 6,500–7,000 by 2035 and 4,000–5,000 by 2050 under quota.
- A faster consolidation path where tighter labour, higher compliance costs, and alternative products push U.S. farms closer to 5,000 herds and Canadian herds into the 3,500–4,000 range by 2050.
- A managed transition path where better use of margin tools, disciplined capital decisions, and deliberate succession planning slow effective exit rates, keeping the U.S. closer to 15,000 herds and Canada around 6,500 by mid‑century.
| Path | U.S. Herds 2035 | U.S. Herds 2050 | Canada Herds 2035 | Canada Herds 2050 | Key Drivers |
| Business-as-usual | 15,000–16,000 | 8,000–9,000 | 6,500–7,000 | 4,000–5,000 | ~4% U.S. decline, 2–3% Canada under quota |
| Faster consolidation | ~12,000 | ~5,000 | ~5,500 | 3,500–4,000 | Labour, compliance, alt products, weak margins |
| Managed transition | ~15,000 | ~15,000 | ~6,500 | ~6,500 | Margin tools, disciplined capex, succession |
In all three paths, the litres don’t disappear—they concentrate. The largest freestall and dry‑lot systems steadily capture a larger share of the milk pool as economies of scale and processor preferences reward low‑cost, high‑volume suppliers. In that world, 150–500 cow herds that sit “average” on cost and are fully exposed to commodity pricing are often bleeding $75,000–$100,000 per year in structural losses once full labour and capital costs are factored in. That forces a three‑way choice: scale toward 1,000+ cows, pivot into premium/value‑add markets, or cash out while equity is still intact.
The rest of this article lays out the Bullvine Curve in plain language: what the official numbers say, how Bullvine’s forecasts connect the dots out to 2035 and 2050, and a barn‑level playbook to decide whether your operation is building to survive that structure—or quietly betting against it.
Where we’re actually standing today
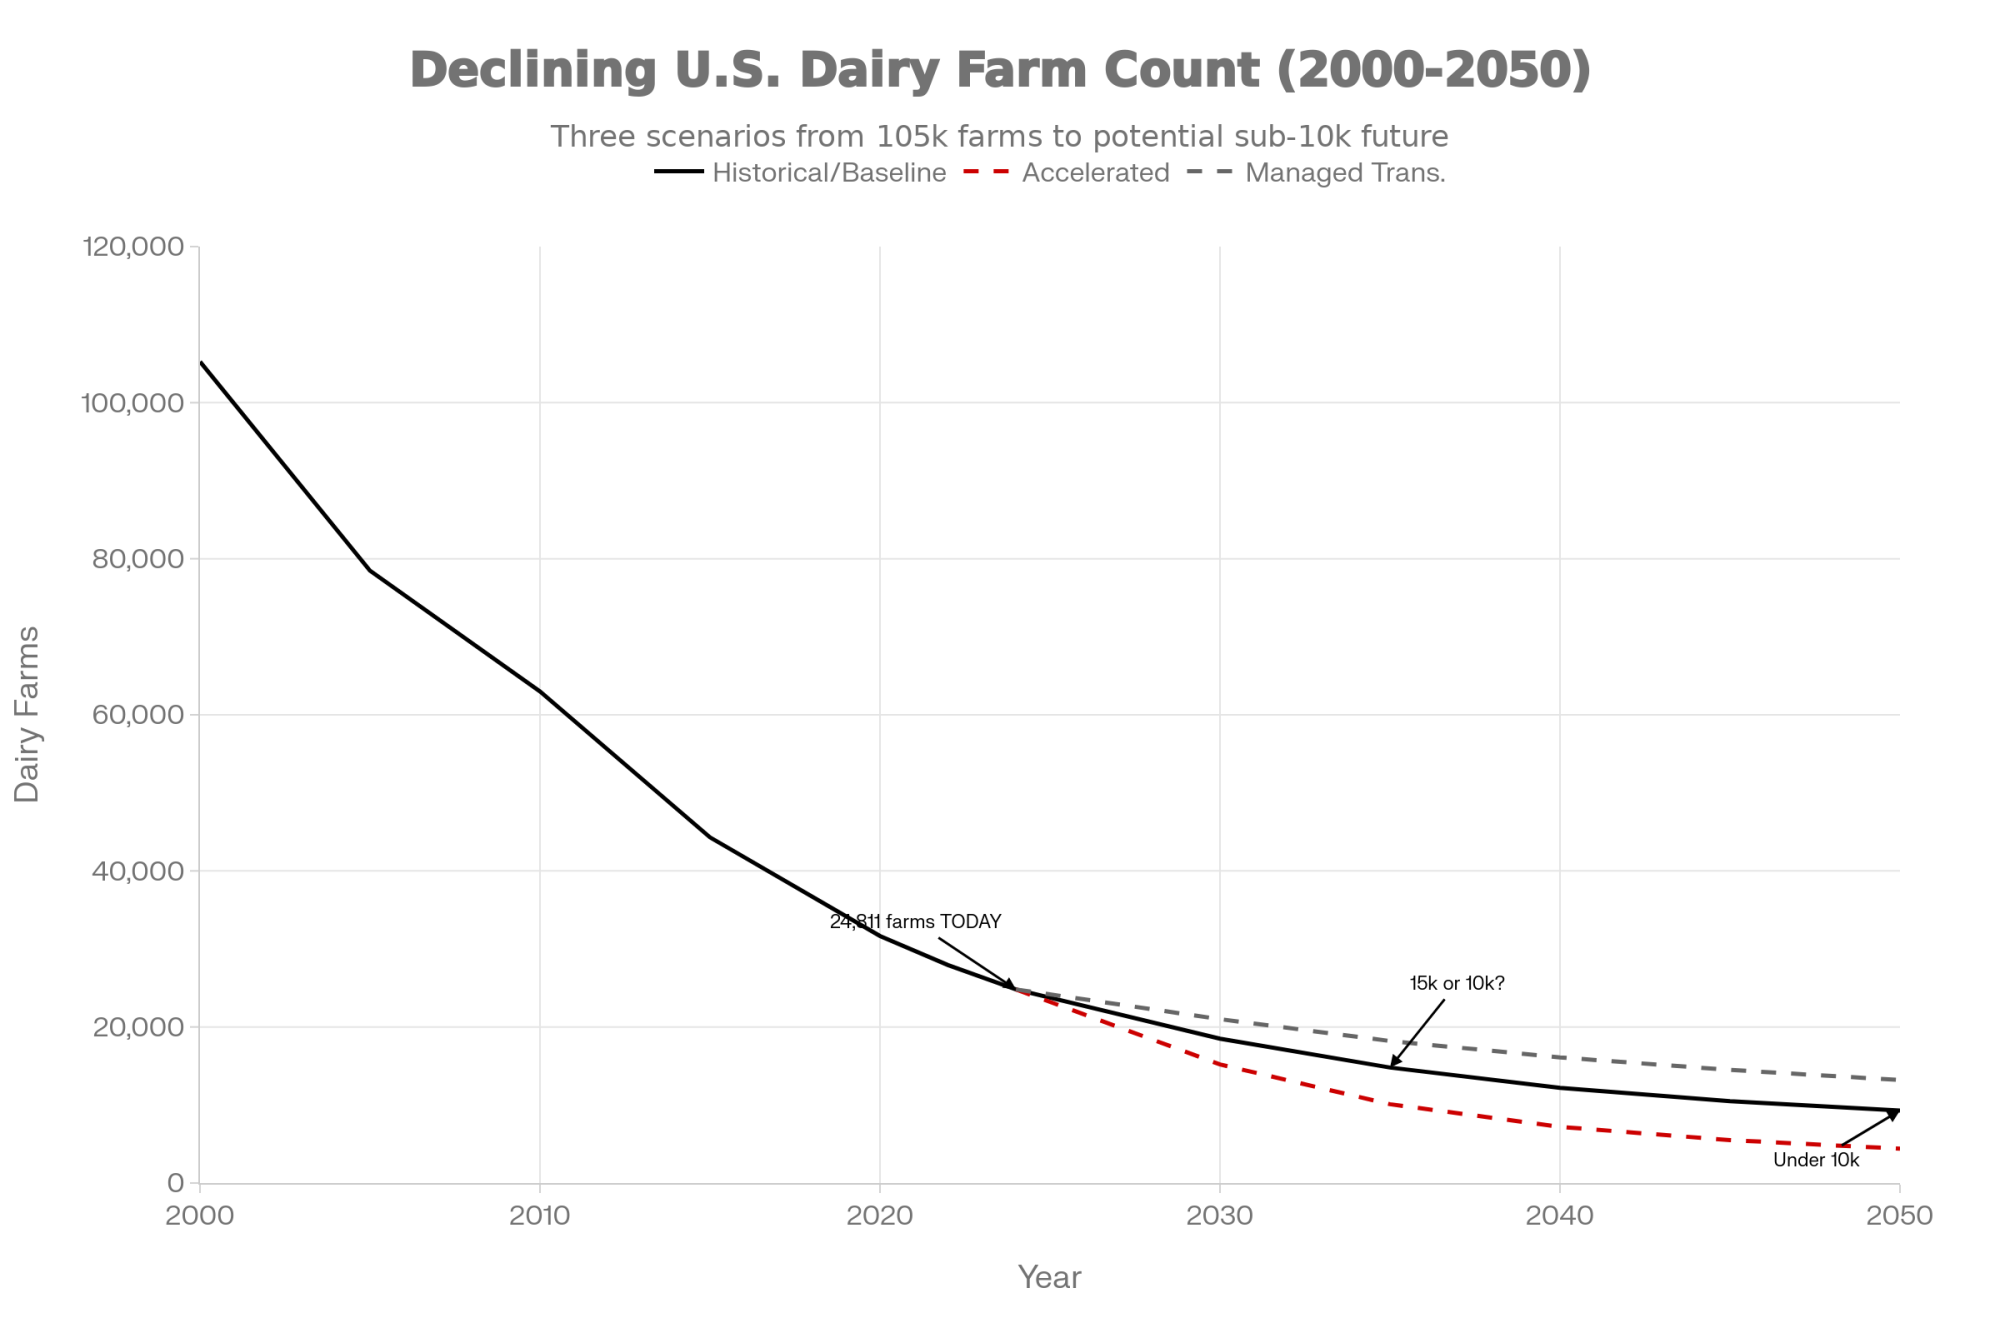
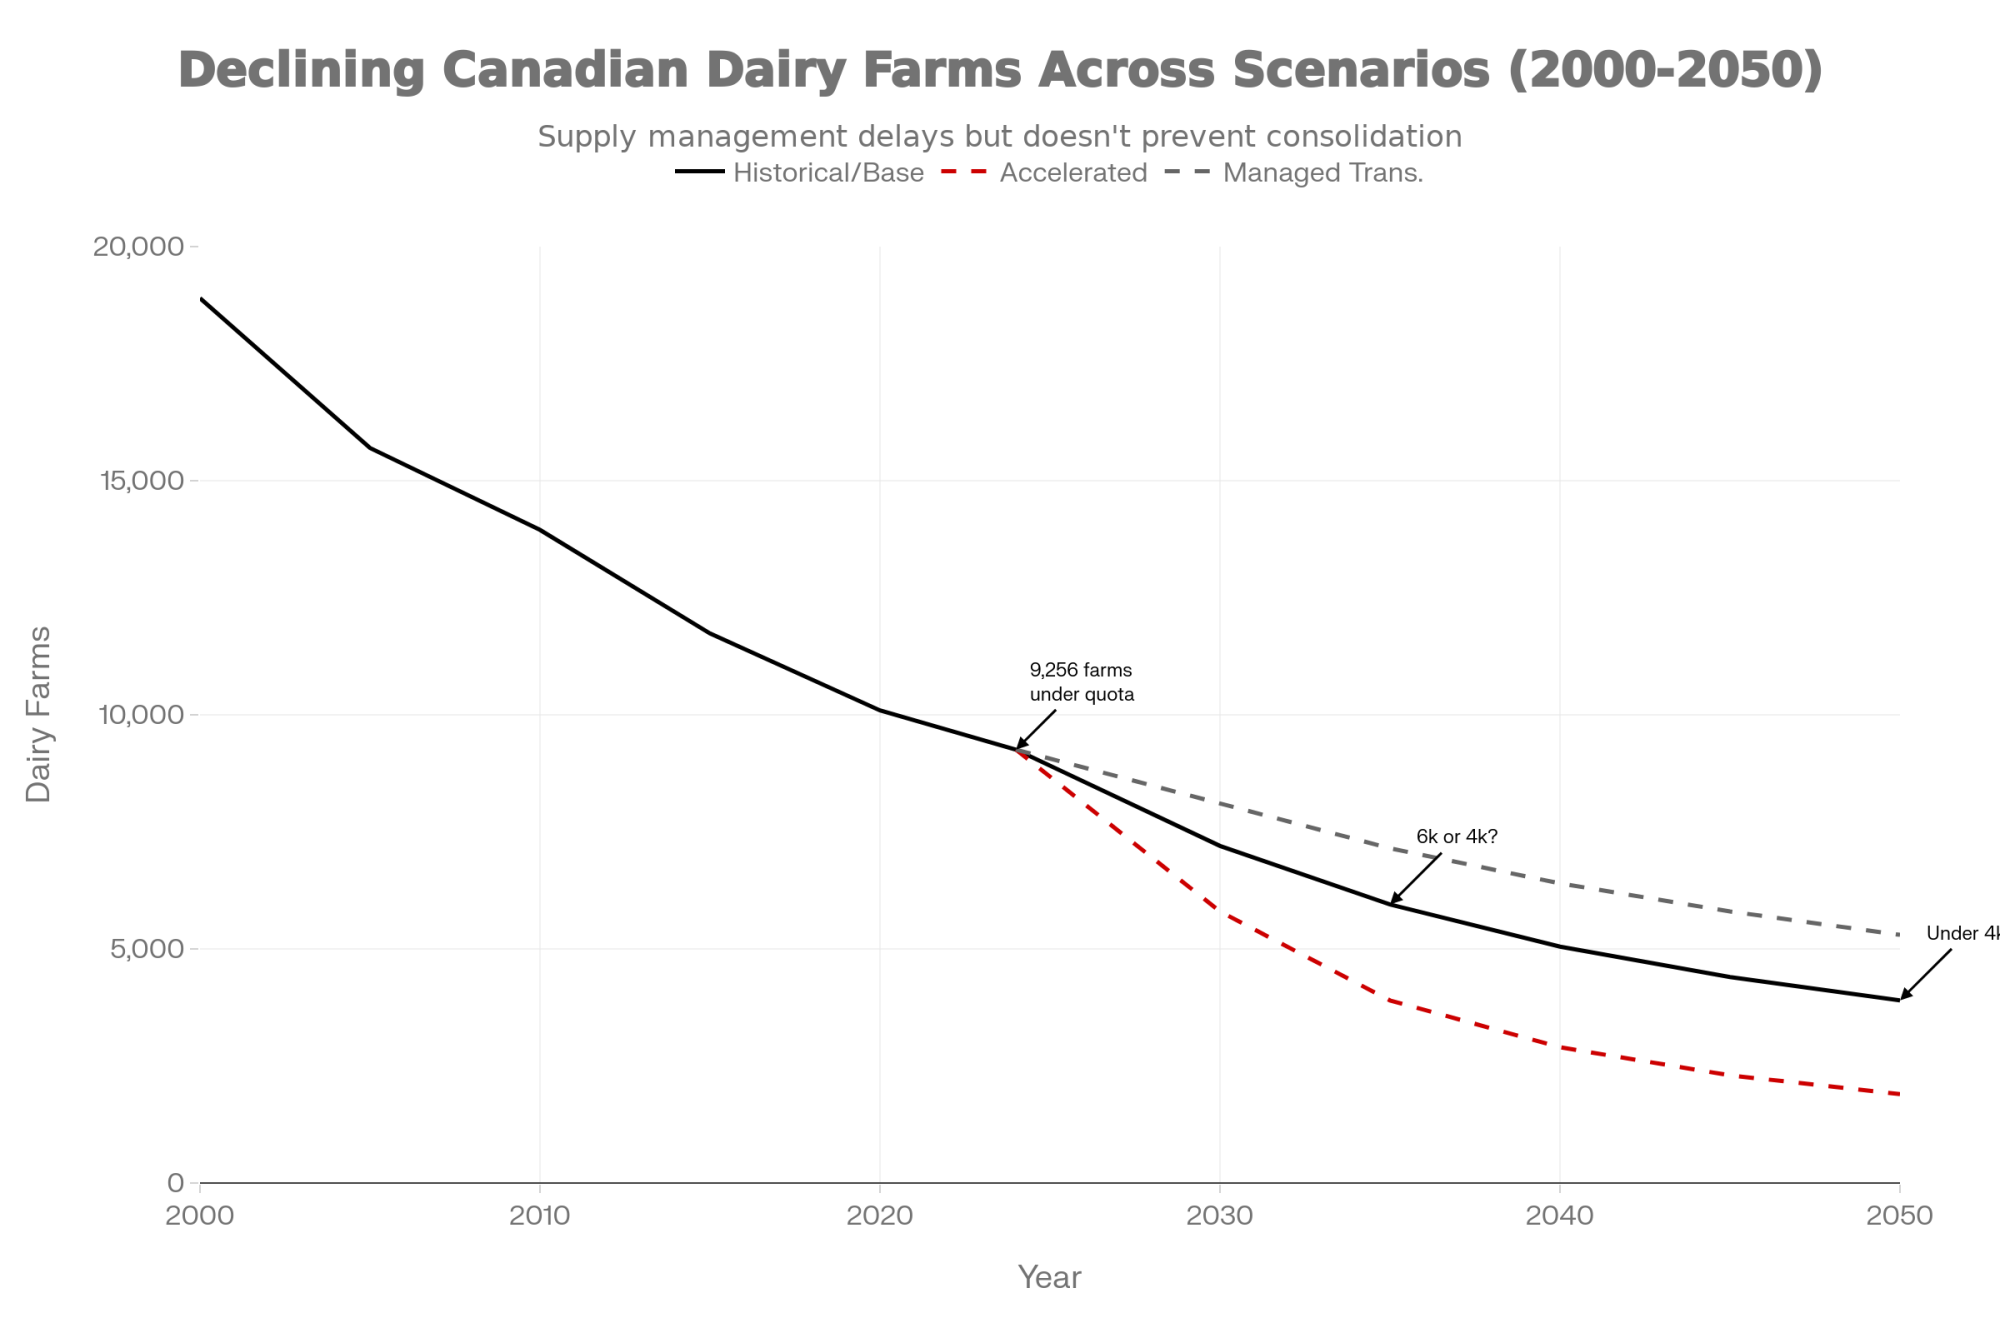
You don’t need a chart to know things have changed; you see it in auction bills and quiet parlours. The 2017 Census of Agriculture recorded 39,303 U.S. farms that sold milk from cows; by 2022, that number had dropped to 24,094, a decline of almost 40% in just five years, even as total U.S. milk production nudged about 5% higher on roughly the same total number of cows. USDA’s Economic Research Service found the longer‑run trend is the same: between 2002 and 2019, licensed U.S. dairy herds fell by more than half while national output increased, with the rate of decline accelerating in 2018–2019 and production shifting toward larger herds with higher yields per cow.
In Canada, AAFC’s Dairy Sector Profile shows farm numbers falling from 12,007 in 2014 to 9,256 in 2024—an average decline of about 2.6% per year—while milk production rose from roughly 78.3 to 96.6 million hectolitresand average farm milk prices increased from just over $82 per hectolitre to more than $97. So on both sides of the border, the story is the same: fewer herds, more milk, with the U.S. consolidating faster and Canada sliding more slowly under quota.
That’s the data the Bullvine Dairy Curve starts from: official census and ERS/AAFC work, but extended into structural scenarios that ask a more practical question—which herds are still milking in 2035 and 2050, and what do they look like?
The Bullvine Dairy Curve: 15,000 by 2035, <10,000 by 2050
ERS’s Consolidation in U.S. Dairy Farming gives the cleanest long‑term U.S. baseline: herd numbers down about 55% from 2002–2019, roughly a 4% annual decline, while national production increased and midpoint herd size kept rising. When you extend that 4% curve from today’s roughly 25,000 U.S. herds and overlay it with the 2017–2022 cliff—where the only U.S. size class that actually grew was herds with 2,500+ cows—you land in the same band Bullvine’s early consolidation work described.
- U.S. baseline band: about 15,000–16,000 licensed herds by 2035, with 8,000–9,000 by 2050 if that structural rate holds.
- Canadian baseline band: a slower but steady slide toward 6,500–7,000 farms by 2035 and 4,000–5,000 by 2050, consistent with 2–3% annual attrition under supply management.
Since those first Bullvine forecasts, the signals have only sharpened. Follow‑up Bullvine work has documented that U.S. closures have effectively been running closer to 4–8 farms per day, and that about half of U.S. farms vanished between 2013 and 2025, with another 50% reduction projected by 2035 if current pressures persist—implying the industry could land in the lower half of that 15,000–16,000 band. In Canada, commentary that the country is “on track to lose nearly half of its remaining dairy farms by 2030,” with production concentrating in Quebec and Ontario, aligns with the 6,500/4,000–5,000 Bullvine bands.
| Path | U.S. Herds 2035 | U.S. Herds 2050 | Canada Herds 2035 | Canada Herds 2050 | Key Drivers |
|---|---|---|---|---|---|
| Business-as-usual | 15,000-16,000 | 8,000-9,000 | 6,500-7,000 | 4,000-5,000 | ~4% U.S. decline, 2-3% Canada under quota |
| Accelerated consolidation | ~12,000 | ~5,000 | ~5,500 | 3,500-4,000 | Labor, compliance, alt products, weak margins |
| Managed transition | ~15,000 | ~15,000 | ~6,500 | ~6,500 | Margin tools, disciplined capex, succession |
The exact number isn’t the point. The curve is. The Bullvine Dairy Curve says: plan for an industry with far fewer farms, more concentrated milk, and a structure where being “average” in the middle is the riskiest place to stand.
How the curve hits different herd sizes and regions
Under ~150 cows: small, but only if it’s specialized
Cost‑of‑production work and intensification studies consistently show that small conventional herds carry higher costs per cwt unless they combine very low debt, strong home‑grown forage, and heavy reliance on family labour. The small herds that are thriving as the curve plays out almost all made a deliberate move away from being “average” commodity suppliers—into organic, grass‑based, A2, on‑farm processing, or other premium systems where margin comes from price, not just volume.
This development suggests that “staying small” only works when you’re deliberately un‑average—either in cost or in the milk cheque you’re targeting. A 60‑cow tie‑stall under quota with direct‑marketed fluid milk or value‑added cheese lives on a different part of the curve than a 60‑cow conventional herd shipping into a generic pool.
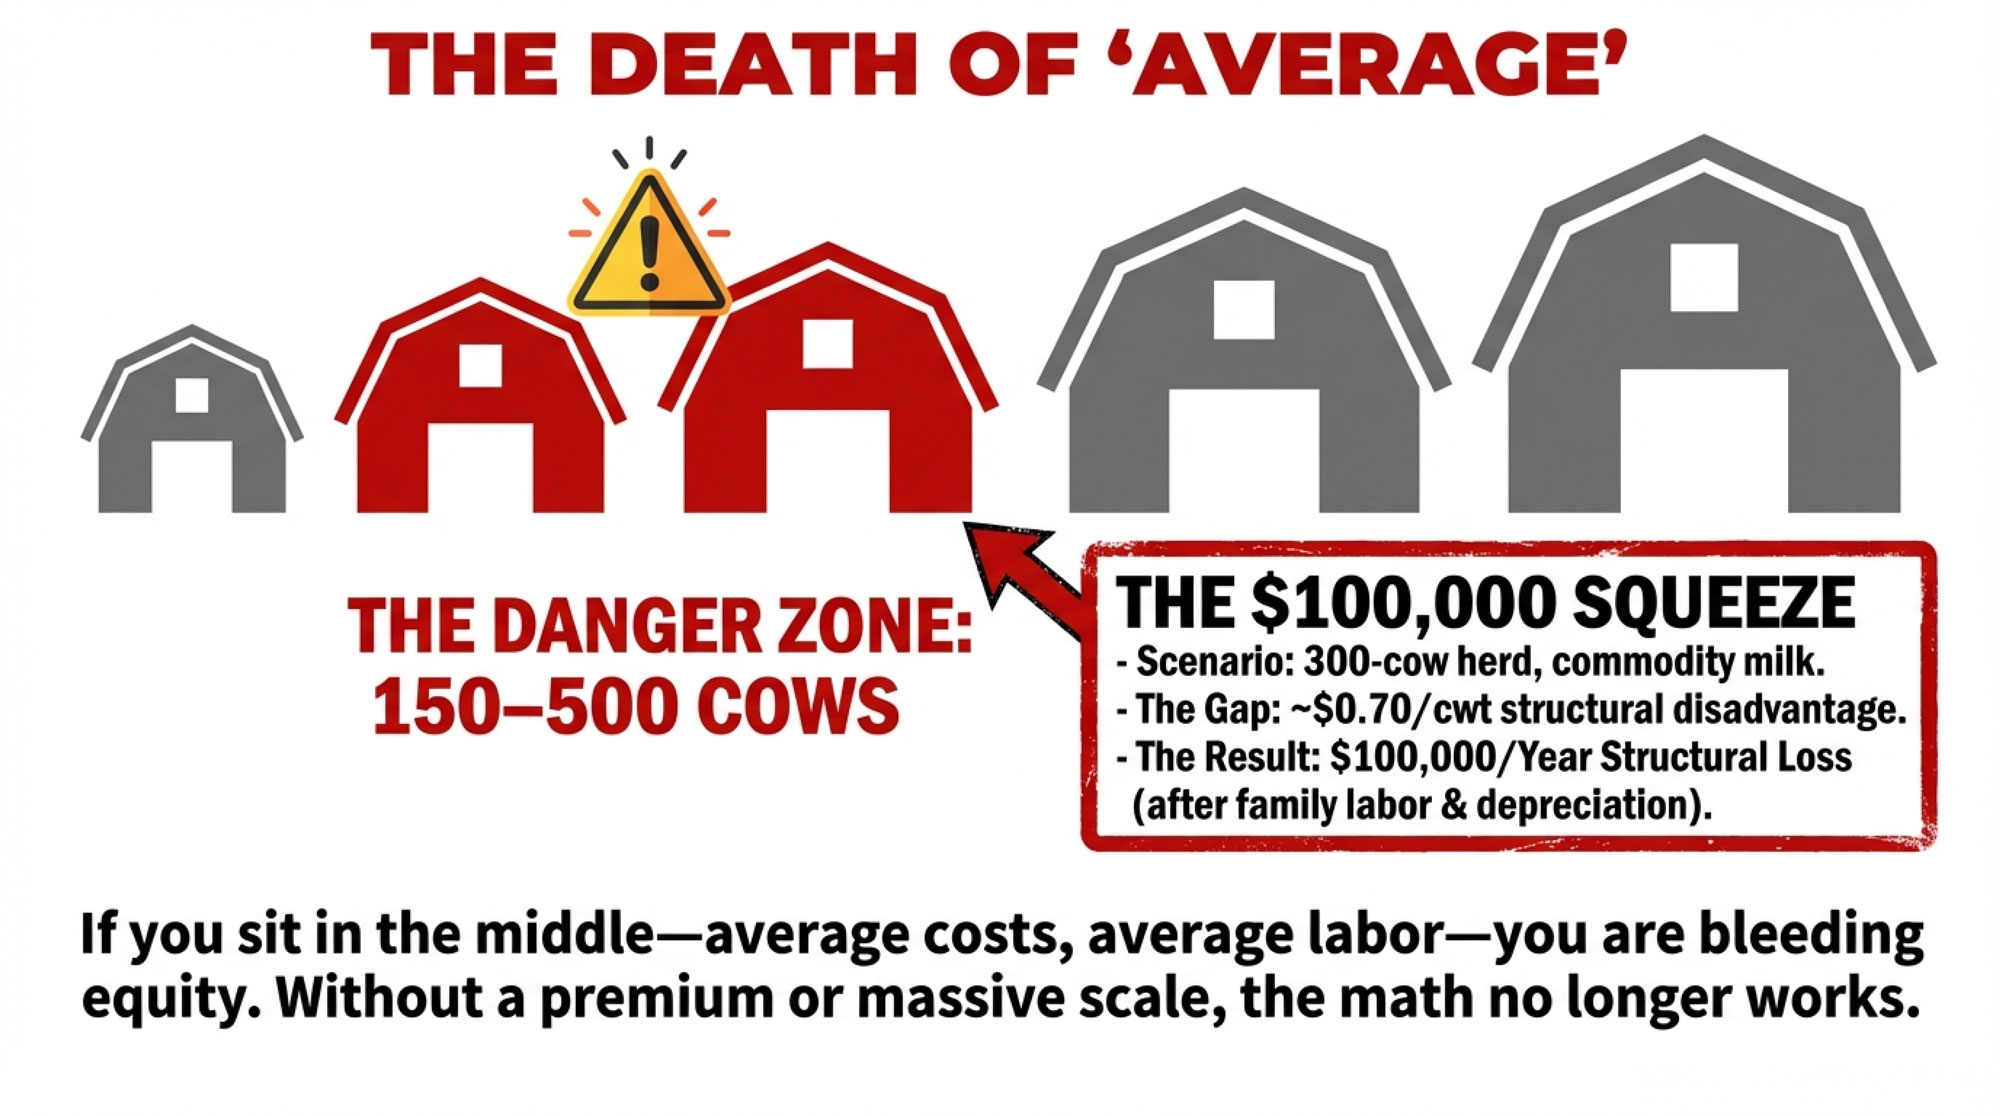
150–500 cows: the middle that the math squeezes first
Bullvine’s early projections already highlighted structural pressure on 250–400 cow freestalls: too big to be niche without a clear premium plan, too small to spread fixed costs like a 1,500‑cow system. Updated census and case work show that:
- Over 15,200 U.S. dairy farms vanished between 2017 and 2022, with a big share in the 100–499 and 500–999brackets.
- Many 250–400 cow herds running “average” cost structures and fully exposed to commodity pricing are carrying $75,000–$100,000 in structural losses per year once full labour and capital costs are accounted for.
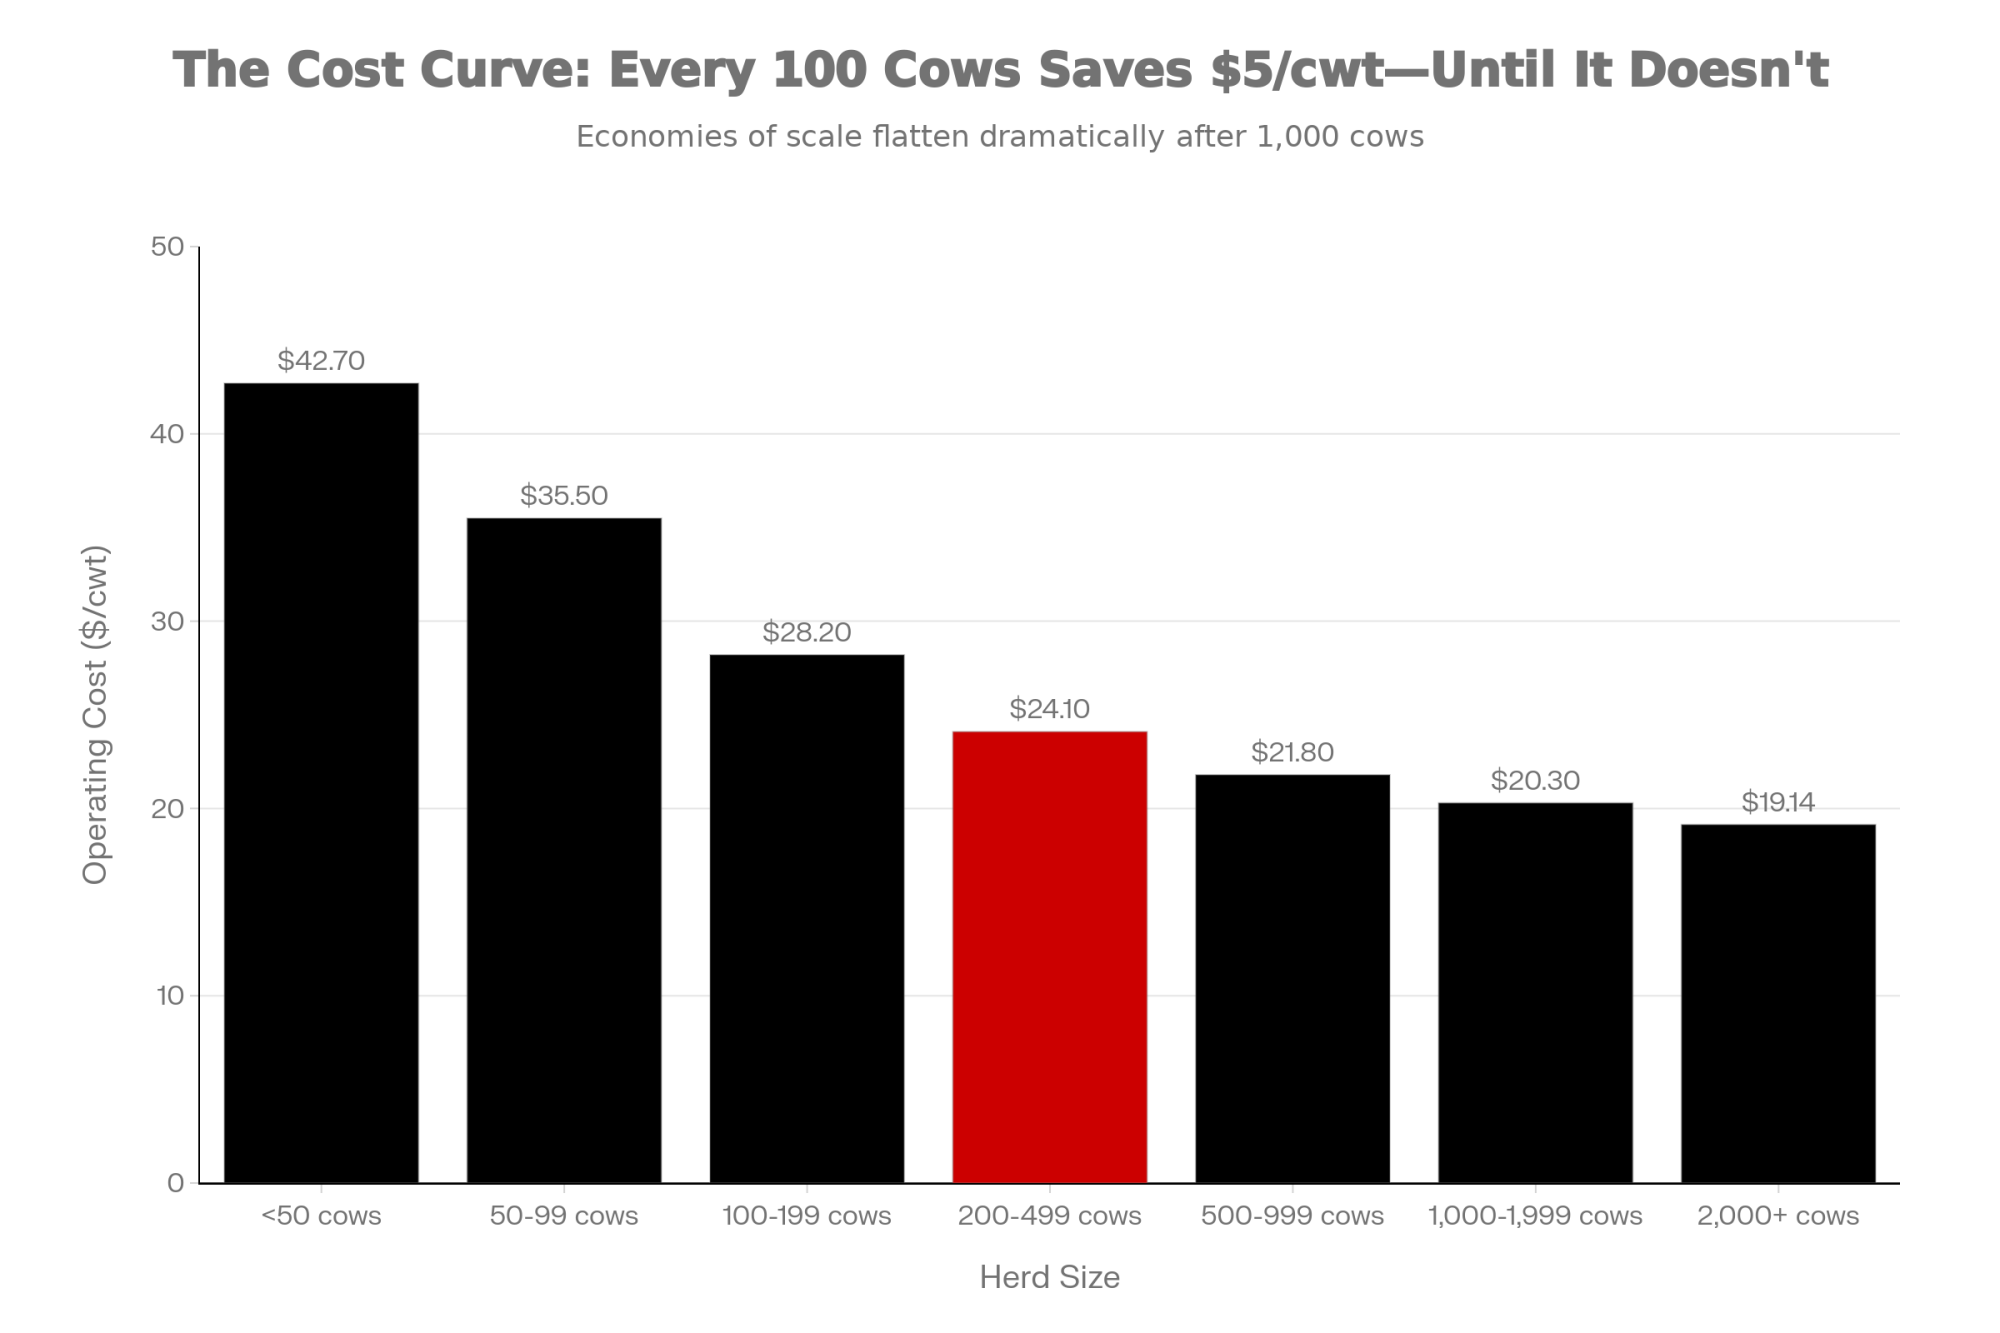
| Herd Size | Cows | Annual Milk (cwt) | Structural Gap ($/cwt) | Annual Loss (approx.) |
| Small mid | 200 | 96,000 | $0.80 | $76,800 |
| Core mid | 300 | 144,000 | $0.70 | $100,800 |
| Large mid | 400 | 192,000 | $0.60 | $115,200 |
One Upper Midwest producer told us their 320-cow herd looked profitable on their milk cheque—until they ran a full-cost analysis with realistic family labour and depreciation. The gap? About $0.72 per cwt, which worked out to roughly $95,000 a year, they’d been quietly losing without realizing it. That’s not a bad year; that’s structure.
That’s why the Bullvine Curve is so blunt about this band: in a 15,000‑farm, <10,000‑farm future, the conventional middle either deliberately scales, specializes, or exits; drifting is the expensive option.
Honestly, what jumps out is how many 300‑cow herds are still trying to play yesterday’s game—commodity milk, average cost, no clearly defined premium hook—in a structure that’s already priced that strategy out for a lot of regions.
1,000+ cows: where the early assumptions became reality
From the beginning, the structural projections assumed economies of scale and lower total cost per cwt would keep pulling volume into larger herds, with a significant share of U.S. milk concentrated in herds of 2,000–2,500 cows by 2050. ERS follow‑up work and Bullvine’s Great Consolidation analysis confirm that:
- Net returns for 1,000+ cow herds have outpaced smaller herds in most years studied.
- Only the 2,500+ cow herd class actually grew in number between 2017 and 2022, and those herds now account for a very large share of U.S. milk sold.
| Farm Size | Annual Exit Rate | 10-Year Survival | Risk Level |
|---|---|---|---|
| 10-49 cows | 12% | 28% | CRITICAL |
| 50-99 cows | 8% | 43% | HIGH |
| 100-199 cows | 7% | 48% | HIGH |
| 200-499 cows | 5% | 60% | MODERATE |
| 500-999 cows | 3% | 74% | LOW |
| 1,000+ cows | 2% | 82% | STABLE |
In Canada, the curve is flatter, but the logic is similar: fewer farms, more quota concentrated in larger herds, and a national structure where roughly 90% of farms are now clustered in a few provinces, especially Quebec and Ontario.
What’s interesting here is that the “big herds win on cost” assumption from 10–15 years ago has largely become a day‑to‑day reality—but with it comes a different risk profile tied to environmental regulation, export dependence, water, and labour, especially in dry‑lot systems.
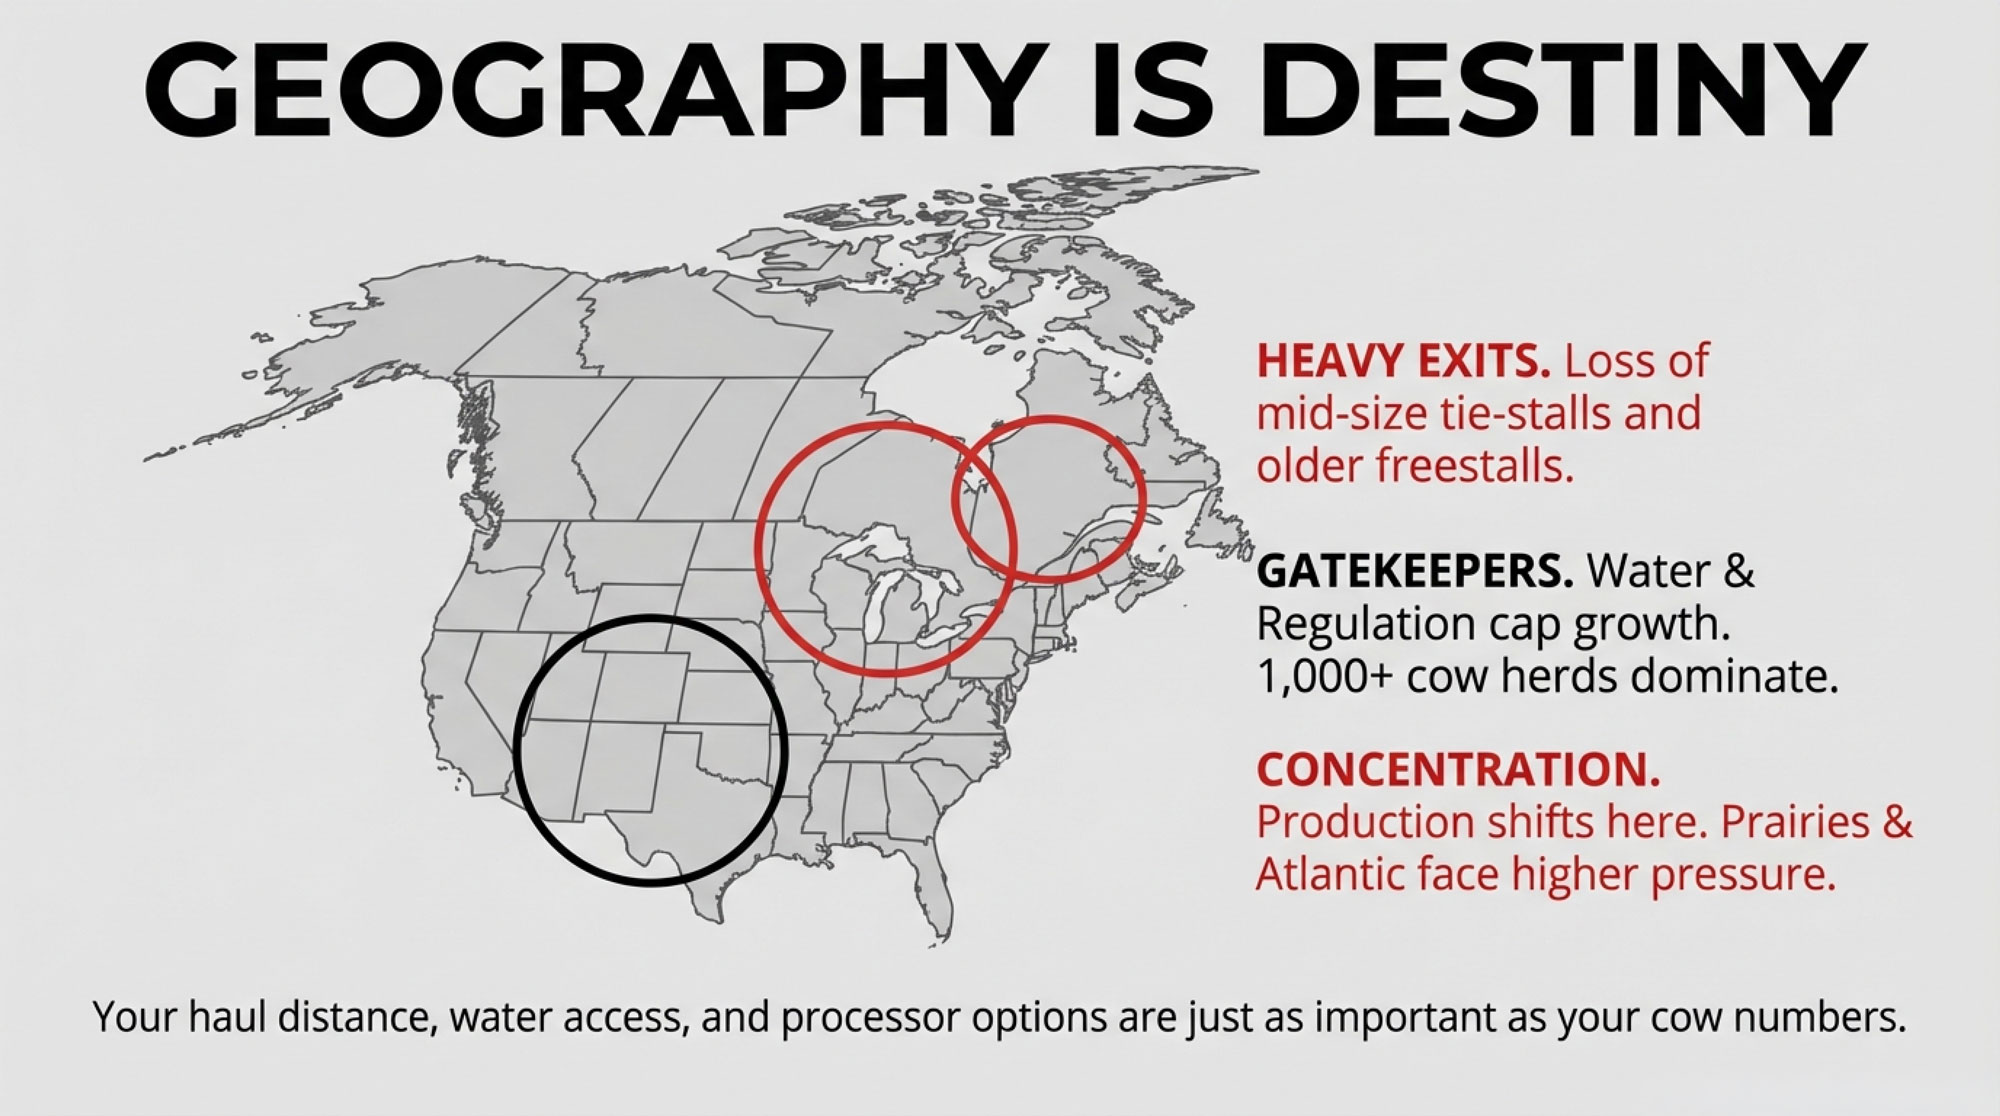
Regional reality: the curve isn’t smooth everywhere
The Bullvine Curve was never “every region looks the same.” The shape is similar; the slopes and pain points aren’t.
- In the Upper Midwest and Northeast, exits are concentrated among smaller and mid‑size tie‑stalls and older freestalls, with modest growth in 1,000–2,000 cow herds and strong but concentrated production in states like Wisconsin and New York.
- In the Southwest and High Plains, a relatively small number of very large freestall and dry‑lot systems supply big cheese and powder plants, with water, heat, and environmental rules acting as both risk and gatekeeper.
- In Canada, AAFC data and quota policy mean the curve is slower and more managed, but the direction is the same: fewer farms, more litres per herd, and more of that production anchored in Quebec and Ontario, with smaller operations in the Atlantic and Prairies under more pressure.
I’ve noticed that when producers really “get” the curve, it’s often after they plot themselves against regional realities: haul distance, processor options, land prices, and labour pool, not just cow numbers.
From forecast to milk‑house: the Bullvine playbook
Forecasts only matter if they change decisions. The Bullvine Dairy Curve is built to drive a handful of blunt, barn‑level questions rather than just scare charts.

1. Which lane are you actually in?
In a 15,000‑farm, <10,000‑farm world, most herds that stay in the game long‑term are choosing one of three lanes:
- Scale: Build toward 1,000+ cows with a cost structure that genuinely competes per cwt, understanding the capital, labour, and concentration risk.
- Specialize: Stay smaller or mid‑size but sell into markets that pay on margin—organic, grass‑based, A2, on‑farm processing, or tightly integrated supply contracts.
- Strategic exit: Use the forecast window to sell or transition on your terms while equity is intact, especially where succession isn’t clear.
Not choosing is still a choice; it just lets the curve choose for you. What farmers are finding is that being vague—“we’ll see how it goes”—is often the costliest option.
2. What is your true cost per cwt and “danger zone”?
ERS cost‑of‑production data and extension tools show that, on average, larger herds have lower total economic costs per hundredweight, but there’s a wide spread inside every size class. The farms that navigate the curve best usually:
- Know their full cost per cwt with realistic values for family labour and capital.
- Have a clear milk‑feed ratio “danger zone” where they tighten capital, sharpen feed, and check in with lenders more often.
In a 200‑cow herd shipping 8,000 cwt a month, a 50‑cent swing in margin is roughly $4,000 a month or $48,000 a year—almost exactly the gap between treading water and investing in the next needed project. That’s the kind of math that quietly decides whether you can upgrade a parlour or add stalls to lift butterfat performance and fresh cow comfort.
3. Is your next dollar going into scale, comfort, or robots—and why?
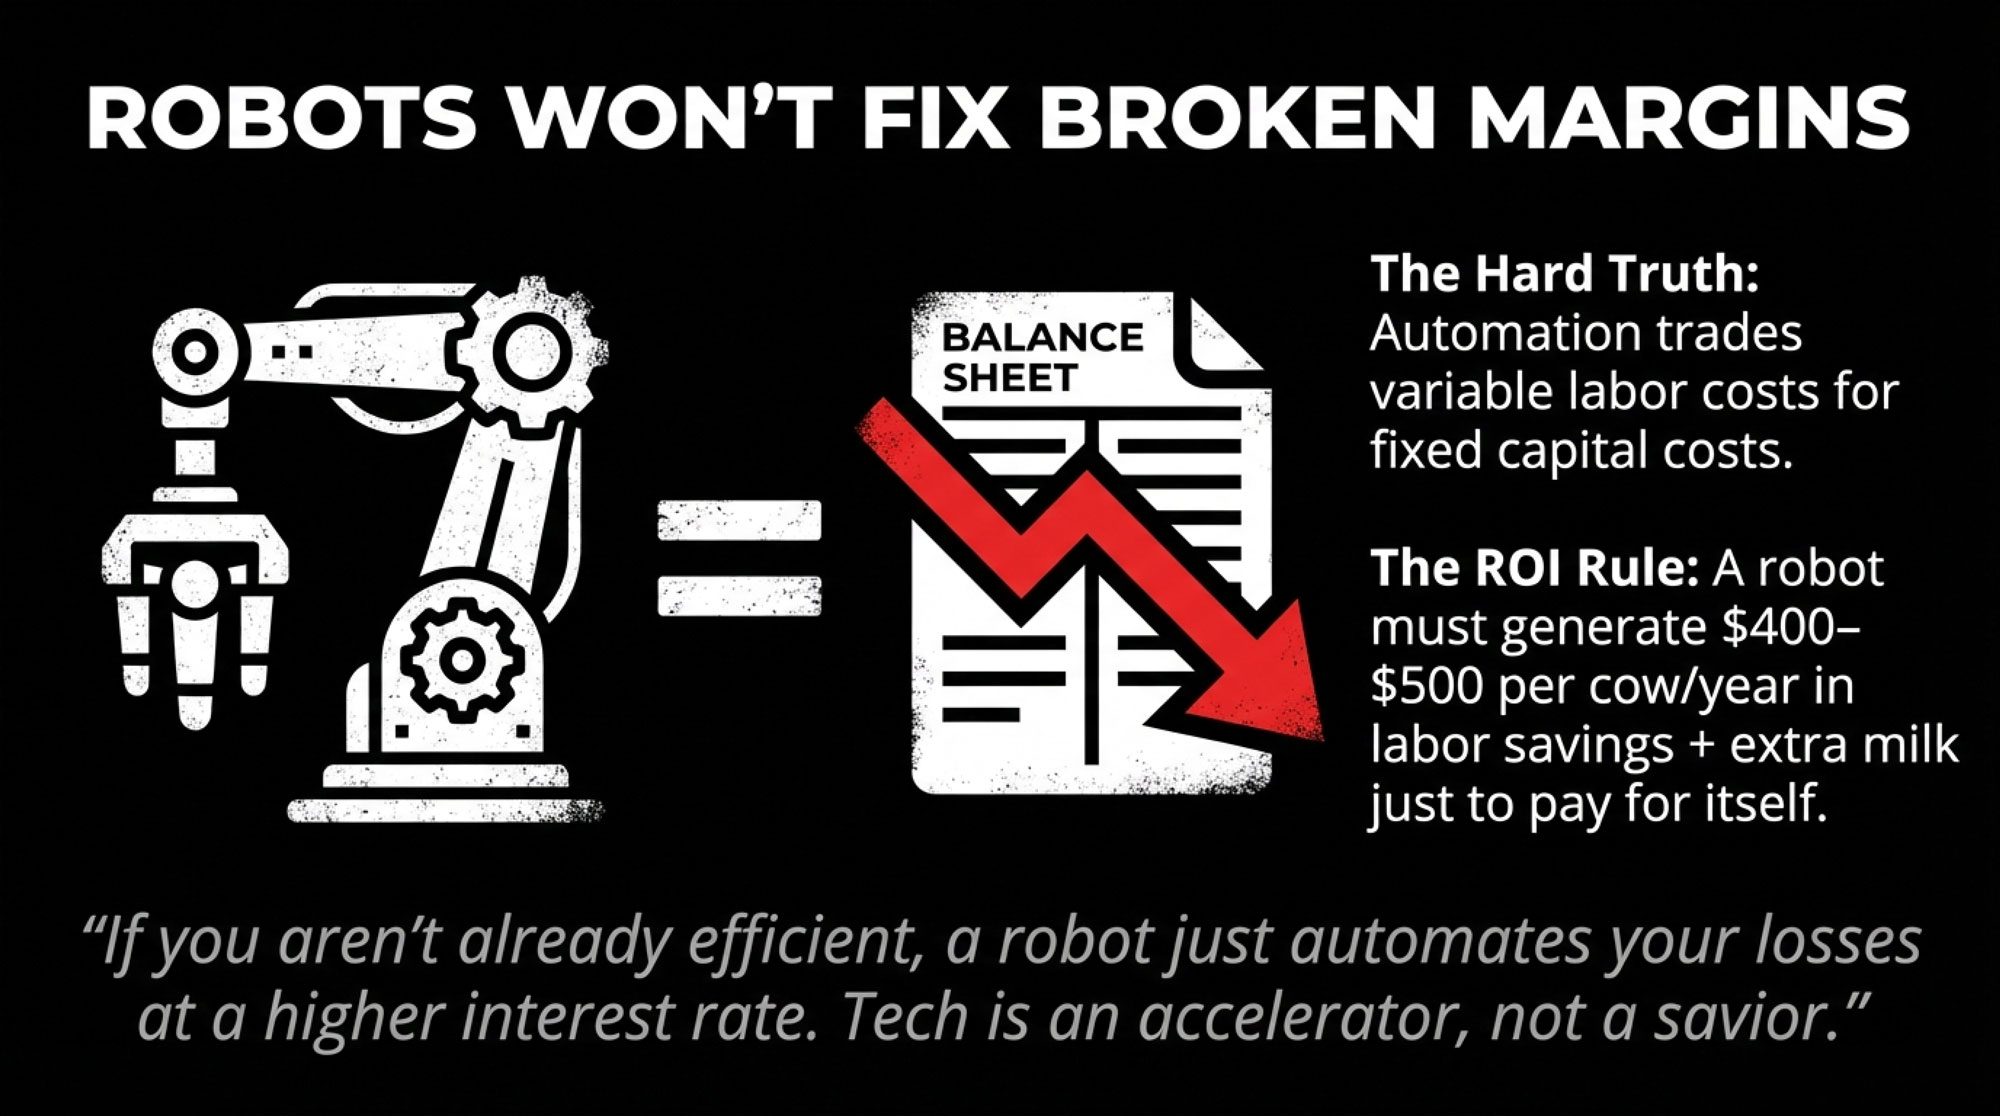
The curve doesn’t say “robots good, parlours bad,” it says “robots amplify whatever is already in your numbers.” While Automated Milking Systems (AMS) solve the immediate headache of labor availability, they fundamentally shift your balance sheet. You are trading variable labor costs for high fixed capital costs. In a “commodity milk” lane, this move pushes you further into the “efficiency required” lane: because your fixed costs per hundredweight are now higher, your margin for error on milk production and components disappears.
- On smaller herds under ~100–120 cows, AMS often struggles to pencil out unless there’s a premium market, off‑farm income, or a clear growth plan.
- In the 150–250 cow band, robots can work where labour is genuinely tight, and management is strong, but they typically need $400–500 per cow per year in a mix of labour savings and extra milk to carry their weight over a typical financing term.
- Larger freestall/dry‑lot systems treat robots, high‑throughput parlours, sort gates, and sensors as part of broader cow‑flow and labour strategy, not silver bullets.
The Robot Reality Check: If your herd isn’t already hitting top-tier production and health metrics, a robot won’t fix the margin—it will just automate the loss at a higher interest rate.
The Bullvine playbook is simple: if you can’t show on paper where the extra dollars per cow per year come from, ask whether stalls, feed storage, or transition pens would move your position on the curve more. In other words, don’t let fatigue drive a million‑dollar robot decision if fresh cow management and housing are still your biggest bottlenecks.

4. Who actually wants to be milking here in 2035?
Succession is the quiet driver you don’t see on the milk cheque, but it shows up in the forecast. National surveys by lenders and advisory firms consistently find that only a minority of producers have formal written succession plans, even when an adult child is active. Research on exits also shows that age and the presence of an identified successor are strong predictors of whether a farm continues to operate 10–15 years later, even after controlling for herd size and profitability.
In practice, that means a financially solid 65‑year‑old with no successor is more likely to be on the “exiting half” of the Bullvine Curve than a somewhat smaller or slightly less efficient herd where a 35‑year‑old is already leading breeding, facilities, and lender meetings. Putting a basic timeline and ownership plan on paper is one of the simplest ways to move your operation onto the “still milking by choice” side of the 2035/2050 lines.
I’ve seen more than one herd where the real turning point wasn’t a bad milk price year—it was the moment the family admitted no one under 40 actually wanted night checks and bank meetings for the next 20 years.
The “Strategic Exit”: Harvesting Equity, Not Admitting Defeat
One of the hardest parts of the Bullvine Dairy Curve is the “Exit” conversation. We need to change the vocabulary around leaving the industry. In every other sector of the global economy, “exiting” at the top of a market or when equity is strongest is called a successful business cycle.
If the curve shows that your regional processor access is shrinking or your cost structure is hitting a structural ceiling, executing a Strategic Exit is an act of leadership. It allows you to:
- Protect Generational Wealth: Cash out while land and quota values are high, rather than “burning the house for warmth” by eroding equity during years of structural losses.
- Define Your Legacy: Transitioning the land to its next best use—whether that’s cash crops, beef, or development—on your timeline, not the bank’s.
A strategic exit isn’t a failure; it’s a calculated decision to stop milking cows so you can start protecting the family’s future.
5. Does your regional strategy match the curve you’re actually in?
Processor access, hauling distance, water rules, land markets, and labour conditions shape how the curve feels locally. A 200‑cow freestall near several plants in southern Ontario lives in a different structural world than a 200‑cow herd in northern Vermont or a 3,000‑cow dry lot in west Texas.
The Bullvine Curve is a map, not a script; the job is to locate your farm on that map honestly—by size, cost, region, and succession—and then build a plan that fits the structure you’re heading into, not the one you remember.
The Bullvine Bottom Line: forecasts as a tool, not a headline
The consolidation trend itself isn’t up for debate anymore; the 2022 Census of Agriculture, USDA ERS work, and AAFC’s Dairy Sector Profile all tell the same story of fewer herds, more milk, and more of that milk coming from larger operations. What the Bullvine Dairy Curve adds is a clear, named set of paths—15,000–16,000 vs <10,000 U.S. herds, 6,500–7,000 vs 4,000–5,000 Canadian herds—and a practical way to turn those numbers into decisions about cost structure, technology, and succession while there’s still time to move.
The data strongly suggest there will be fewer dairy farms in 2050 than there are today; they do not say which farms those will be. That part is still being written—day by day, barn by barn—and the whole point of the Bullvine forecast is to help you write your own line on the curve instead of letting the averages write it for you.
KEY TAKEAWAYS
- 15,000 U.S. farms by 2035. Under 10,000 by 2050. Where do you land? The Bullvine Dairy Curve extends the 4% annual decline documented by the USDA from 2002 to 2019. Canada tracks toward 6,500–7,000 farms by 2035 and 4,000–5,000 by 2050. These aren’t worst-case guesses—they’re the middle of the road.
- Milk isn’t disappearing—it’s moving into bigger barns. The 2,500+ cow herd class is the only one that grew between 2017 and 2022. Processors are building $11B in new capacity around these mega-suppliers, not 300-cow herds.
- The $100k squeeze hits mid-size hardest. Many 150–500 cow commodity herds running “average” costs incur $75,000–$100,000 in structural losses per year. Stay average, and you’re betting against the curve.
- Three paths remain—pick one. Scale toward 1,000+ cows with genuinely competitive cost per cwt, specialize into premium markets that pay on margin, or execute a strategic exit while equity is intact. Not choosing lets the curve choose for you.
- Succession decides who’s still milking in 2035. A 65-year-old with no successor is more likely to exit than a smaller herd where a 35-year-old already leads. Put the timeline on paper now—”someday” isn’t a plan.
Executive Summary:
By 2035, the Bullvine Dairy Curve has U.S. dairy farms shrinking from roughly 25,000 herds today to 15,000–16,000, and to well under 10,000 by 2050. That’s what happens if the long‑run 4% annual decline identified by USDA’s Economic Research Service continues. In Canada, AAFC’s Dairy Sector Profile and Bullvine’s modelling show a slower but similar slide from 12,007 farms in 2014 to 9,256 in 2024, heading toward roughly 6,500–7,000 farms by 2035 and 4,000–5,000 by 2050—even as national milk output climbed about 23%, from 78.3 to 96.6 million hectolitres. Across all three paths—business‑as‑usual, a faster shakeout, or a more managed transition—the litres don’t disappear; they concentrate into larger freestall and dry‑lot systems as processors, and lenders channel more volume to 1,000‑plus‑cow herds with lower cost per cwt. That structural shift leaves many 150–500 cow commodity herds that sit “average” on cost and fully exposed to commodity pricing, facing $75,000–$100,000 a year in structural losses, unless they either scale, specialize into premium/value‑add markets, or plan a strategic exit while equity is still strong. This article turns the Bullvine Dairy Curve into a five‑question barn‑level playbook—covering lane choice, true cost per cwt, tech and barn investments, succession, and regional realities—so you can decide whether your operation will be one of the 15,000 still milking by choice in 2035 and beyond, or one of the herds the curve quietly averages out.
About the Bullvine Dairy Curve Model
The Bullvine Dairy Curve is an analytical framework—not an official government forecast—built by extending documented historical trends into scenario-based projections. The U.S. baseline draws on USDA’s 2017 and 2022 Census of Agriculture (39,303 farms → 24,094 farms) and USDA Economic Research Service report ERR-274, Consolidation in U.S. Dairy Farming, which documented a roughly 4% annual decline in licensed herds from 2002–2019 alongside rising national production and increasing concentration in larger operations. The Canadian baseline uses Agriculture and Agri-Food Canada’s Dairy Sector Profile, which tracks farm numbers from 12,007 in 2014 to 9,256 in 2024 (approximately 2.6% annual decline) under supply management. Rather than a single-point prediction, the Bullvine Dairy Curve presents three scenario paths: a business-as-usual path that extends historical decline rates, a faster consolidation path that accounts for accelerating pressures (labor constraints, compliance costs, alternative proteins, and margin compression), and a managed transition path where disciplined use of margin tools, capital decisions, and succession planning slow effective exit rates. All projections assume continued structural concentration—consistent with Census data showing the 2,500+ cow herd class as the only size category that grew between 2017 and 2022—and are intended as planning tools for producers, lenders, and advisors rather than definitive forecasts.
Complete references and supporting documentation are available upon request by contacting the editorial team at editor@thebullvine.com.
Learn More
- Profit and Planning: 5 Key Trends Shaping Dairy Farms in 2025 – Arms you with critical benchmarks—like the 1.4 feed efficiency ratio—to stop cash flow leaks today. You’ll gain a tactical roadmap for cleaning balance sheets and securing contracts before the next market recalibration shifts the goalposts.
- Cheap Milk Is Breaking the Farm: What’s Really Hollowing Out Dairy’s Middle Class – Reveals the structural vise squeezing mid-size dairies and explains why traditional efficiency isn’t enough to survive. You’ll gain a clear-eyed analysis of the business models available for those caught between niche premiums and massive scale.
- Revolutionizing Dairy Farming: How AI, Robotics, and Blockchain Are Shaping the Future of Agriculture in 2025 – Weaponizes your grandfather’s breeder’s eye with AI-powered genetics and robotics to fundamentally rewrite the rules of the milk house. You’ll gain a 99.8% precision advantage in disease detection and transform your herd into a high-leverage profit engine.
 Join the Revolution!
 Join the Revolution!
Join over 30,000 successful dairy professionals who rely on Bullvine Weekly for their competitive edge. Delivered directly to your inbox each week, our exclusive industry insights help you make smarter decisions while saving precious hours every week. Never miss critical updates on milk production trends, breakthrough technologies, and profit-boosting strategies that top producers are already implementing. Subscribe now to transform your dairy operation’s efficiency and profitability—your future success is just one click away.


