


When $14 milk becomes the new normal, efficiency alone won’t save you. Discover three dairy models built for the market ahead
Executive Summary: The North American dairy sector is facing a reckoning as production increases, exports decline, and processing capacity surpasses consumer demand. According to the USDA, Chinese imports have fallen nearly 50 percent since 2021, while the IDFA notes $11 billion in new U.S. plant investment through 2027. This has led to Class III milk prices lingering around $14 per hundredweight for extended periods. Producers who adapt most effectively are not necessarily those working harder but those managing smarter: large farms are focusing on water resilience, smaller operations are developing their own brands, and mid-size herds are diversifying into beef and energy. Even Canada’s supply-managed system is feeling pressure as CUSMA provisions allow cheaper U.S. dairy components to enter the country. The key question for every dairy leader is whether their operation is prepared to survive by strategic management rather than relying solely on scale.

If you’ve noticed an edge in conversations at meetings or the feed store lately, you’re not imagining it. The industry’s uneasy. Sure, milk prices fall and climb like they always do—but what we’re facing heading into 2026 feels different. What’s interesting is that this shift isn’t about a single bad year. It’s structural.
The data coming from USDA’s Foreign Agricultural Service, CoBank’s Dairy Outlook, Texas A&M AgriLife Research, and Cornell PRO‑DAIRY all paint a similar picture: we’ve built a milk production system that’s outpaced the market’s ability to absorb it. The overcapacity problem isn’t just an economic story—it’s become an operational one.
But here’s what’s encouraging: the farms reading the signals now will still be standing when the next upturn comes. Let’s break down what’s driving this reset and, more importantly, what dairies can do about it.
Exports: When America’s Safety Valve Starts Closing
For years, exports balanced our market, but that pressure valve is tightening. According to the USDA’s foreign trade data, China’s dairy imports dropped nearly 50 percent from 2021 to 2024. That’s not a blip. It’s largely the result of New Zealand’s complete tariff elimination on dairy through its free trade agreement with China, finalized in 2024. New Zealand now supplies close to half of China’s imported milk powder.

Mexico remains the anchor buyer—taking roughly 25 percent of U.S. dairy exports—but the country’s government has already committed more than $4 billion to reduce that dependency by 2030 through feed, processing, and genetic improvements (USDA FAS Mexico). It’s a reminder that even friendly trade partners are prioritizing domestic capacity.
Domestically, per‑capita dairy consumption has hovered around 650 pounds for half a decade (USDA ERS). Cheese and butter continue inching upward, but fluid milk keeps sliding. Meanwhile, IDFA projects $11 billion in new processing capacity—mostly cheese and powder—coming online through 2027. Taken together, it means more milk will be chasing fewer high‑value markets.
It’s why UW–Madison economist Mark Stephenson expects Class III milk to linger near $14 for much of 2026 unless production adjusts. That’s tough news for balance sheets built on $18 milk assumptions.
| Metric | Value | Trend |
|---|---|---|
| % US Milk from <700 Herds | 70% | Rising |
| H5N1 Production Loss (Some Herds) | 25% | Event Risk |
| Herds Lost per Year (est) | 2-3% | Accelerating |
| Average Herd Size Growth | 3-5%/yr | Continuing |
When Efficiency Turns on You
We’ve spent a generation tightening feed efficiency, refining fresh‑cow management, and maximizing butterfat performance. But when every operation does it at once, collective output outpaces demand. Stephenson’s work shows exactly that: efficiency saves individual farms but extends low‑price cycles industry‑wide.
CoBank’s 2025 outlook says lenders have started factoring this reality into their models, advising clients to treat $14–$15 milk as a planning baseline. They’re less interested in herd size and more in liquidity and diversification—two words that used to sound cautious but now mean survival.
It’s worth noting that some operations are already adapting faster than expected. Instead of ramping production, they’re building buffer zones—feed inventories, beef programs, or renewable energy income—that buy time when markets slump. That’s a quiet, practical form of resilience.
Three Business Models Leading the Next Era
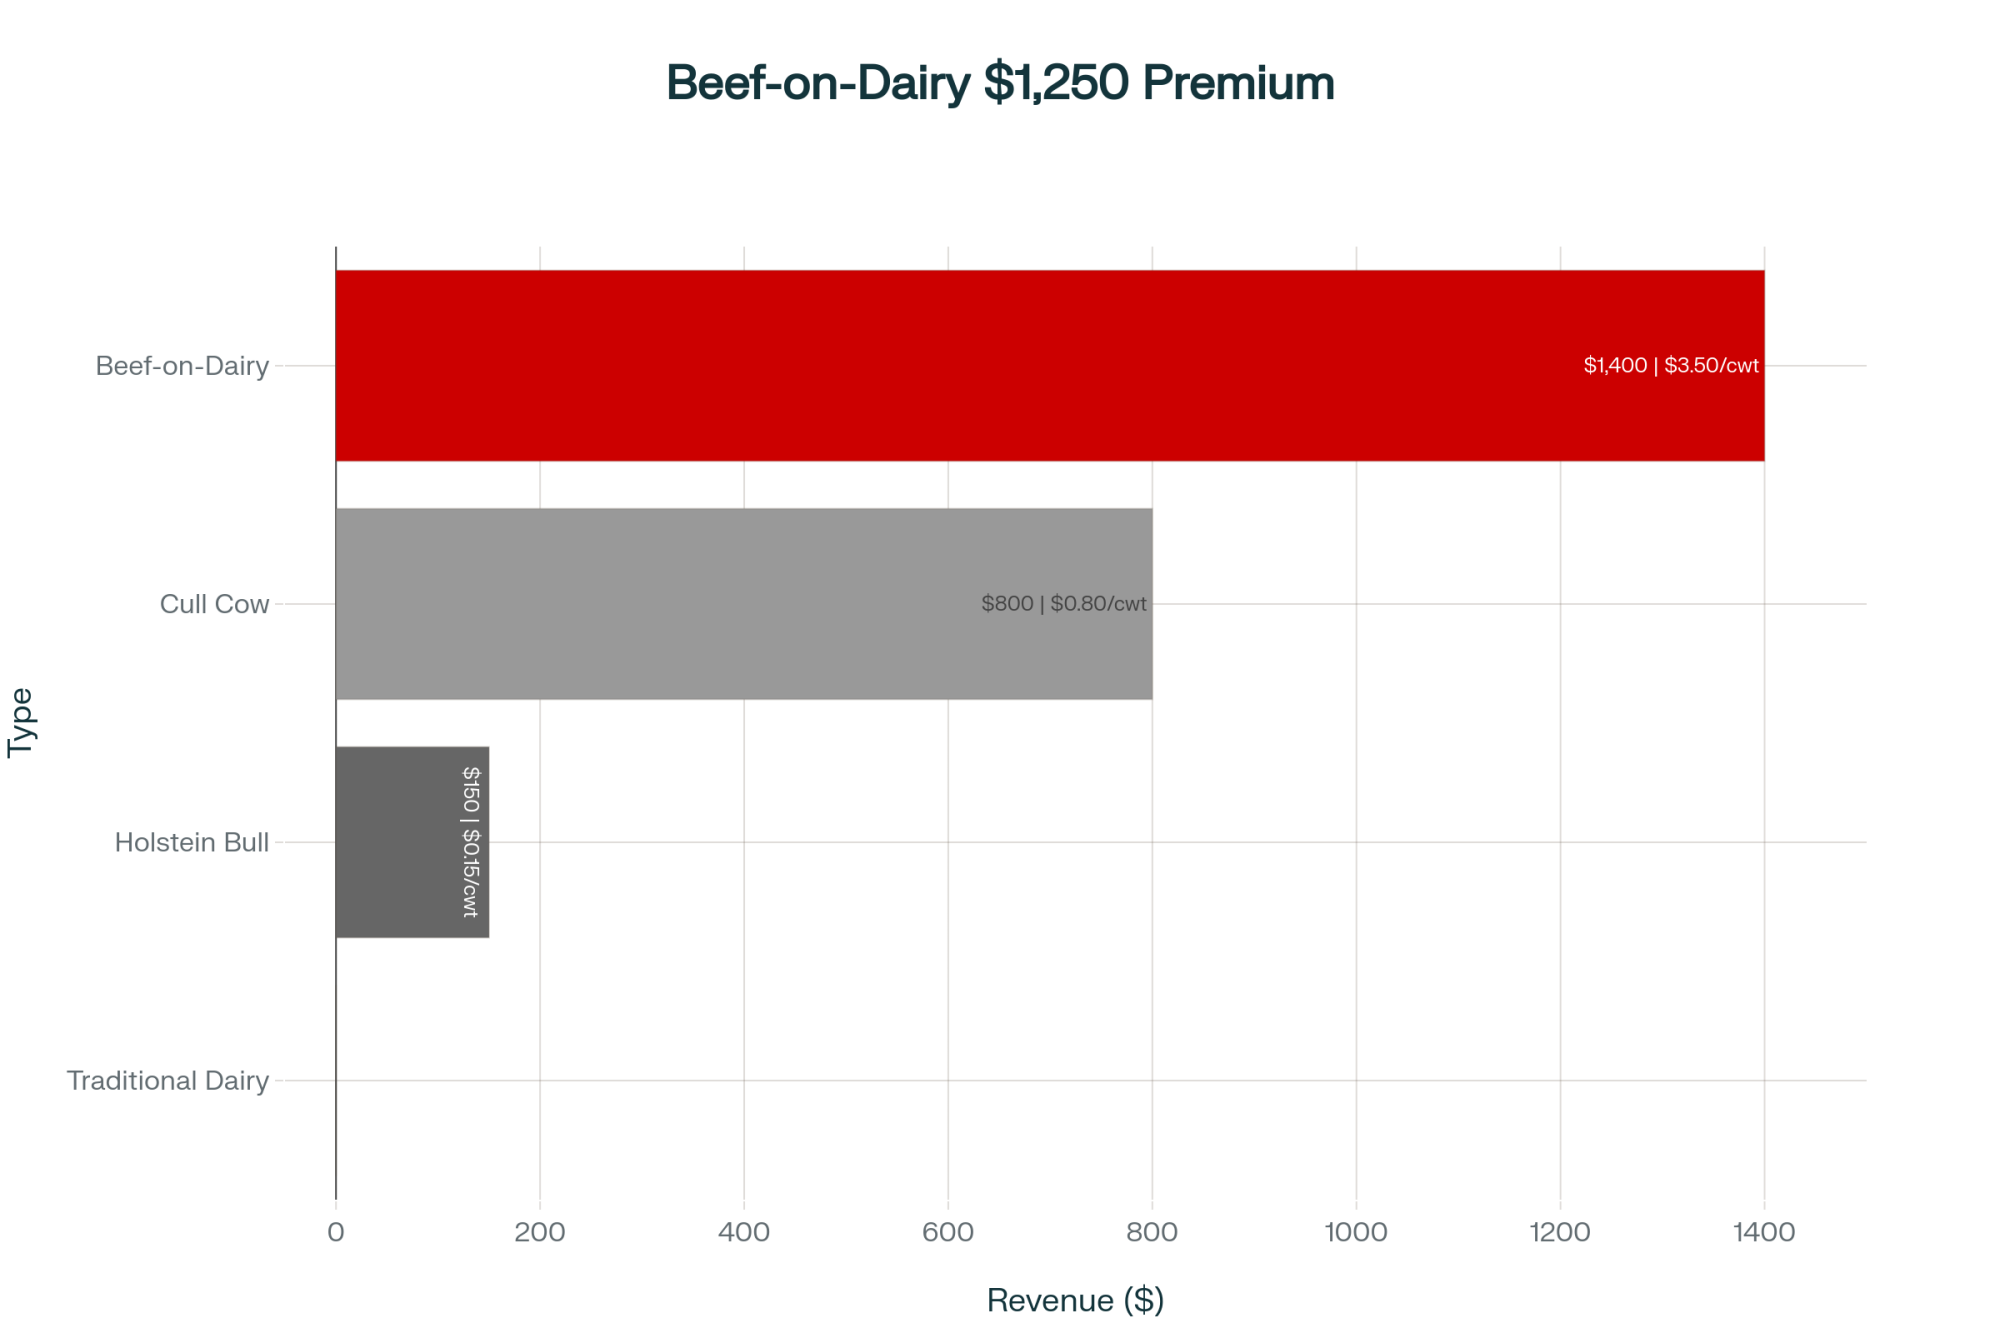
| Revenue Source | Value per Head | Additional Revenue per cwt |
|---|---|---|
| Beef-on-Dairy Calf | 1400 | 3.5 |
| Holstein Bull Calf | 150 | 0.15 |
| Cull Cow (reduced) | 800 | 0.8 |
| Traditional Dairy Only | 0 | 0.0 |
Looking around North America, I see three dairy models redefining success—and interestingly, none of them depend solely on volume.
1. Scale with Resource Discipline
Large dairies (2,500 cows and up) still enjoy supply‑chain leverage and efficient overheads, keeping costs near $13–$14 per cwt. But as Texas A&M AgriLife has documented, Ogallala Aquifer drawdowns of several feet per year are already limiting western expansion. Efficient dry lot systems still hinge on water, not on technology. The winners in this space will be those securing long‑term water rights and investing in traceable sustainability systems that gain processor preference.
2. Premium Differentiators
Smaller operations in Wisconsin, Vermont, and New York are thriving by selling distinctiveness. The Dairy Business Innovation Alliance granted $27 million last year to help farmers launch on‑farm processing or branded lines. Cornell’s marketing research shows that these operations can gross nearly twice the revenue per gallon of bulk milk, even after accounting for labor and packaging. It’s not an easy switch—but it’s proof that price control still exists for those who own their story.
3. Diversified Mid‑Tier Enterprises
Mid‑sized farms (400–1,000 head) are finding stability through hybrids: beef‑on‑dairy programs, digesters, custom fieldwork, and even agritourism. USDA AMS reports cross calves averaging $1,300–$1,500—steady income that doesn’t depend on milk checks. A producer in western New York summed it up well: “We stopped trying to be the biggest and started aiming to be the most stable.” That’s the pivot shaping 2028’s survivors.
| Business Model | Large-Scale (2,500+ cows) | Premium Direct (Small-Mid) | Diversified (400-1,000 cows) |
| Cost per cwt | $18.50 | $22.00 | $20.25 |
| Revenue per gallon | $3.20 | $5.50 | $4.10 |
| Key Advantage | Economies of scale | Premium pricing | Risk spread |
| Key Risk | Capital intensive | Market dependent | Complex mgmt |
| 2026 Viability | Strong | Moderate | Good |
Regional Realities to Watch
Southwest: Managing Heat and Water
The Southwest’s production advantage is shrinking under the pressure of climate change. NOAA data shows that regional summer highs have increased by nearly 2°F since 2005. Sustained 105°F temperatures drop butterfat 0.25 points and drag conception rates 10–15 percent. Cooling systems can recover performance but raise feed and energy costs—a balance every dry lot system must now manage deliberately.
Midwest: Cooperatives Reinventing Identity
In the Upper Midwest, co‑ops aren’t just merging for size—they’re merging for marketing power. By uniting under shared premium labels, regional processors can command higher prices while keeping milk local. “Made in Wisconsin” and “Minnesota Heritage” brands are now marketing assets that translate directly into net returns.
Northeast: Proximity to the Plate
Closer to metro areas, direct bottlers and farmstead processors are rewriting the economics of small dairies. Cornell Extension documents farms earning $4.50–$5 per gallon retail versus roughly $2.00 through commodity channels. The tradeoff? Long hours, daily distribution. But for these herds, proximity beats volume.
| Region | Primary_Challenge | Temp_Increase | Butterfat_Impact | Strategic_Response | 2026_Outlook |
|---|---|---|---|---|---|
| Southwest | Water + Heat Stress | 2°F since 2005 | -0.25 pts at 105°F | Water rights + cooling | Constrained growth |
| Midwest | Co-op Consolidation | Moderate | Minimal | Premium brands | Consolidation continues |
| Northeast | Competition + Labor | Moderate | Minimal | Direct retail + proximity | Niche strength |
Consolidation Without Cushion
Here’s what concerns many analysts, myself included. USDA ERS data shows 70 percent of U.S. milk now comes from fewer than 700 herds. Economies of scale made U.S. dairy globally competitive, but that concentration also magnifies disruption.
When USDA APHIS chronicled this year’s H5N1 outbreaks, some mega‑herds lost a quarter of production temporarily. A single event like that can ripple nationwide when production is so consolidated. Efficiency has been our calling card—but efficiency without redundancy is a structural risk.
Policy Reality: The Market Leads
Don’t hold your breath for government rescue via supply management. Lawmakers shelved those proposals years ago, and the odds of revival are slim. The playing field instead relies on program updates like Dairy Margin Coverage and Dairy Revenue Protection.
Some cooperatives are experimenting with “soft cap” base systems that reward milk sold inside quotas while reducing incentives for extra volume. As Cornell’s Ch is Wo f explains, production discipline rarely starts in Congress—it begins when lenders align credit with profitability, not throughput.
Canada’s Connection Under CUSMA
For Canadian producers, this U.S. reset carries ripple effects. Under CUSMA/USMCA, American exporters filled about 42 percent of tariff‑rate quota (TRQ) volumes in 2024 (USDA GATS). If U.S. milk stays cheap, industrial users north of the border could see downward price pressure on powders, even within supply management.
On the flip side, cheesemakers importing U.S. components might gain a cost advantage. It shows how intertwined our systems have become: Canada’s quota stability protects producers, but processors share exposure to North American market cycles.
A 90‑Day Plan for Staying Liquid
- Stress‑Test Your Numbers.
Model 18 months of $14 milk , including all liabilities: feed, debt, family living, and depreciation. Knowing the breakeven point beats guessing. - Six Months of Liquidity.
Whether feed, credit, or cash reserves, that’s now the lender’s preferred benchmark. It buys you choices when margins vanish. - Diversify Intentionally.
Beef‑on‑dairy returns, renewable‑energy partnerships, or manure composting programs provide steady non‑milk income and nitrogen‑value recycling. - Align Your Advisors.
Bring your lender, accountant, and co‑op rep to one table. Coordinated strategy beats reaction every time.
What Success Will Look Like by 2028
| Metric | Vulnerable | At_Risk | Resilient |
|---|---|---|---|
| Debt-to-Asset Ratio | >35% | 25-35% | <25% |
| Non-Milk Income % | <10% | 10-20% | 25-30% |
| Liquidity Reserve | <3 months | 3-4 months | 6+ months |
| Breakeven Price | >$16/cwt | $14-16/cwt | <$14/cwt |
| Risk Level | HIGH | MEDIUM | LOW |
The most resilient operations typically maintain debt-to-asset ratios below 25 percent, generate 25 to 30 percent of their income from sources other than milk, and use integrated data systems that connect cow performance with overall cash flow.
A Pennsylvania producer told a USDA panel recently, “We stopped calling ourselves milk producers—we’re opportunity managers who milk cows.” That’s optimism shaped by hard truth—and it’s probably the right mindset for the next cycle.
The Bottom Line: Strategy Outlasts Size
The next few years won’t favor the farms that produce the most milk, but rather the ones that manage risk best. Markets—just like herds—reward adaptation more than brute strength.
What’s encouraging is that dairy already has the tools necessary for a successful transition, including precision nutrition, component payouts, renewable energy credits, co-op innovation, and data integration. The real challenge lies in timing—taking action now while there is still an opportunity. By leveraging these resources and making proactive decisions, dairy producers can position themselves to thrive in a changing market, ensuring their operations remain resilient and adaptable for the future.
History shows that producers who adapt quickly are the ones who shape the future of the industry. While the upcoming transition may be challenging, it also presents a valuable chance to build a dairy sector that is more efficient, knowledgeable, and prepared for whatever changes the market may bring.
Key Takeaways
- Dairy’s next chapter starts with a reset: rising production, shrinking exports, and processing capacity that’s outgrown demand.
- Producers can’t count on price rebounds—planning for $14 milk means focusing on liquidity, strategy, and controlled risk.
- The farms built to last aren’t the biggest—they’re the smartest at diversifying their income streams.
- From Texas dry lots to Midwestern co-ops, success means pivoting from efficiency to adaptability.
- Even Canada feels the ripple as CUSMA imports pressure processors and test supply management’s limits.
Complete references and supporting documentation are available upon request by contacting the editorial team at editor@thebullvine.com.
Learn More:
- 2025 Dairy Market Reality Check: Why Everything You Think You Know About This Year’s Outlook is Wrong– This essential analysis unpacks the complex economic forces driving the market reset. It provides strategies for navigating policy changes and capitalizing on the industry’s fundamental shift from rewarding milk volume to rewarding high-value components like butterfat and protein.
- ICE Raids Resume: Why Dairy’s $48 Billion Labor Crisis Exposes Our Innovation Failure – This article makes a compelling financial case for automation as a strategic necessity. It demonstrates how robotic milking and AI-powered herd management deliver clear ROI by solving the labor crisis, increasing efficiency, and building a more resilient dairy operation.
- Beef-on-Dairy in 2025: Turning Calf Premiums into Real Profit (Without Blowing Up Your Herd) – This piece provides a tactical blueprint for maximizing a beef-on-dairy program, one of the key diversification models. It reveals methods for using genetic data and building feedlot partnerships to transform a secondary income source into a primary profit center.
 The Sunday Read Dairy Professionals Don’t Skip.
 The Sunday Read Dairy Professionals Don’t Skip.
Every week, thousands of producers, breeders, and industry insiders open Bullvine Weekly for genetics insights, market shifts, and profit strategies they won’t find anywhere else. One email. Five minutes. Smarter decisions all week.


