


Processing capacity explodes while producer equity stays locked for decades—who really benefits from co-op investments?
EXECUTIVE SUMMARY: What farmers are discovering through recent IDFA data is a fundamental disconnect between processing prosperity and producer profitability—$11 billion in new dairy processing investments across 19 states through 2028, yet milk checks continue facing downward pressure from increased make allowances that took effect June 1. The numbers tell the story: New York leads with $2.8 billion in processing investment, Texas adds $1.5 billion, and Wisconsin contributes another $1.1 billion, while the new FMMO makes allowances that reduce farm milk prices by $0.2519 per pound of cheese and similar amounts across other products. Here’s what this means for your operation: December 1 brings new skim milk composition factors that jump protein baselines from 3.1% to 3.3% and other solids from 5.9% to 6.0%—farms below these levels face penalties while those exceeding them capture premiums worth $8,640 annually for a typical 200-cow herd. Recent research from the National Milk Producers Federation indicates that coordinated producer action has achieved meaningful FMMO reform; however, participation in cooperative governance remains critically low, limiting producer influence over billion-dollar investment decisions funded by member equity. Looking ahead, farms that optimize components before December, understand their complete economic picture, including equity positions, and actively engage with their marketing organizations will be best positioned to navigate this widening gap between processing investment and producer returns.

When the International Dairy Foods Association announced its plans for $11 billion in dairy processing investments across 19 states on October 1st, it sparked conversations from coast to coast. Producers are grappling with a fundamental disconnect—massive capital is flowing into processing facilities, while milk checks remain under pressure.
Looking at the numbers from IDFA, we’re talking about more than 50 individual building projects between now and early 2028. New York leads with $2.8 billion, Texas follows at $1.5 billion, and Wisconsin adds another $1.1 billion in processing capacity. That’s real investment—the kind that should signal opportunity. Yet many of us are dealing with prices that tell a different story entirely.
Quick Reference: Key Dates & Numbers
December 1, 2025: New FMMO skim milk composition factors take effect
- Protein baseline increases: 3.1% → 3.3%
- Other solids baseline increases: 5.9% → 6.0%
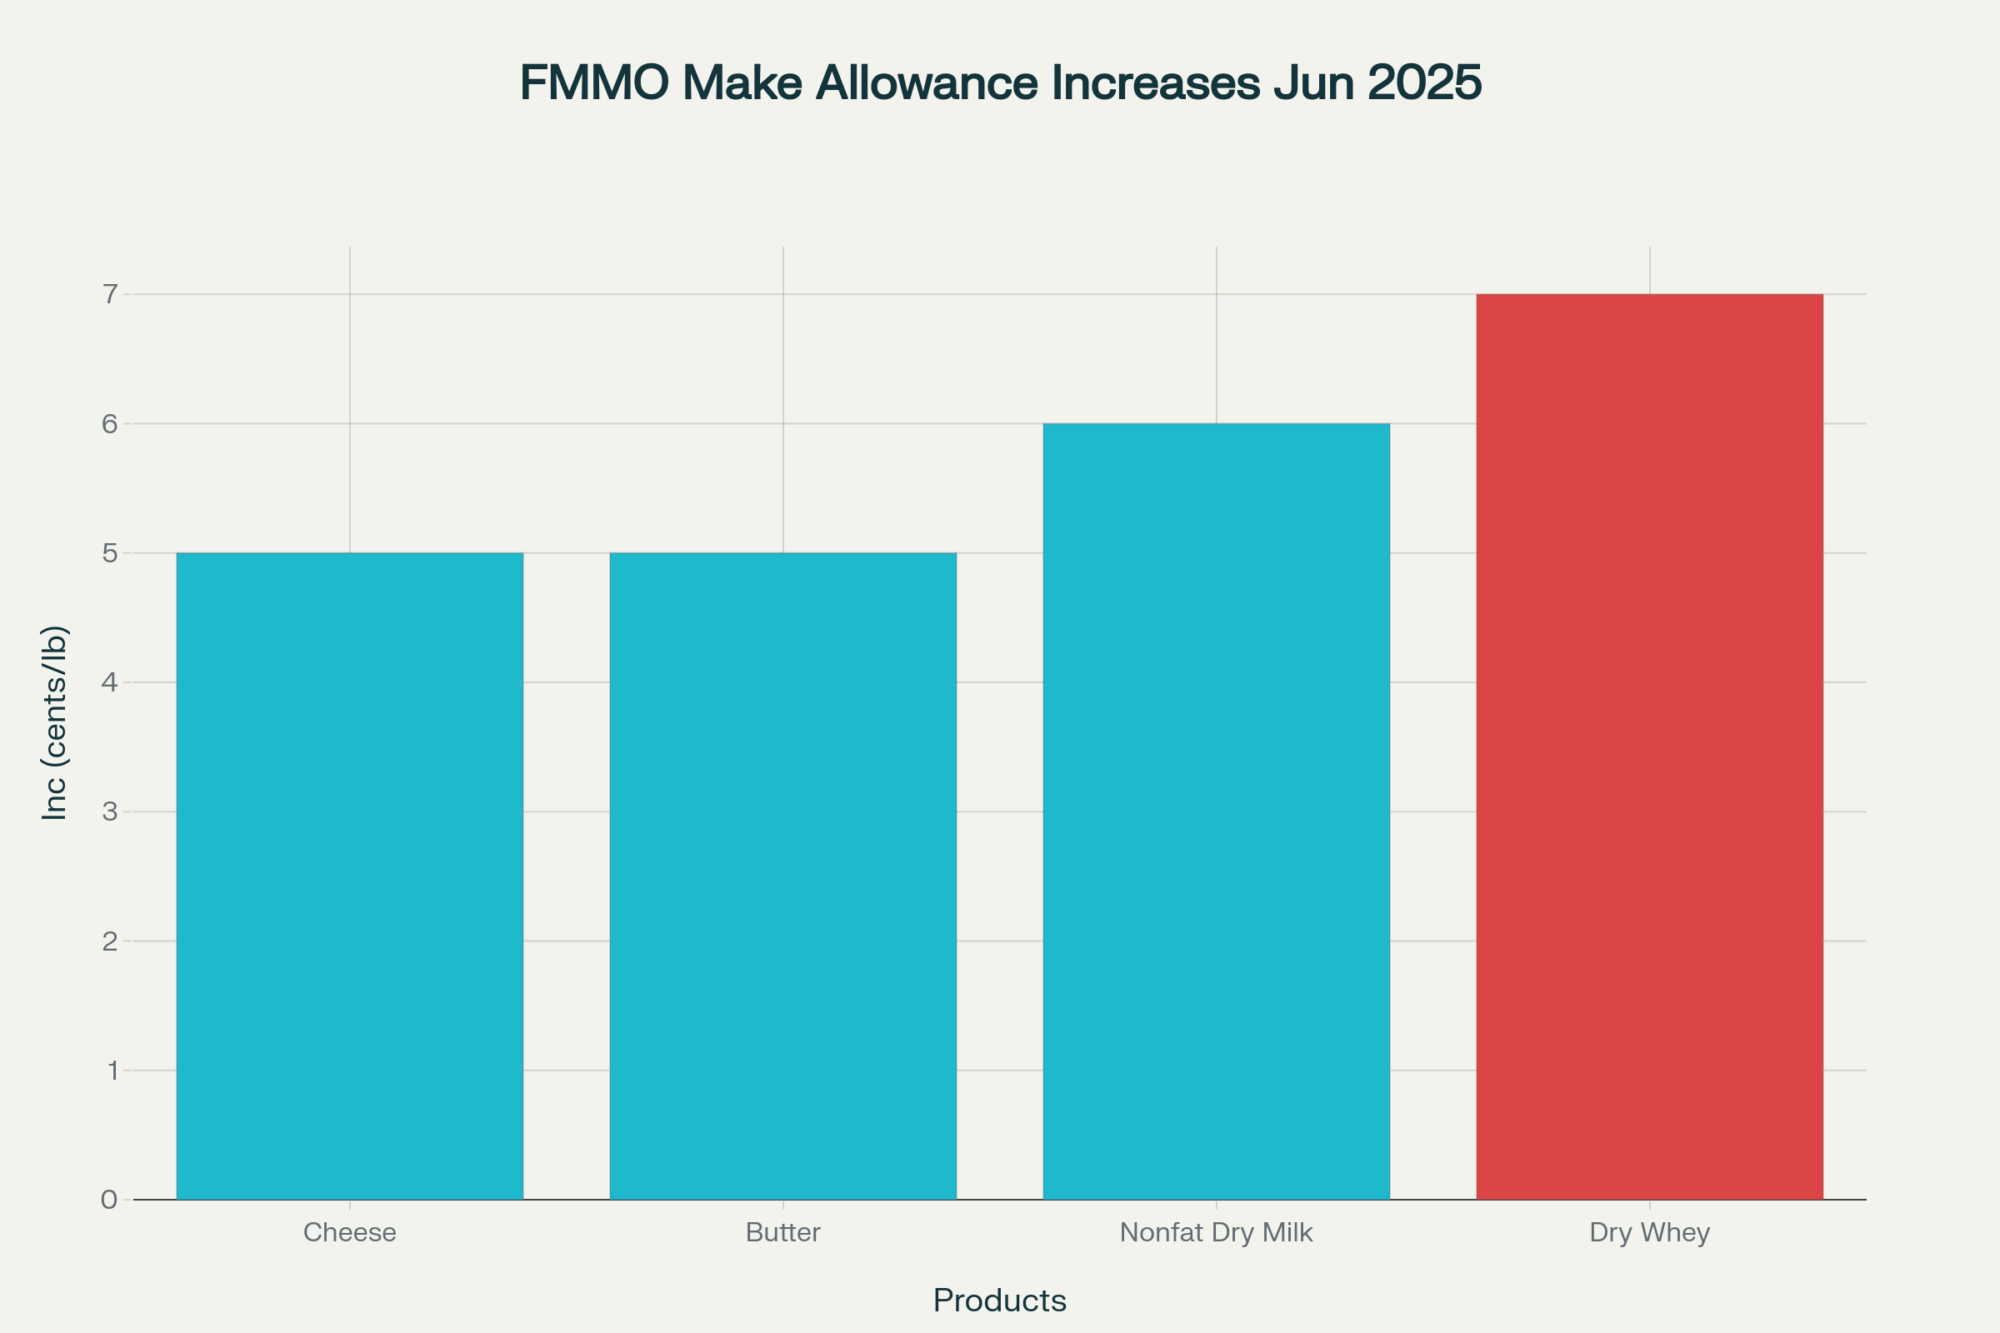
June 1, 2025: FMMO makes allowance changes implemented
- Cheese: $0.2519/lb
- Dry whey: $0.2668/lb
- Butter: $0.2272/lb
- Nonfat dry milk: $0.2393/lb
Processing Investment by State:
- New York: $2.8 billion
- Texas: $1.5 billion
- Wisconsin: $1.1 billion
- Idaho: $720 million
Understanding the Processing Boom
Michael Dykes, IDFA President and CEO, shared in their October announcement that the industry expects U.S. milk production to grow by 15 billion pounds by 2030. That’s what’s driving this expansion—cheese plants alone account for $3.2 billion of the investment, with milk and cream facilities adding another $2.97 billion.

What’s particularly interesting is how this investment concentrates geographically. When New York sees $2.8 billion in processing investment, that fundamentally reshapes milk movement patterns for the entire Northeast. Producers in Pennsylvania and Vermont will feel those ripples. Texas, with its $1.5 billion investment, creates new dynamics in a region that has been expanding dairy production for years—from the Panhandle down to Central Texas. Idaho’s receiving $720 million, which affects not just Idaho producers but also those in Eastern Oregon and Northern Utah.
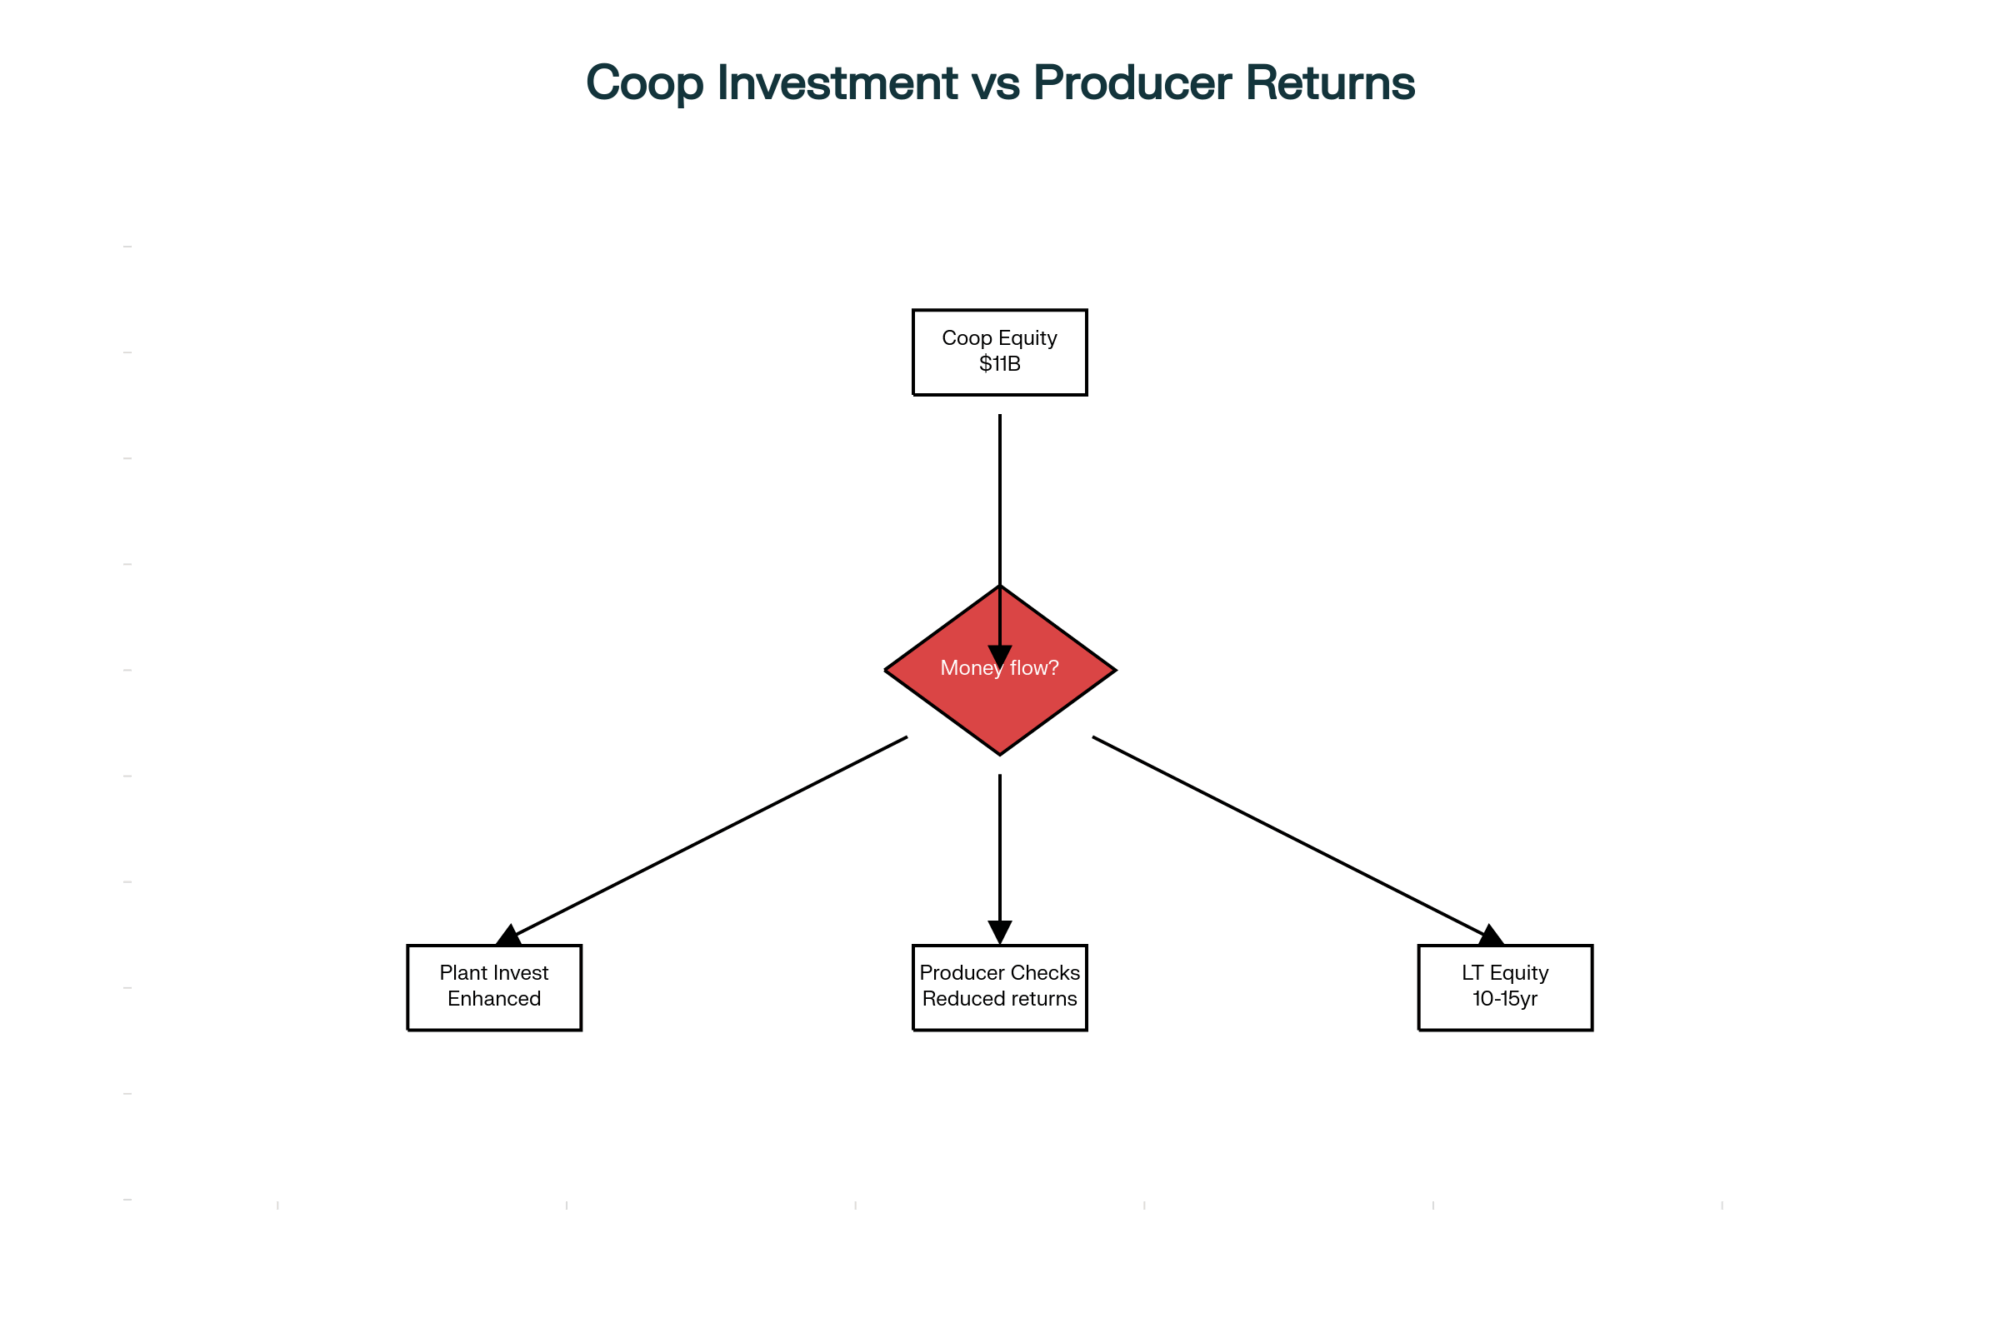
Here’s what gets me thinking: when cooperatives build these facilities, that capital comes from somewhere—typically retained earnings and member equity. We’re essentially wearing two hats, as milk suppliers and infrastructure investors. But the returns on that investment? They often take forms that don’t help today’s cash flow. It’s our money working in the system, but not necessarily working for us in the short term.
The Make Allowance Reality Check
The new Federal Milk Marketing Order reforms, which took effect on June 1, 2025, represent the most comprehensive overhaul in over two decades. According to the USDA’s announcement and as confirmed by the National Milk Producers Federation, these changes include significant updates to make allowances—those deductions from commodity prices that guarantee processor margins before calculating what producers receive.
Here’s how the math works: USDA takes the commodity price—say cheese—then subtracts the make allowance before determining our milk price. The new rates, which took effect on June 1, increased to $0.2519 for cheese (up from previous levels), $0.2668 for dry whey, $0.2272 for butter, and $0.2393 for nonfat dry milk. When these allowances increase, our prices decrease, regardless of the strength of the commodity market.
Gregg Doud, NMPF President and CEO, acknowledged after the reforms passed that “this final plan will provide a firmer footing and fairer milk pricing.” However, he also noted that NMPF continues to push for mandatory plant-cost studies to inform future better make allowance discussions. Why? Because the current process relies on voluntary cost surveys from processing plants, and participation varies considerably.
These aren’t just numbers on paper—they directly impact cash flow on every farm shipping milk. For producers managing volatile feed costs and labor challenges, understanding these deductions becomes essential for financial planning. The Difference between what consumers pay for dairy products and what we receive for milk keeps widening, and make allowances are a key part of that equation.
The Component Revolution Nobody’s Talking About
Now here’s where things get really interesting for those of us focused on milk quality. The USDA’s final FMMO rule includes new skim milk composition factors, which take effect on December 1, 2025. The baseline assumptions jump from 3.1% protein to 3.3%, and other solids increase from 5.9% to 6.0%.
Let me walk through what this means with real numbers—and trust me, this matters more than you might think.

Component Payment Scenarios: Before and After December 1
| Milk Quality Level | Current System Payment | After December 1 Payment | Annual Difference (200-cow herd) |
| Below Average (3.0% protein, 5.8% other solids) | Baseline | -$0.15/cwt penalty | -$7,500 |
| Average (3.1% protein, 5.9% other solids) | Baseline | -$0.08/cwt penalty | -$4,000 |
| Above Average (3.4% protein, 6.2% other solids) | +$0.12/cwt premium | +$0.28/cwt premium | +$8,000 |
On 100,000 pounds of milk monthly, moving from 3.1% to 3.4% protein means an extra 300 pounds of protein. With CME Class III futures for October 2025 trading around $18.81 per hundredweight, and protein contributing roughly $2.40 per pound to that value, we’re talking about $720 more per month—$8,640 annually—just from that protein improvement.
What’s encouraging is that many operations have already been moving in this direction. Through focused breeding programs that select for specific components, optimized nutrition management, and improved cow comfort, farms across the country are consistently achieving these higher levels of performance. The December changes will reward those investments.
Regional Dynamics: How This Plays Out Across the Country
The economics of hauling milk have undergone significant shifts over the past few years. With diesel prices volatile and the American Trucking Association reporting ongoing driver shortages, geography matters more than ever.
In the Upper Midwest (Wisconsin, Minnesota, Northern Iowa), where multiple processors compete for milk, we’re seeing different dynamics than in regions dominated by a single plant. Competition can create premium opportunities—but only if you’re positioned to take advantage. Smaller operations near county lines where two co-ops overlap have leverage. Those in the middle of a single co-op’s territory? Not so much.
The Southwest (Texas, New Mexico, Arizona) presents a different picture entirely. That $1.5 billion Texas investment creates new capacity in a region where dairies are larger on average—many over 2,000 cows. These operations have different leverage points than a 150-cow farm in Vermont. Scale matters, and we need to be honest about it.
The Southeast (Georgia, Florida, South Carolina) faces unique challenges. Limited processing options, longer haul distances, and heat stress affecting components all factor in. A producer in South Georgia might be 200 miles from the nearest plant—that changes everything about their economics.
California and the West continue their own evolution. With environmental regulations, water concerns, and some of the nation’s largest herds, the dynamics there don’t translate easily to other regions. What works for a 5,000-cow operation in the Central Valley won’t work for most of us.
Cooperative Governance: The Participation Problem
Michael Dykes from IDFA has noted the ongoing consolidation across the industry. That consolidation affects how cooperatives operate and how producer voices get heard in decision-making.
The democratic principles underlying cooperatives assume active member participation. But reality often looks different. Financial presentations can be dense—I’ve sat through three-hour annual meetings where the financials took 20 minutes to present and nobody had time to digest them. Meeting locations might require significant travel. Timing often conflicts with critical farm operations.
This participation gap has real consequences. When only a fraction of members actively engage, investment decisions involving millions of dollars in member equity may be approved by a small percentage of those whose capital is at stake.
The National Milk Producers Federation has been working to address these challenges through their modernization efforts. After more than 200 meetings to formulate their FMMO proposals, they’ve shown what coordinated producer action can achieve. However, that level of engagement remains the exception rather than the rule at the individual cooperative level.
Some cooperatives are experimenting with digital participation options and regional listening sessions. Land O’Lakes started streaming their annual meeting. DFA holds regional forums. These are positive steps, though changing institutional culture takes time. The question is whether traditional governance structures can evolve fast enough to maintain relevance for modern dairy operations.
Component Improvement Checklist
Before December 1:
- Test current butterfat, protein, and other solids levels
- Calculate the potential impact of new baselines on your milk check
- Review genetics—are you selecting for components?
- Evaluate the ration with a nutritionist for component optimization
Ongoing Management:
- Monitor individual cow components through DHIA testing
- Focus on transition cow management (affects entire lactation)
- Maintain consistent feed quality and delivery
- Optimize cow comfort (stressed cows produce lower components)
- Consider breed composition (Jersey influence can boost components)
Alternative Strategies Emerging
What’s encouraging is the diversity of approaches producers are exploring. Direct relationships with processors can offer customized pricing structures, provided they are accompanied by consistent volume and quality. Several operations I know have negotiated premiums ranging from modest to substantial per hundredweight above standard cooperative prices.
The organic market continues showing strength despite its challenges. USDA data from February 2025 shows Mexico and Canada imported a record $3.61 billion in U.S. dairy products in 2024, with organic products capturing premium positions in these markets. For operations that can manage the three-year transition and meet certification requirements, the economics can work—but it’s about more than just the premium. It requires finding reliable buyers and adapting your entire management system.
Value-added processing represents another path. Small-scale cheese operations, bottling facilities, even yogurt production—the margins can be compelling for artisan products. However, it requires capital, regulatory expertise, and market development skills that extend far beyond traditional dairy farming. The folks succeeding here often started small, learned the market, then scaled based on actual demand rather than hoped-for sales.
The International Trade Wild Card
Here’s something that could change everything: trade relationships. According to IDFA’s February 2025 data, Mexico and Canada account for more than 40% of U.S. dairy exports, with Mexico importing a record $2.47 billion and Canada importing $1.14 billion in 2024. China and other Asian markets continue growing, too.
Matt Herrick, IDFA’s Executive Vice President and Chief Impact Officer, emphasized that industry growth “depends on strong trade relationships and access to essential ingredients, finished goods, packaging, and equipment.” With exports needing to absorb more production growth in the coming years, any disruption to these relationships could fundamentally alter supply-demand dynamics.

The current political climate adds uncertainty. Trade policy shifts could impact everything from cheese exports to whey protein concentrate markets. Producers need to consider these risks in their long-term planning. A cooperative heavily invested in export facilities might face different pressures than one focused on domestic markets. Understanding your milk buyer’s exposure to trade risks becomes part of evaluating your own risk profile.
Practical Steps for Today’s Environment
Given all this complexity, what should producers actually do?
First, calculate your complete economic picture before the December component changes take effect. Know your current component levels, understand how the new factors will affect your payments, and identify opportunities for improvement. The University of Wisconsin’s Center for Dairy Profitability, along with similar extension services, offers tools to assist with these calculations. Cornell’s PRO-DAIRY program has excellent resources. Penn State Extension runs workshops on this topic.
Second, build market intelligence even if you’re satisfied with current arrangements. Understand what others in your region are receiving. Know what alternative markets require. CME futures can give you insights into price trends—Class III futures for late 2025 are trading in the $18-19 range, suggesting some market stability ahead. But futures only tell part of the story.
Third, focus relentlessly on controllables. Component quality, especially with the new FMMO factors coming into effect on December 1, means that every tenth of a percent improvement in protein or other solids translates directly to revenue. Feed management, genetics, cow comfort—these fundamentals matter more than ever. That might sound basic, but I keep seeing operations leave money on the table by not optimizing what they can control.
Fourth, engage with your cooperative or marketing organization. The FMMO modernization process showed what coordinated producer action can achieve. Ask specific questions about how processing investments benefits members. Push for transparency about capital allocation. Your voice matters, but only when used. And if you can’t make meetings, find someone you trust who can represent your interests.
Resources for Immediate Action
Component Optimization:
- University of Wisconsin Center for Dairy Profitability: cdp.wisc.edu
- Cornell PRO-DAIRY: prodairy.cornell.edu
- Penn State Extension Dairy Team: extension.psu.edu/dairy
Market Intelligence:
- CME Group Dairy Futures: cmegroup.com/dairy
- USDA Agricultural Marketing Service: ams.usda.gov
- National Milk Producers Federation: nmpf.org
FMMO Information:
- USDA Final Rule Details: ams.usda.gov/fmmo
- NMPF FMMO Resources: nmpf.org/fmmo-modernization
The Path Forward
The disconnect between $11 billion in processing investment and producer returns reflects structural challenges in how our industry captures and distributes value. It’s not about villains and heroes—it’s about understanding economic dynamics and positioning ourselves accordingly.
According to USDA data released in December 2024, per capita dairy consumption reached 661 pounds in 2023, up 7 pounds from the previous year. Cheese consumption hit a record 42.3 pounds per person, and butter reached 6.5 pounds—the highest since 1965. Consumer demand is strong. The processors investing billions see opportunity.
Our challenge is ensuring producers capture fair value from that demand growth. Based on what I’m seeing—producers asking harder questions, exploring alternatives, demanding transparency—there’s reason for cautious optimism. The challenges are real. But so is the resilience I see across dairy farming communities every day.
The FMMO modernization victory demonstrates what’s possible when producers collaborate. As Gregg Doud noted, “Dairy farmers and cooperatives have done what they do best—lead their industry for the benefit of all.” That leadership needs to continue as we navigate these changes.
Because at the end of the day, all that processing capacity means nothing without the milk we produce. And that gives us more leverage than we sometimes realize. The key is using it wisely, strategically, and together.
The December 1st component changes are coming whether you’re ready or not. The processing investments will reshape regional markets regardless of your participation. Trade policies will shift with the political winds. But your response to these changes—that’s entirely within your control. Make it count.
KEY TAKEAWAYS
- Component optimization delivers immediate returns: Moving from 3.1% to 3.4% protein generates $720 monthly ($8,640 annually) per 100,000 pounds of milk—achievable through focused genetics, nutrition management, and transition cow care before December 1st changes take effect
- Regional dynamics create different opportunities: Upper Midwest producers near multiple plants can leverage competition for premiums, while Southeast operations facing 200-mile hauls need superior components or specialty markets to offset transportation disadvantages—know your regional leverage points
- Cooperative equity redemption stretches 10-15 years on Average: That $11 billion in processing investment comes from producer capital that’s locked up for decades—calculate your true net per hundredweight, including all equity obligations, not just your mailbox price
- Trade relationships determine future stability: With Mexico and Canada representing 40% of U.S. dairy exports ($3.61 billion in 2024), any disruption could shift supply-demand fundamentally—understand your milk buyer’s export exposure as part of your risk assessment
- Active governance participation matters more than ever: NMPF’s successful FMMO modernization after 200+ meetings shows what coordinated action achieves—if you can’t attend cooperative meetings, designate a trusted representative to ensure your interests are heard in billion-dollar investment decisions
Complete references and supporting documentation are available upon request by contacting the editorial team at editor@thebullvine.com.
Learn More:
- FMMO Reality Check: Why 2025’s $2.3 Billion Dairy Pricing Revolution Exposes the Fatal Flaw in American Milk Marketing – This tactical guide reveals the precise numbers and actionable strategies for mastering the new FMMO rules. It provides a producer’s roadmap for optimizing components to capture premiums and avoid penalties, ensuring your operation is profitable under the new system.
- Global Dairy Market Analysis: Butter Strength, SMP Weakness Signal Strategic Opportunities – While the main article focuses on domestic investment, this analysis broadens the perspective to global trade dynamics. It explains why some components are more valuable than others on the world stage and helps producers understand how global demand for butter and cheese directly influences their milk check.
- AI and Precision Tech: What’s Actually Changing the Game for Dairy Farms in 2025? – This article provides a comprehensive look at the technologies, like precision feeding and automated health monitoring, that progressive dairy farms are adopting to cut costs and improve component quality. It demonstrates how investing in innovation can create a competitive advantage, regardless of market volatility.
 Join the Revolution!
 Join the Revolution!
Join over 30,000 successful dairy professionals who rely on Bullvine Weekly for their competitive edge. Delivered directly to your inbox each week, our exclusive industry insights help you make smarter decisions while saving precious hours every week. Never miss critical updates on milk production trends, breakthrough technologies, and profit-boosting strategies that top producers are already implementing. Subscribe now to transform your dairy operation’s efficiency and profitability—your future success is just one click away.


