


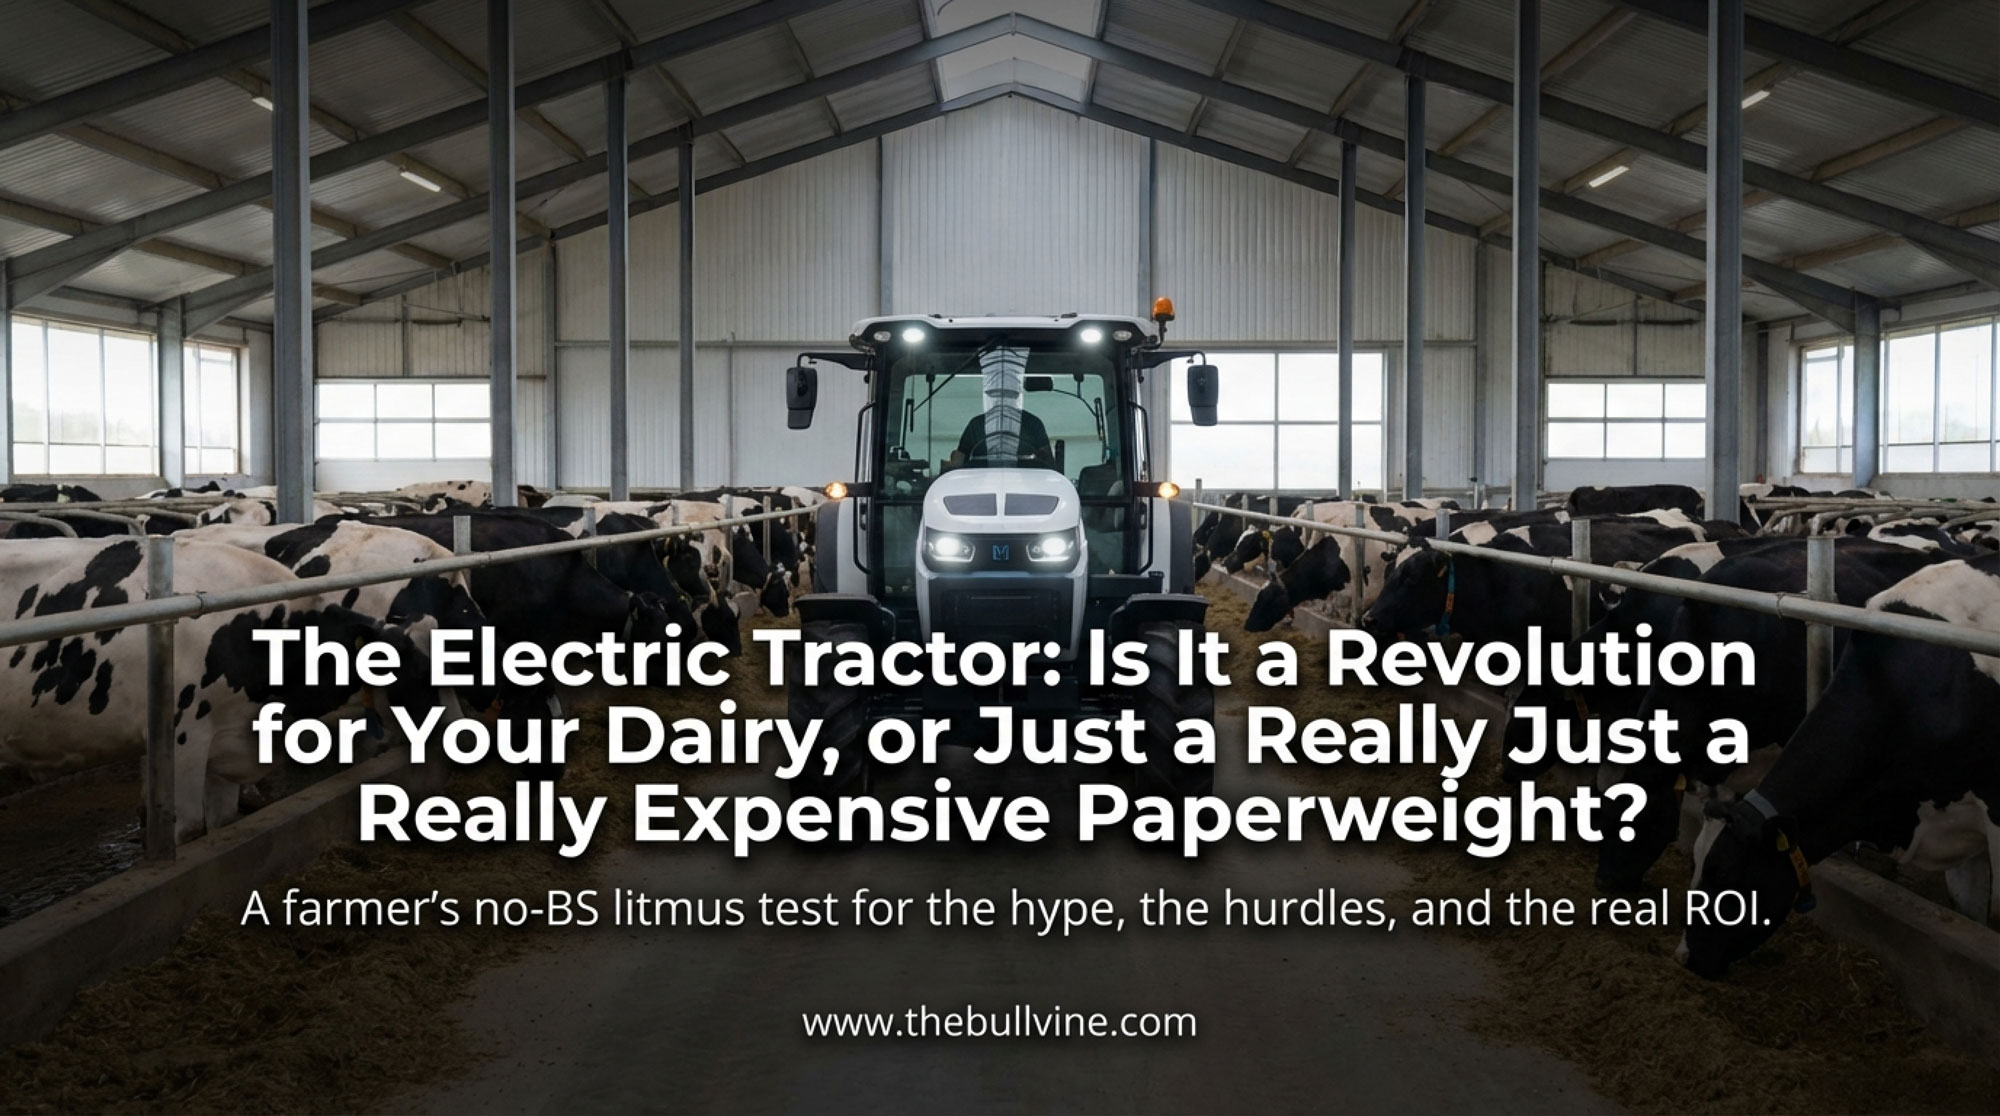
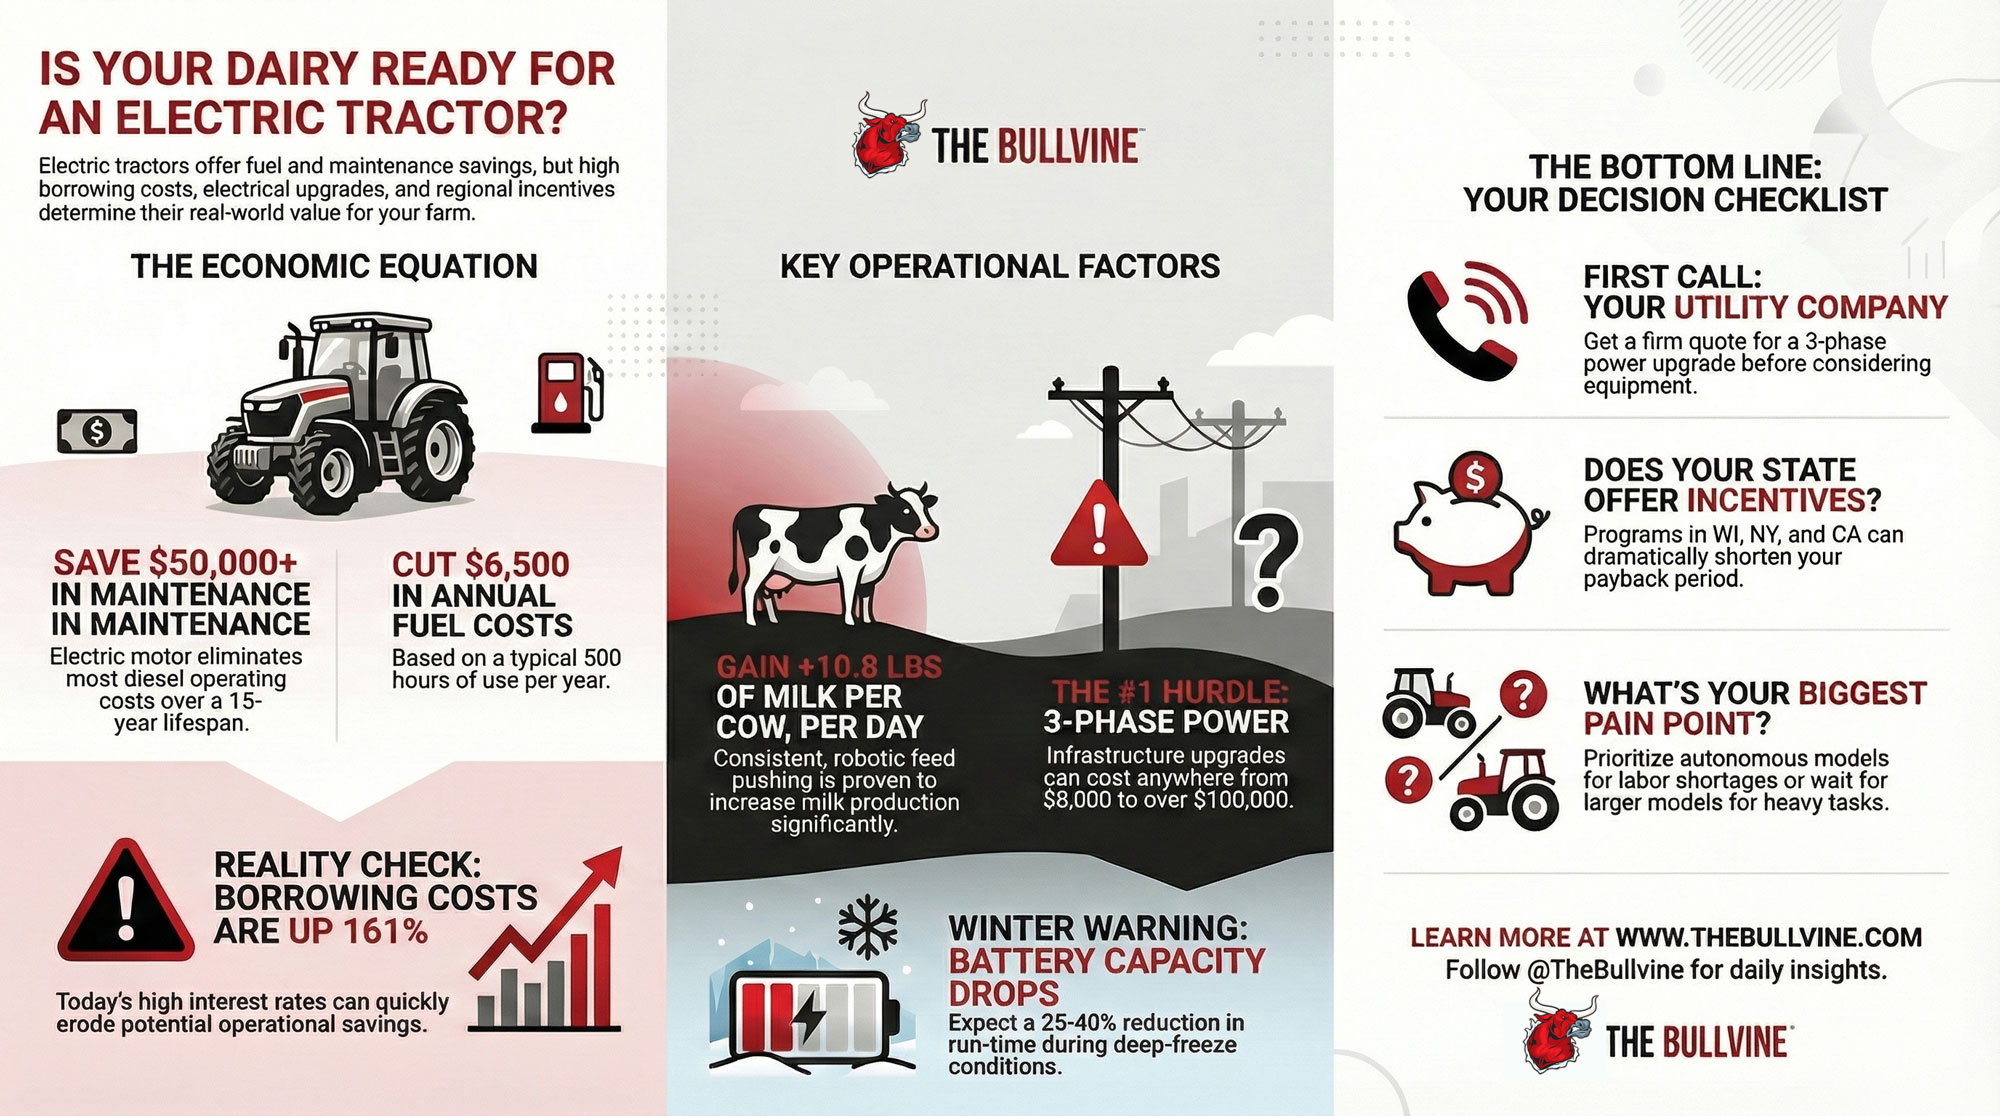
Electric tractors save $6,500/year in fuel. But 161% higher borrowing costs might eat those savings. Let’s do the math.
Executive Summary: Monarch’s autonomous MK-V is already pushing feed on working dairies—and the production numbers are hard to ignore: robotic feed pushing correlates with 10.8 lbs more milk per cow daily, according to research from Canadian AMS farms. John Deere’s larger E-Power? Still 18-24 months from production. The maintenance case is compelling (diesels accumulate ~$50,000 in operating costs over 15 years that electric largely eliminates), but your three-phase power quote is the true decision point—upgrades range from $8,000 to $100,000+ depending on utility infrastructure. Wisconsin, New York, and California incentives can compress payback to 2-4 years, while operations without those programs may find waiting for Deere and improved financing conditions the smarter path. Your right answer depends on three things: current equipment condition, infrastructure costs, and whether labor constraints or cash flow pressure is the tighter squeeze on your operation right now.
John Deere’s E-Power prototype is generating plenty of buzz while Monarch’s autonomous MK-V units are already pushing feed on dairies from California to Wisconsin. Here’s what you need to know right away: Monarch’s compact utility tractors are commercially available today, while John Deere’s larger E-Power units remain in pilot programs ahead of expected 2026-2027 production. Don’t call your Deere dealer expecting inventory—it’s not there yet.
What experienced operators are discovering is that success with electric equipment has less to do with the technology itself and more to do with whether your specific operation’s economics, infrastructure, and timing actually line up.
The conversation around battery-powered tractors has shifted dramatically over the past couple of years. What started as trade show concepts has become a production reality.
But here’s the thing—the decision isn’t about whether electric works. It does. The real question is whether your operation’s circumstances align with what this equipment delivers. That calculation varies by herd size, equipment hours, location, and the current condition of the tractor.
The Maintenance Math: $50,000 Over 15 Years
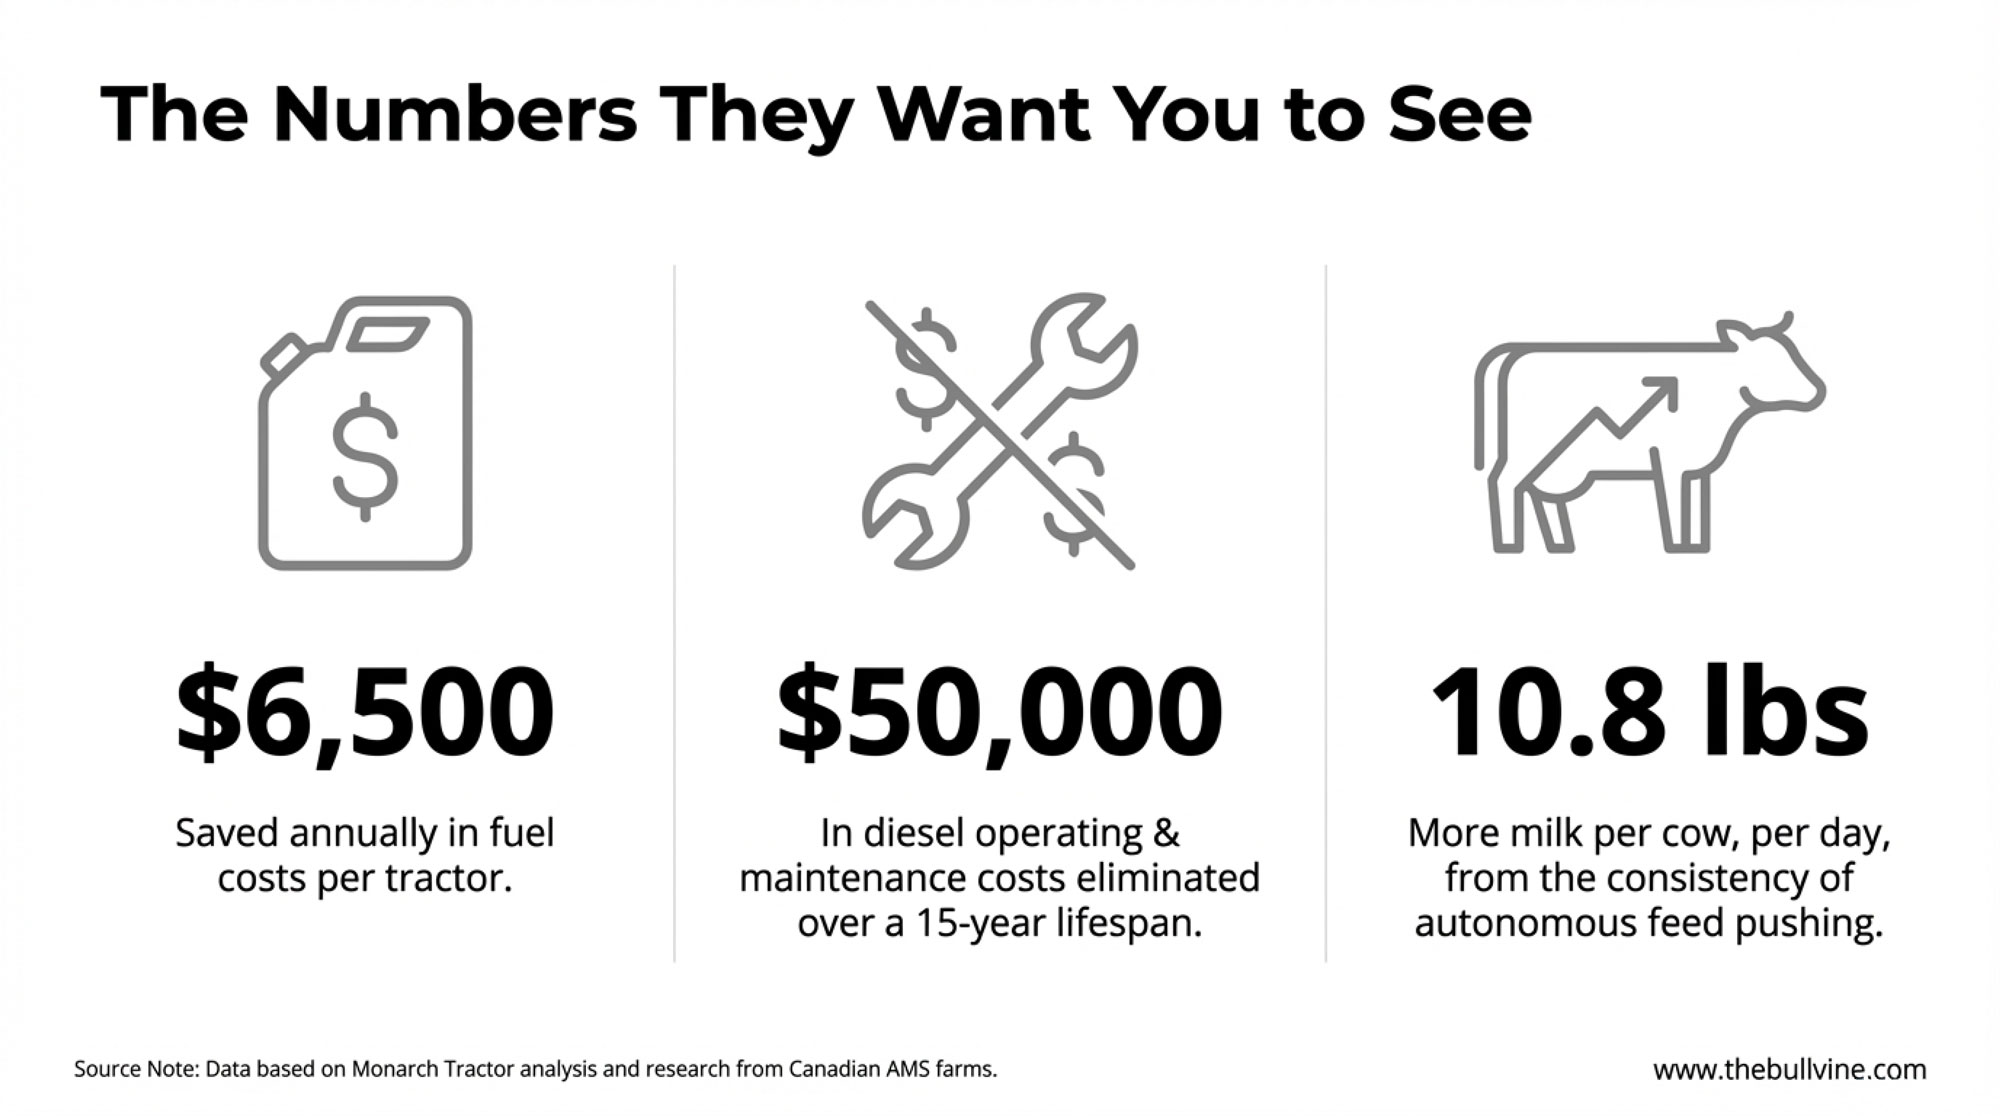
The number that matters: Industry estimates suggest a diesel tractor averaging 400 hours annually accumulates approximately $50,000 in operating costs over a 15-year lifespan—not including fuel and lubrication—according to Monarch Tractor’s analysis using agricultural cost calculation tools.
That covers your oil changes, filter replacements, fuel system service, cooling system maintenance, and the inevitable component repairs after 10,000-plus operating hours. Anyone who’s managed equipment through multiple seasons knows how those costs pile up—especially when you’re juggling feed pushing, manure handling, and TMR mixing on a tight schedule.

| Category | Diesel Cost | Electric Cost |
| Maintenance (15 years) | $50,000 | $8,000 |
| Fuel/Energy (15 years, 400 hr/yr) | $52,000 | $18,000 |
| TOTAL 15-YEAR OPERATING COST | $102,000 | $26,000 |
An electric motor sidesteps most of this. No oil. No filters. No fuel injection systems. Battery pack monitoring and occasional brake service represent the primary requirements.
What the Research Shows
And the research backs this up. A peer-reviewed study in the International Journal of Scientific Research in Engineering and Management found that electric tractors achieve operational cost reductions of 40% to 60% compared to diesel equivalents. Payback periods typically range from four to seven years, depending on electricity prices and utilization rates.
Monarch reports that their MK-V saves farmers approximately $5,500 to $6,500 annually in fuel costs at 500 hours of use. Scale that to 1,200-1,500 annual hours typical of mid-sized dairies, and you’re looking at meaningful numbers.
The Utilization Catch
Here’s what often gets overlooked, though: these savings require sufficient equipment utilization to materialize.
A 150-cow operation running 600 annual equipment hours sees proportionally smaller benefits. That narrower margin extends payback periods and makes the capital premium harder to justify.
I’d encourage anyone considering this transition to pull their actual usage records—not estimates, but real data—before getting too attached to headline numbers.
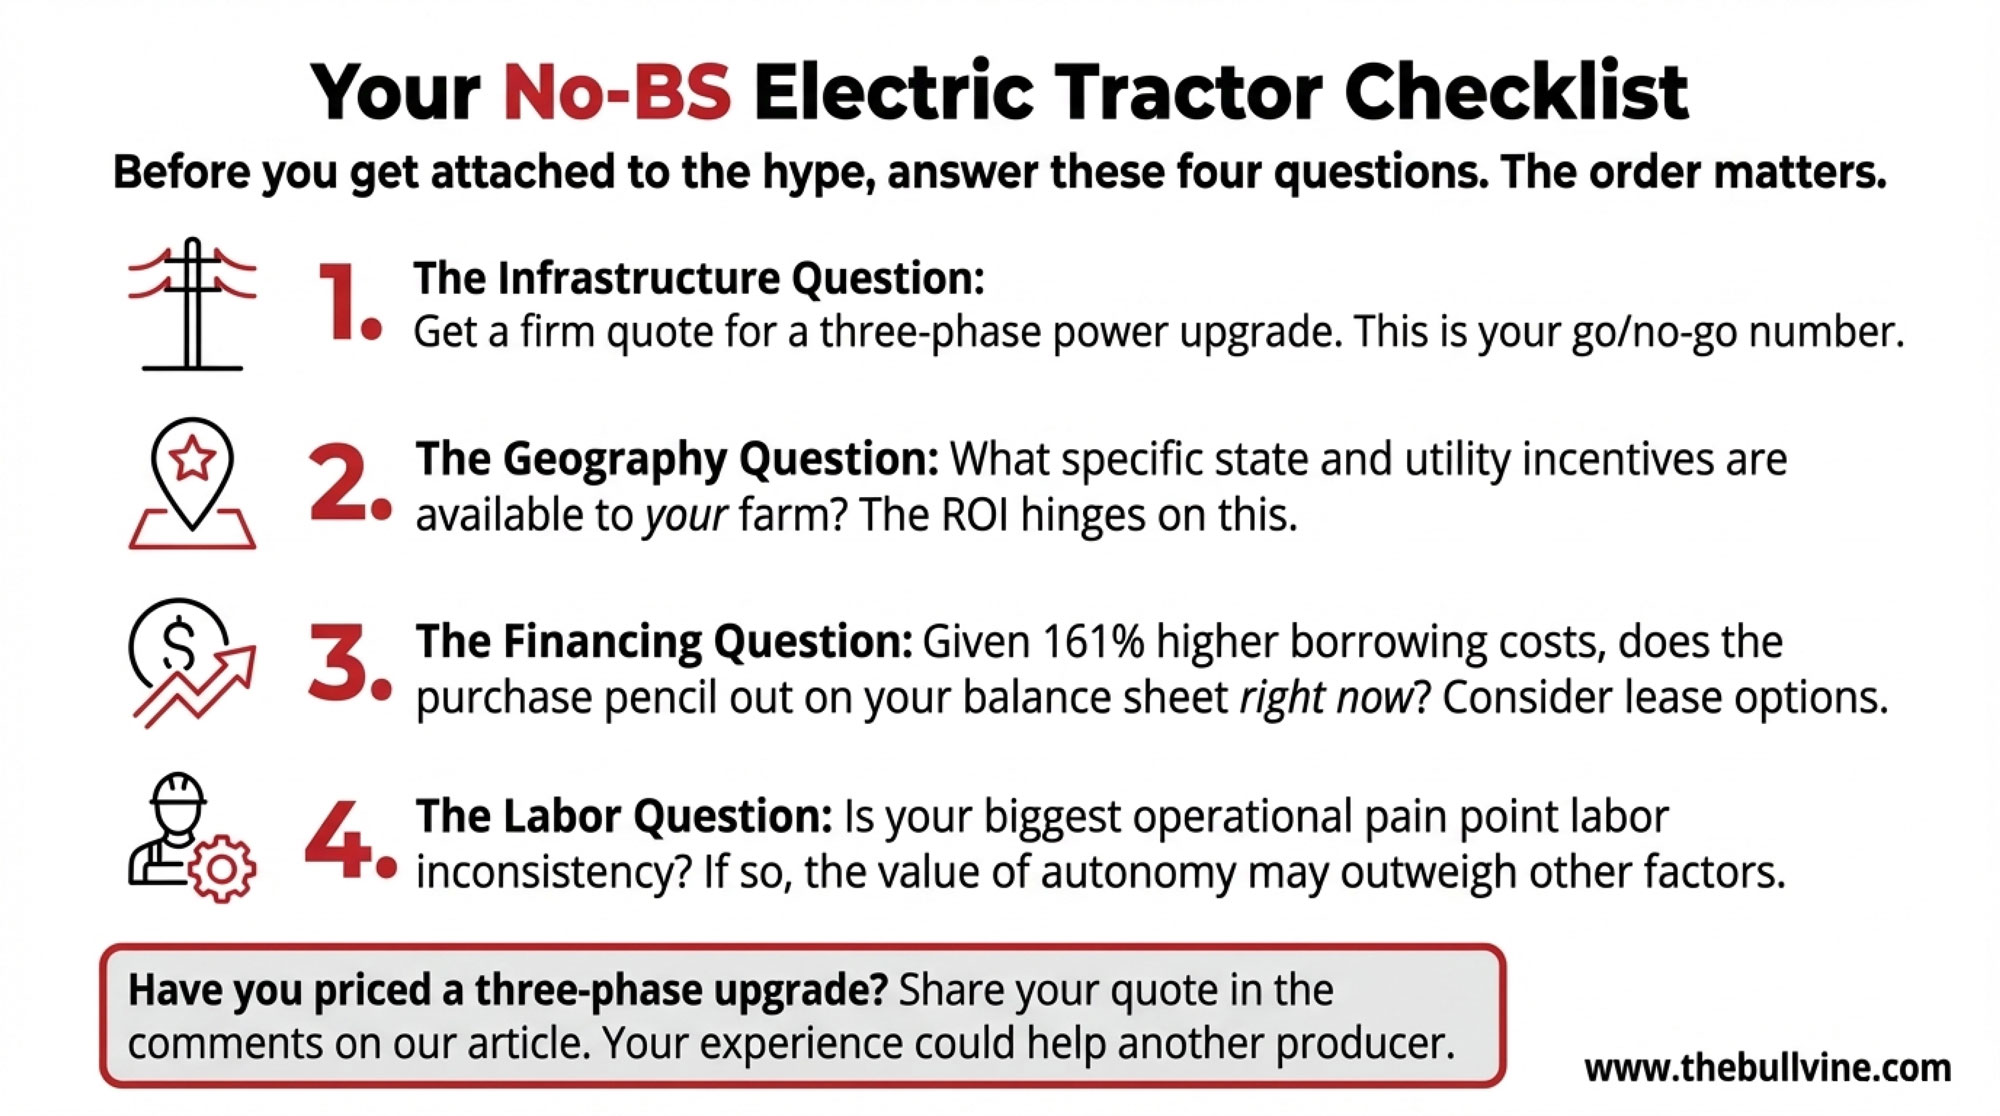
Infrastructure: Your First Decision Point
This is where a lot of electric tractor conversations get complicated. The equipment works. Economics can pencil out. But infrastructure requirements create barriers that vary considerably by location.
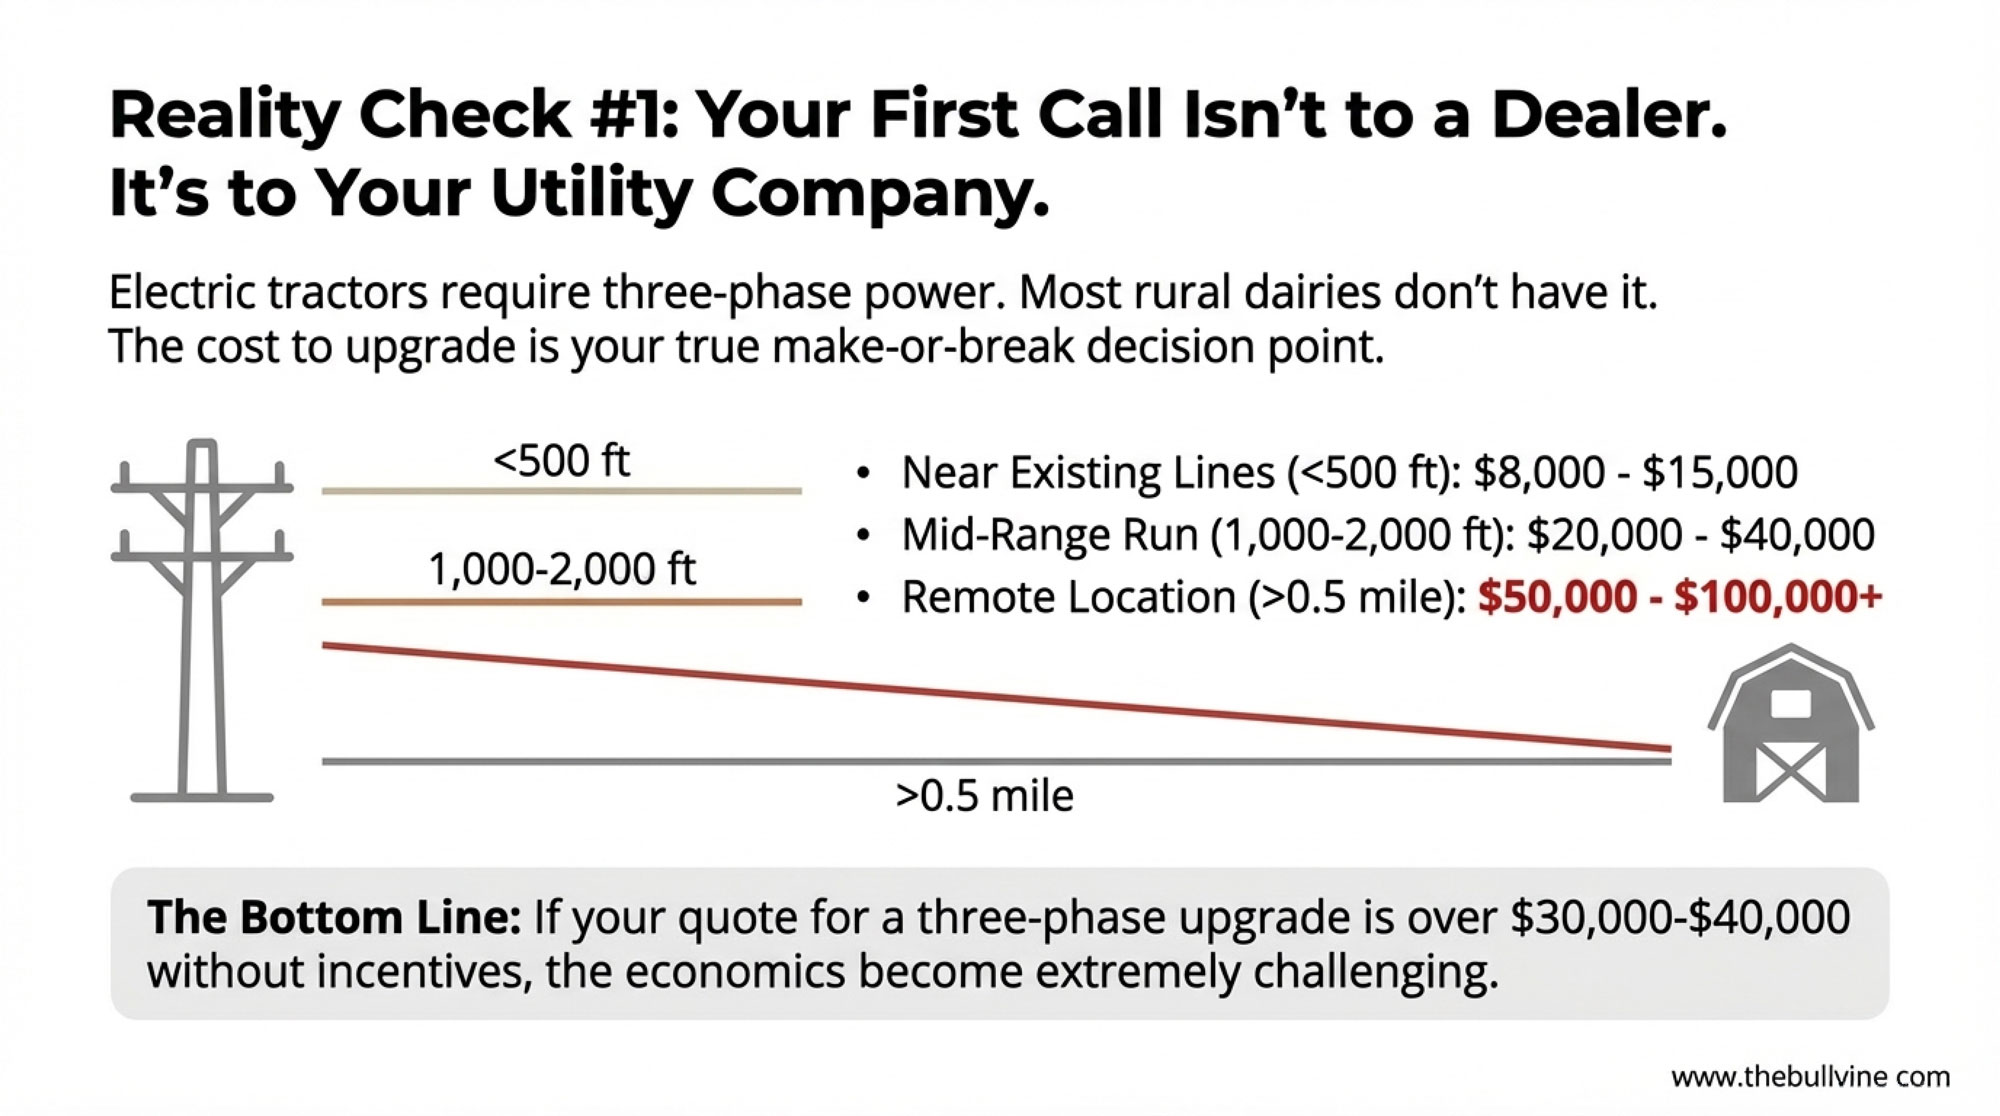
Three-phase power is the key variable here. Most rural dairy operations run on single-phase electrical service—it’s simply what’s available in many agricultural areas. Electric tractor charging (particularly faster charging enabling same-day turnaround) requires three-phase delivery.
What Three-Phase Upgrades Actually Cost
Industry estimates vary significantly by utility and region. Get a specific quote from your provider, but expect these general ranges:
- Within 500 feet of existing three-phase lines: Generally $8,000-$15,000
- Requiring 1,000-2,000 feet of new service: Often $20,000-$40,000
- Remote operations (half-mile or longer runs): Can reach $50,000-$100,000+
Producers have reported quote variations of $20,000 or more from the same utility, depending on route options—worth exploring alternatives before assuming you know the number.
The takeaway: Contact your utility before any equipment decision. If three-phase costs exceed $30,000-$40,000 without incentives, economics become challenging for most operations.
| Distance from Existing 3-Phase | Typical Upgrade Cost | With State Incentives (WI/NY/CA) | Break-Even Point (Years) | Best State Programs | ROI Rating |
|---|---|---|---|---|---|
| < 500 feet | $8,000 – $15,000 | $2,000 – $8,000 | 2.0 – 3.5 | Wisconsin Focus on Energy, NY NYSERDA | Strong |
| 500 – 1,000 feet | $15,000 – $25,000 | $5,000 – $15,000 | 3.0 – 4.5 | California SGIP, NY Dairy Modernization | Good |
| 1,000 – 2,000 feet | $25,000 – $40,000 | $10,000 – $25,000 | 4.0 – 6.0 | USDA REAP (all states) | Marginal |
| > 2,000 feet | $40,000 – $100,000+ | $20,000 – $60,000 | 7.0 – 12.0+ | USDA REAP only | Weak |
| Remote (> 0.5 mile) | $80,000 – $150,000+ | $40,000 – $90,000 | 10.0 – 20.0+ | Limited options | Poor |
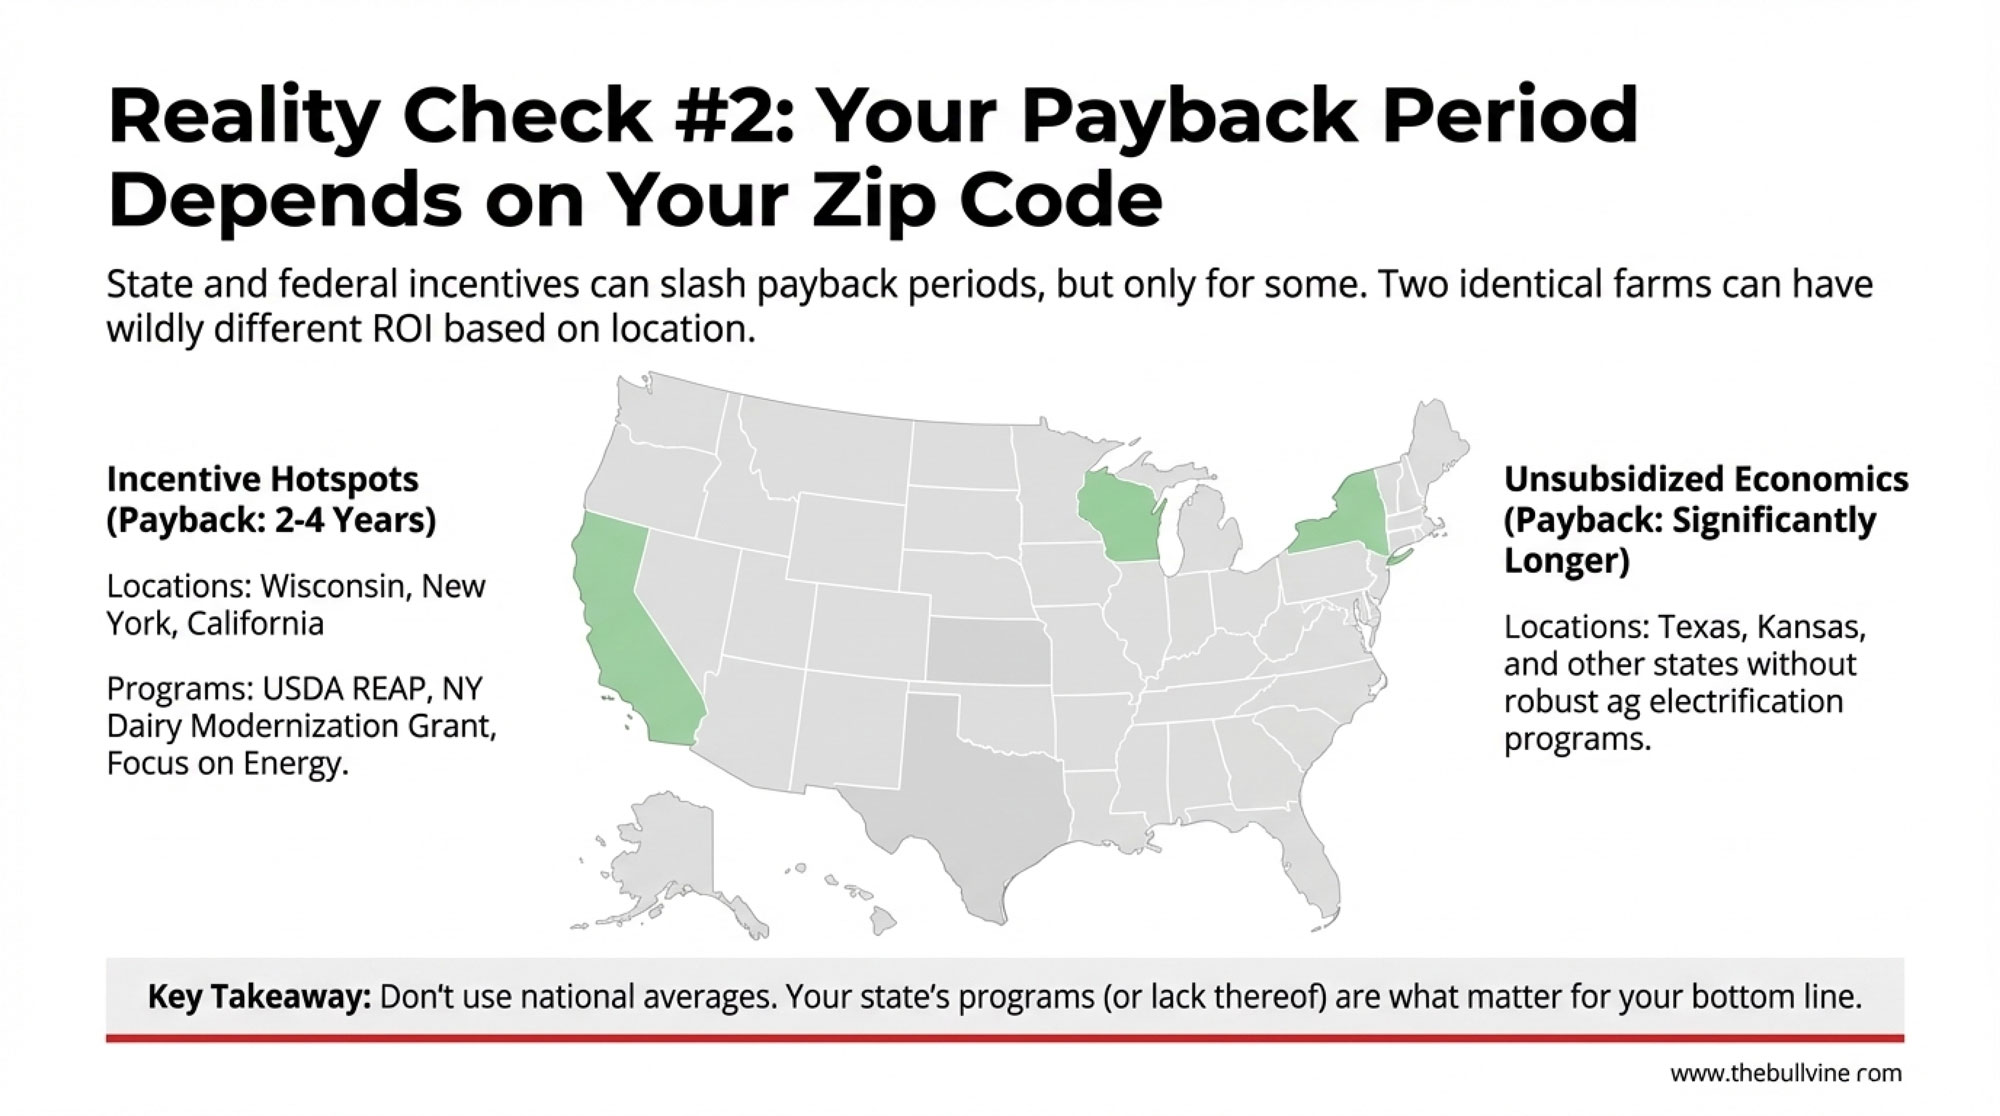
State Incentives: Why Geography Matters
State and utility programs can substantially shift the math—and this is where knowing your region really matters.
Wisconsin
- Focus on Energy: Various incentives for agricultural electrification with matching funds available
- USDA REAP: More than $24 million announced for rural Wisconsin businesses in November 2024 alone, per Brownfield Ag News
New York
- Dairy Modernization Grant Program: $21.6 million available; grants range $50,000-$250,000, as Cowsmo reported
- Results: 100+ dairy farms funded; additional $10 million available from 2026 budget
- NYSERDA: No-cost energy assessments through the Agriculture Energy Audit Program
- Utilities: NYSEG and RG&E offer infrastructure incentives, including three-phase upgrades, according to Ag Energy NY
California
- Self-Generation Incentive Program: Revenue streams for clean power generation
- Low Carbon Fuel Standard: Additional credits for emissions reduction
States Without Programs
And here’s the flip side worth acknowledging: if you’re running a dairy in Texas, Kansas, or similar states without robust agricultural electrification programs, you’re looking at unsubsidized economics. The technology still works, maintenance savings still materialize—but payback timelines stretch considerably without those incentive dollars.
Two identical operations can have completely different ROI timelines, purely based on geography. It’s worth understanding what’s available in your state before running the numbers.
For international readers: Operations in Europe, Australia, and New Zealand face entirely different incentive structures and utility configurations—check your regional programs before applying U.S.-specific guidance here.
The Financing Reality: All-Time High Interest
Here’s something that’s changed the equipment purchase calculation for many operations recently, affecting both diesel and electric purchases equally.
David Widmar, an agricultural economist with Agricultural Economic Insights, told Brownfield Ag News: “Almost $160 of interest expense is going to be accumulated over the life of a $1,000 worth of farm machinery debt. If you go back to 2020 or 2021, it was about half of that.”
| Purchase Scenario | Equipment Price | Interest Rate | Total Interest Paid (7 yrs) | Monthly Payment |
|---|---|---|---|---|
| Diesel Tractor (2021) | $85,000 | 3.2% | $9,900 | $1,103 |
| Diesel Tractor (2025) | $95,000 | 7.8% | $25,840 | $1,436 |
| Electric Tractor (2021 equivalent) | $130,000 | 3.2% | $15,150 | $1,687 |
| Electric Tractor (2025) | $145,000 | 7.8% | $39,560 | $2,199 |
The Timeline Shift
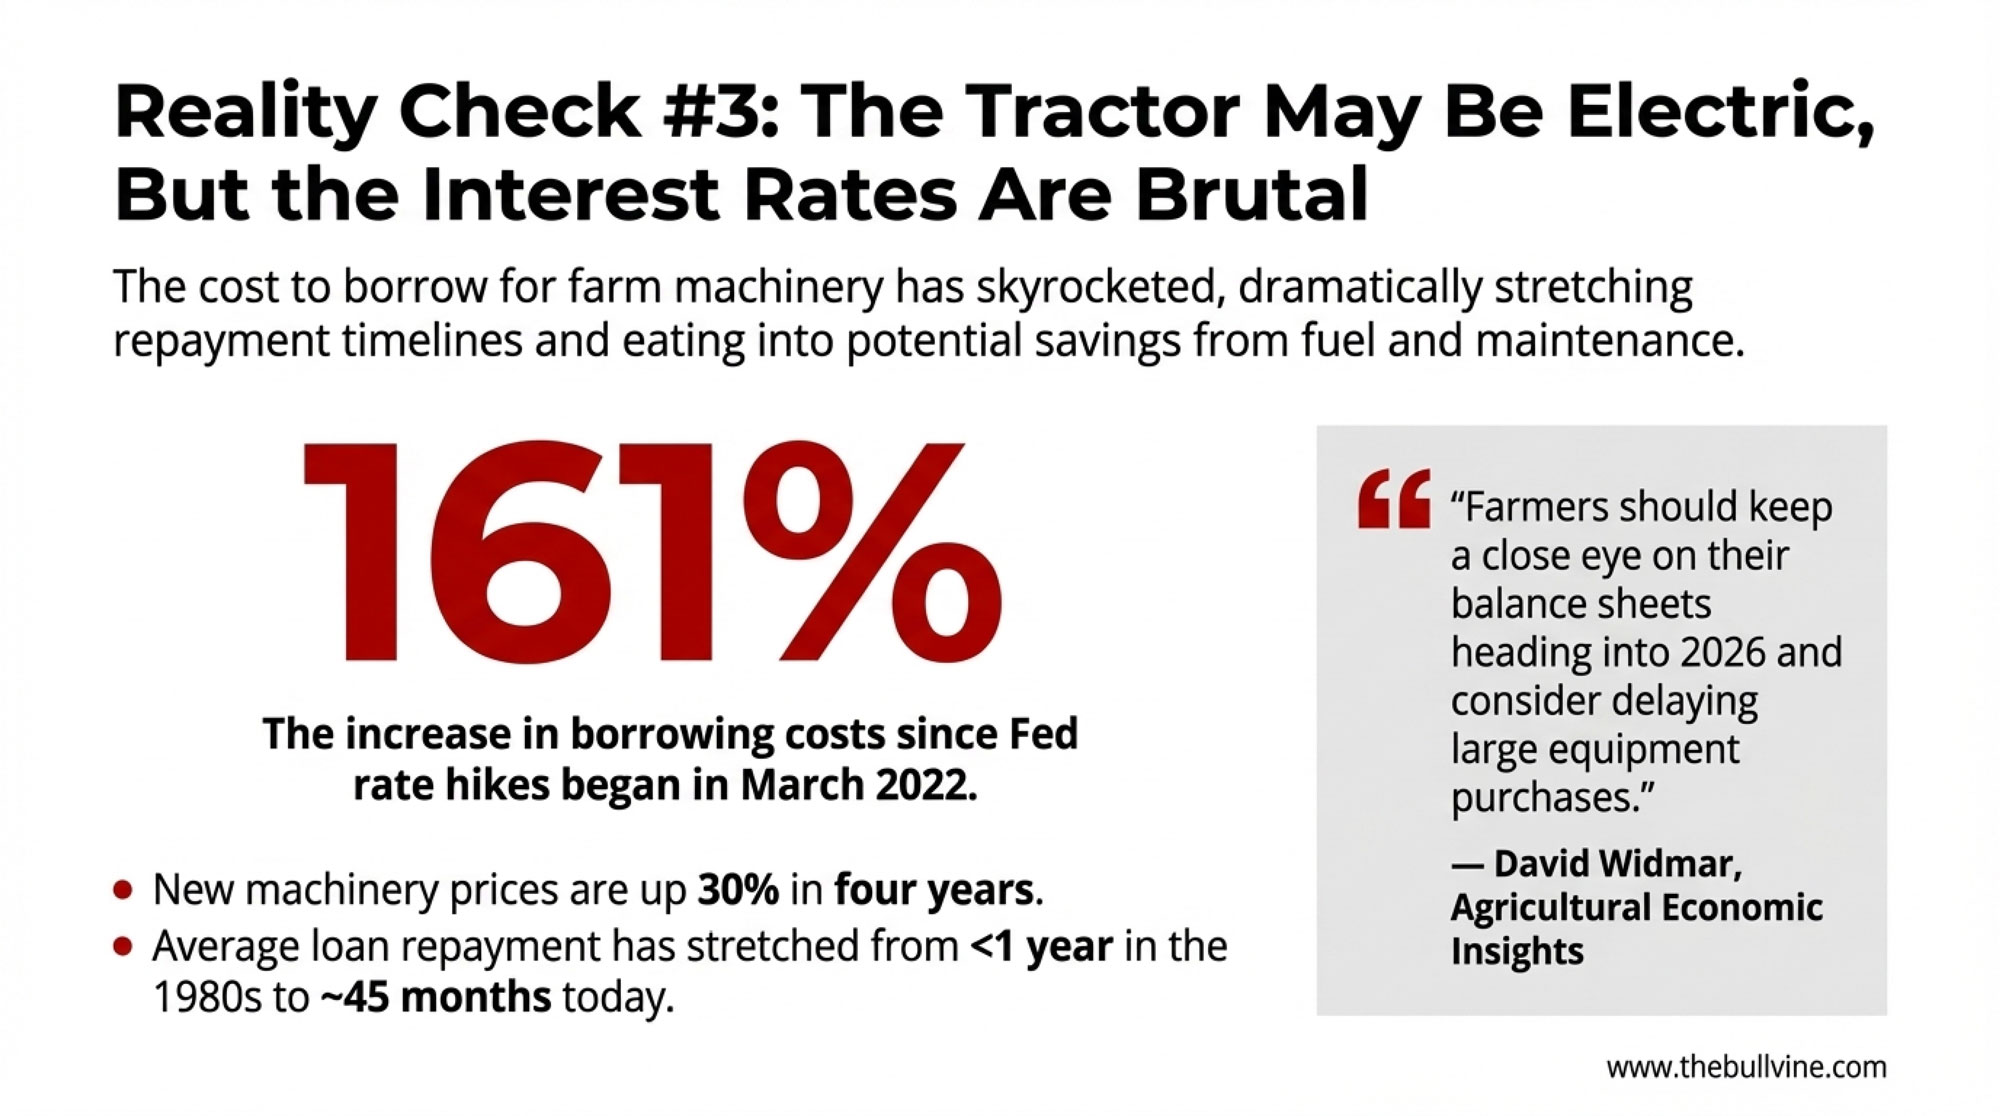
What’s interesting is how much the repayment timeline has stretched. “In the 1980s, when we had double digit interest rates, the average loan was less than a year for farm machinery,” Widmar explained. “Now, it takes about 45 months for producers to repay a machinery loan.”
The Numbers
- Price increase: New machinery up 30% over four years
- 2020 average tractor price: $363,000
- 2023 average tractor price: $491,800, according to Dairy Herd Management
- Borrowing cost increase: 161% higher since Fed rate hikes began in March 2022
David Oppedahl, policy advisor at the Federal Reserve Bank of Chicago, confirmed to Brownfield that agricultural credit conditions weakened in Q2 2025. Banks are increasing collateral requirements, and while loans are still getting made, real interest rates have edged up.
Current Financing Options
- AgDirect: Fixed rates starting at 5.95% (verify current offerings—rates change)
- Farm Credit Canada: Zero down for loans under $100,000; terms to 10 years
- Expected range: Farm operating loans may stay 7-8% even with Fed cuts, according to FCS America’s outlook
Some dealers also offer lease-to-own options that may reduce upfront capital requirements—worth asking about if cash flow is a primary concern.
Widmar’s advice: “Farmers should keep a close eye on their balance sheets heading into 2026 and consider delaying large equipment purchases.” That’s worth considering whether you’re evaluating diesel or electric.
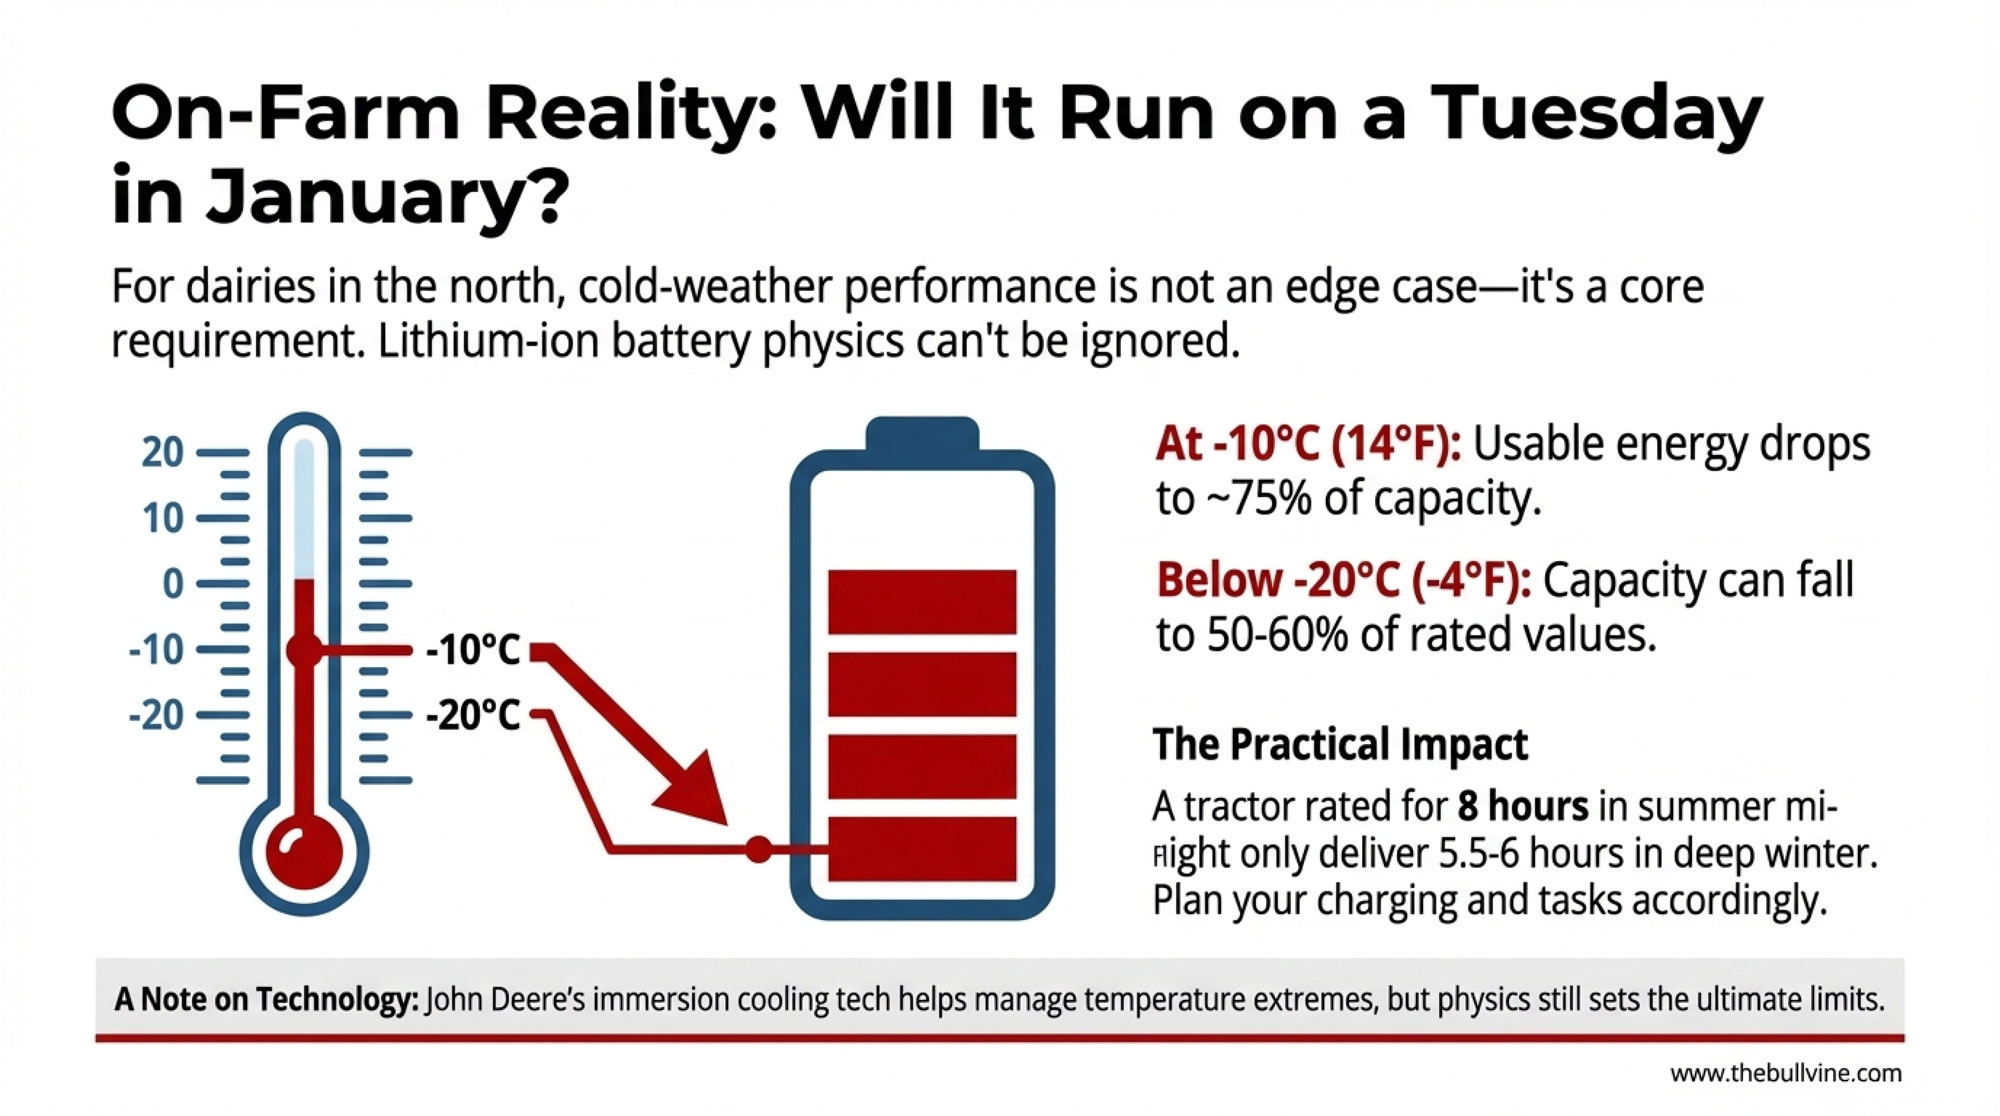
Cold Weather Performance: Northern Dairy Reality
For operations in Wisconsin, Minnesota, Michigan, and Ontario, cold-weather performance deserves serious attention. This is where I’ve noticed the marketing materials sometimes get a bit vague—and where your operational planning really matters.
What the Physics Show
Lithium-ion batteries lose capacity in cold weather. This isn’t a flaw—it’s physics.
- Below -20°C (-4°F): Capacity falls to 50-60% of rated values, according to research in Chemical Engineering Journal
- At -10°C (14°F): Usable energy drops to approximately 75% of warm-weather capacity, per National Renewable Energy Laboratory findings
- Long-term impact: Batteries stored below freezing lose 5% more capacity after 100 cycles, SLAC National Accelerator Laboratory research shows
Practical Impact
A 195 kWh battery delivering 8 hours in summer might deliver 5.5-6 hours in deep winter. Plan accordingly if you’re pushing feed at 5 AM in January up in northern Wisconsin or the Upper Peninsula.
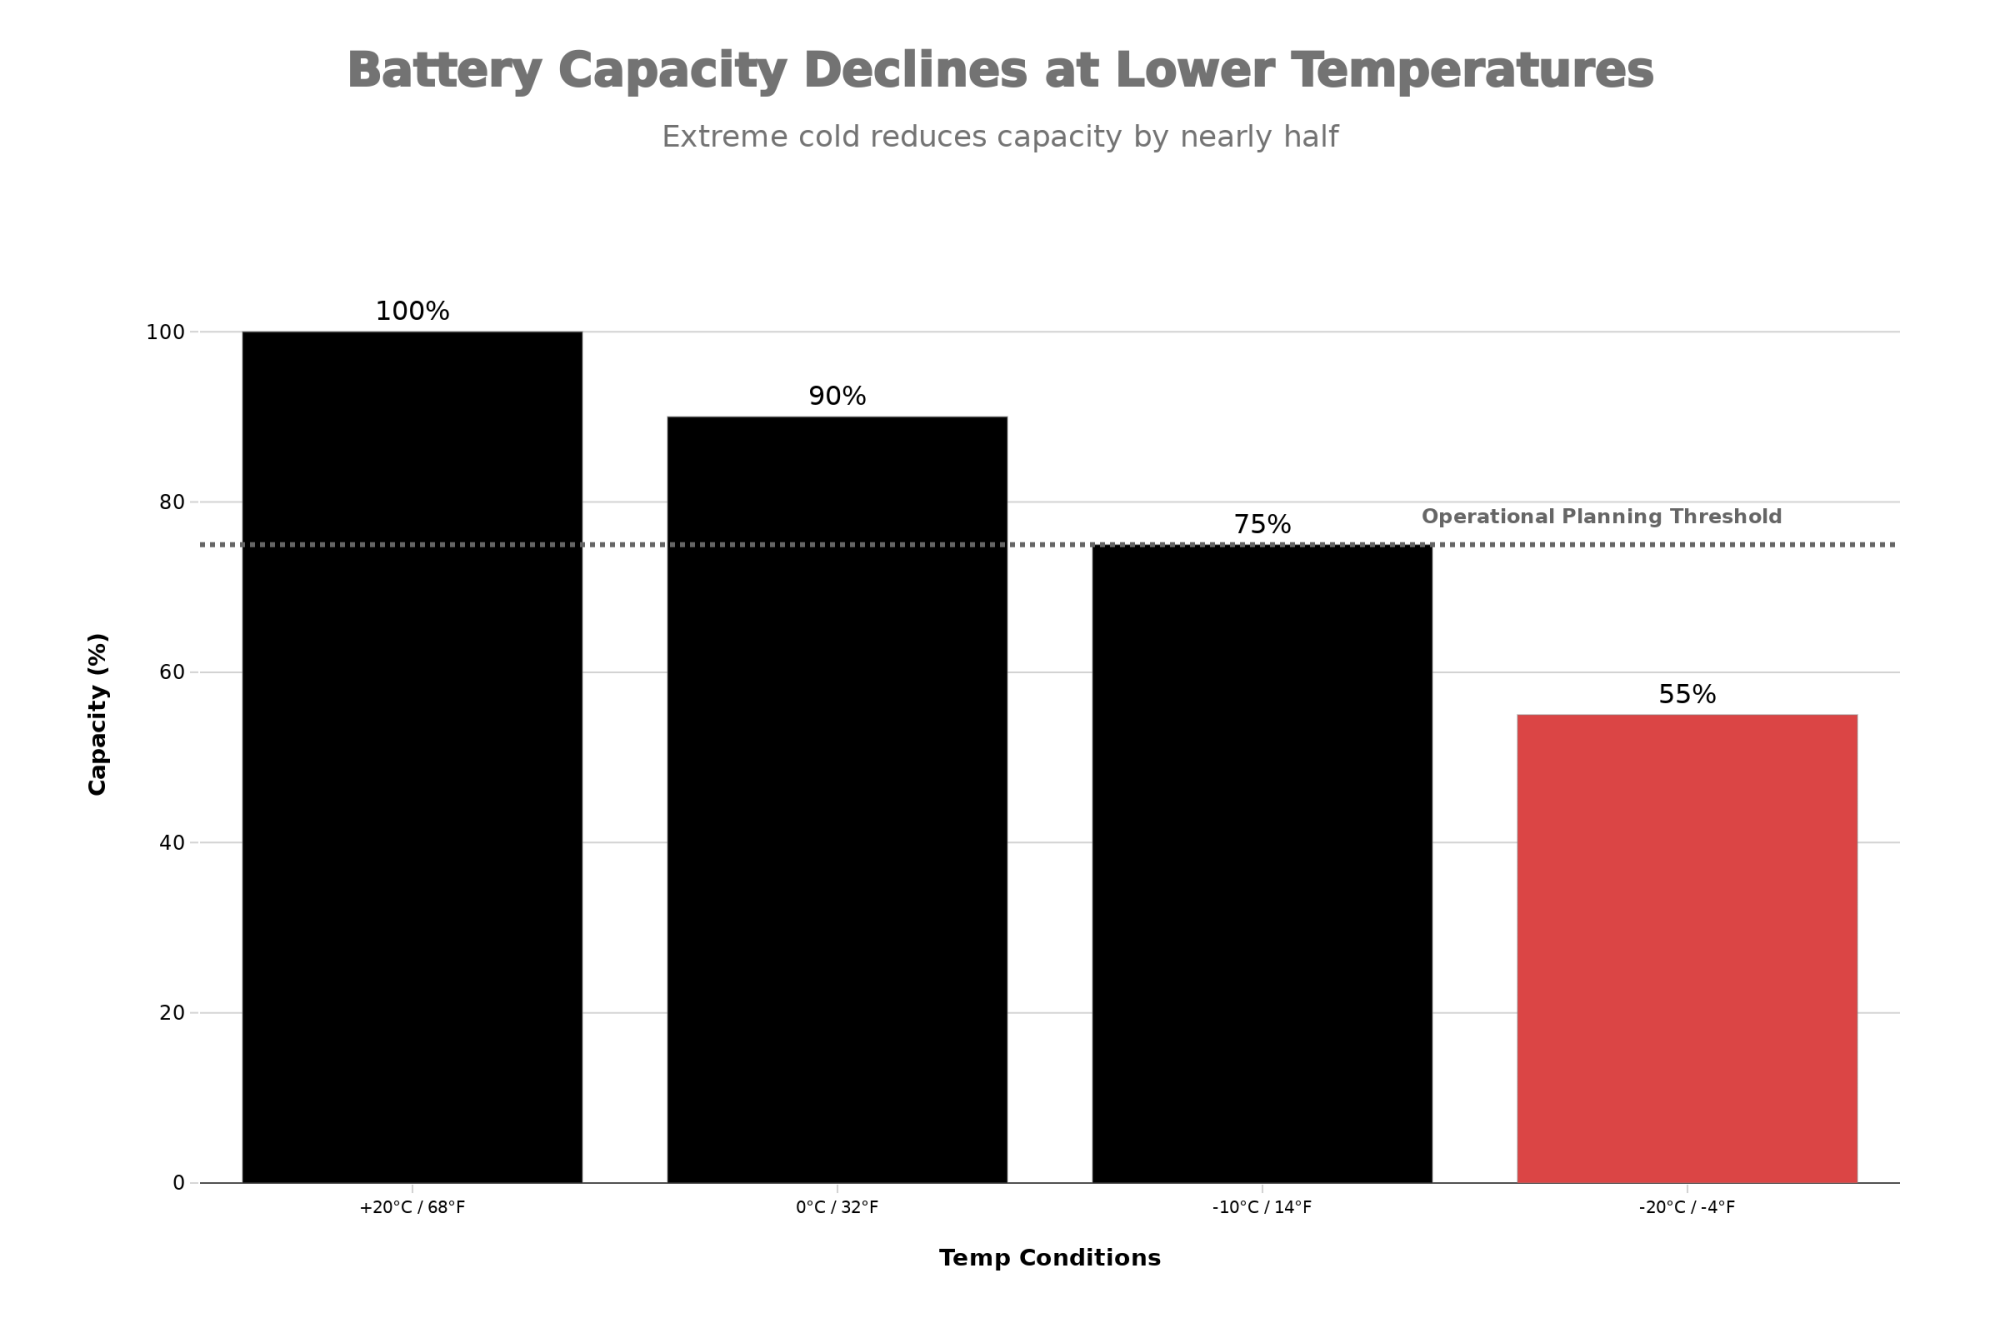
| Temperature | Capacity Retained | Runtime (from 8-hr baseline) |
| +20°C / 68°F | 100% | 8.0 hours |
| 0°C / 32°F | 90% | 7.2 hours |
| -10°C / 14°F | 75% | 6.0 hours |
| -20°C / -4°F | 55% | 4.4 hours |
How John Deere Addresses This
John Deere’s E-Power uses KREISEL Electric’s immersion cooling technology. Their specifications show:
- Temperature spread was maintained below 1°C throughout the battery module
- Operational range: -40°C (-40°F) to +70°C (+158°F)
- Dielectric thermal management fluid keeps cells at optimal temperature
This helps considerably but doesn’t eliminate constraints entirely. Northern operations may need larger battery configurations than summer-only analysis suggests. It builds on what we’ve seen with other cold-weather equipment adaptations over the years.
Cow Comfort: The Noise Factor
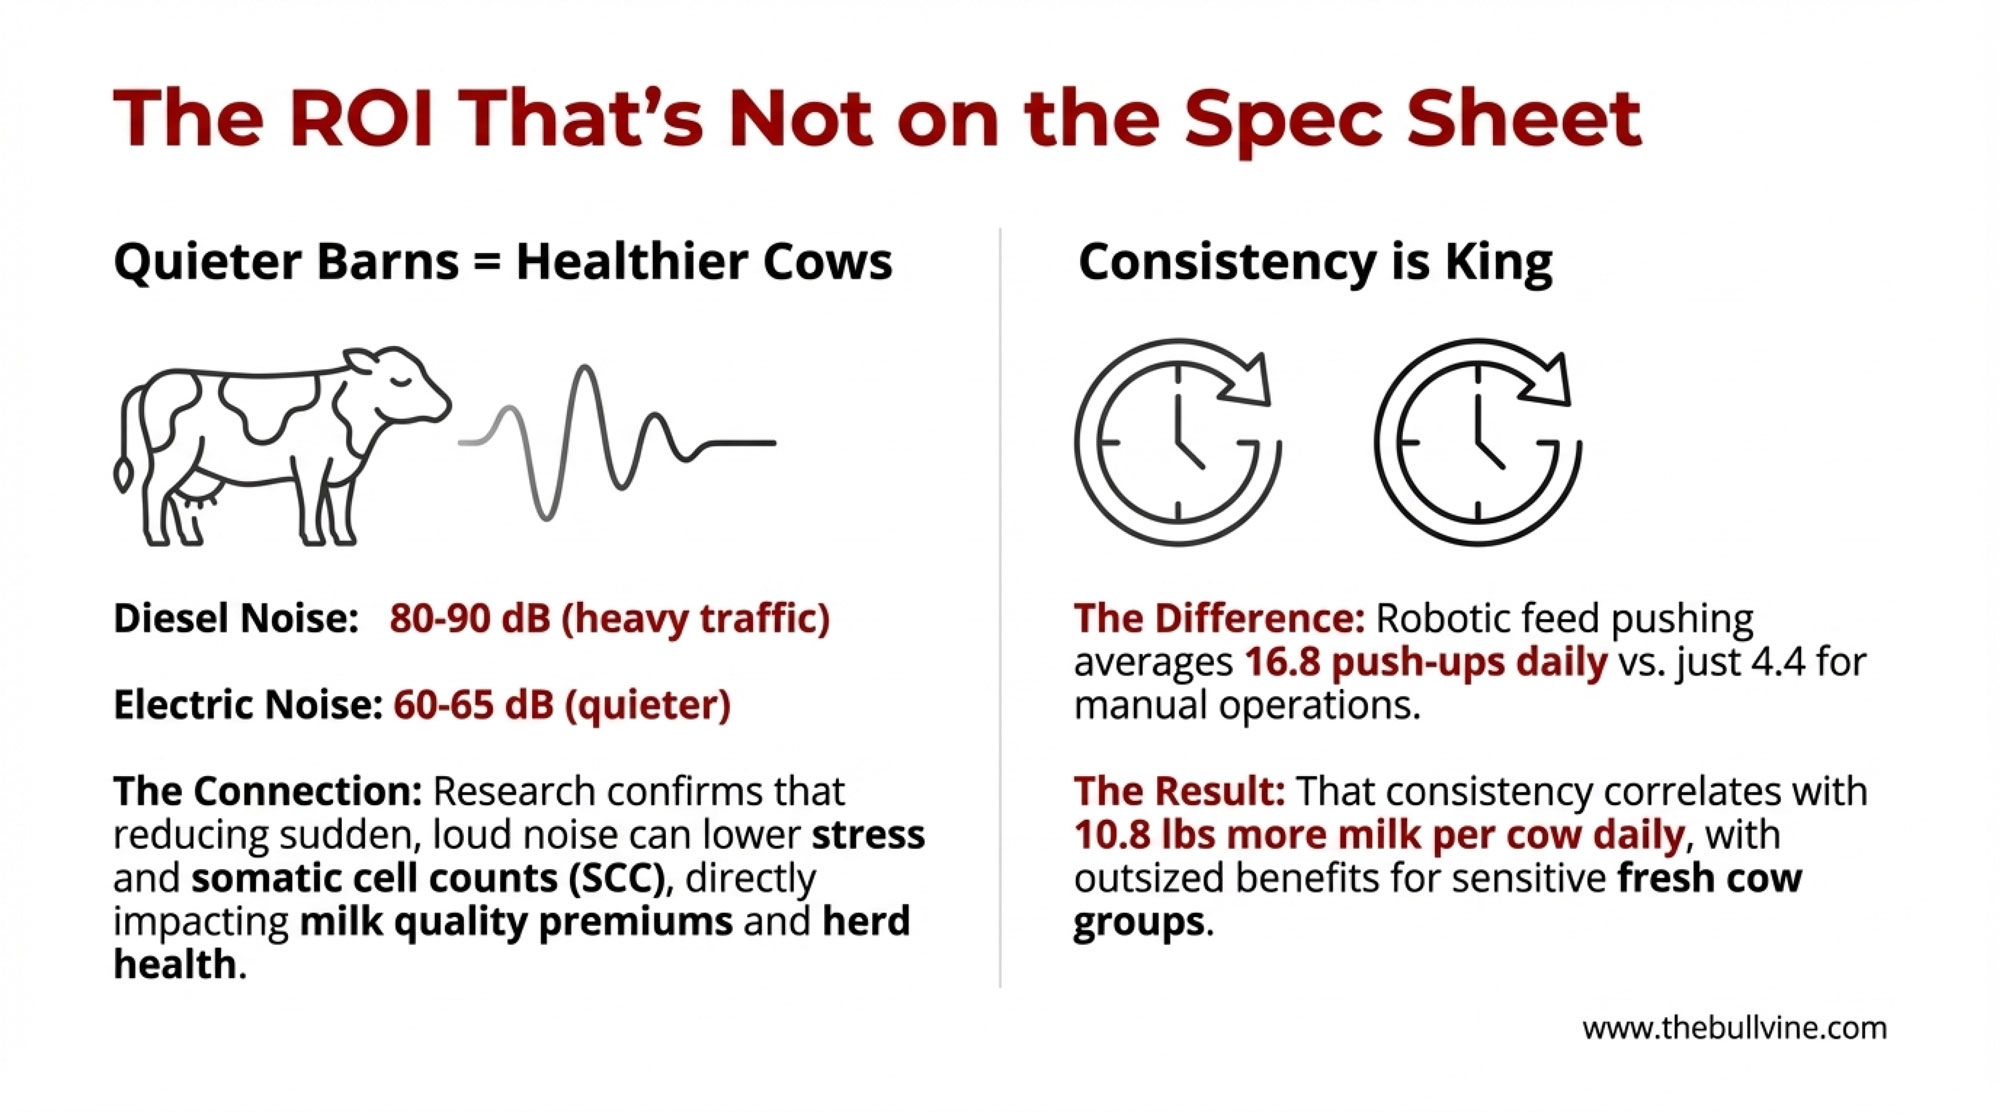
Less noise = lower stress = lower somatic cell counts. That’s really what it comes down to.
Research compiled by Dairy Global confirms cattle exposed to sudden loud noise showed immediate milk production cessation and elevated SCC—”indicating damage to milk-producing tissue in the udder.” Anyone who’s managed fresh cow protocols or worked through mastitis challenges understands how SCC affects both milk quality premiums and herd health costs.
- Diesel tractors: 80-90 dB (comparable to heavy traffic)
- Electric equipment: 60-65 dB (significantly quieter)
Studies in Scientific Reports and Applied Animal Behaviour Science link prolonged noise stress to elevated cortisol, reduced efficiency, and lower profitability.
For operations running equipment through confined feeding areas multiple hours daily, quiet operation compounds over time—similar to other cow comfort investments like freestall design or cooling systems.
The Labor Advantage: Consistency Wins
“Our cows are making more milk simply by ensuring feed is pushed correctly, and the labor savings are huge,” says Gerben (Hein) Hettinga, owner of GH Dairy. “With the electric, autonomous tractor pushing feed consistently, I’m expecting an increase in milk production—probably 1-2 pounds per cow each day.”
The Research
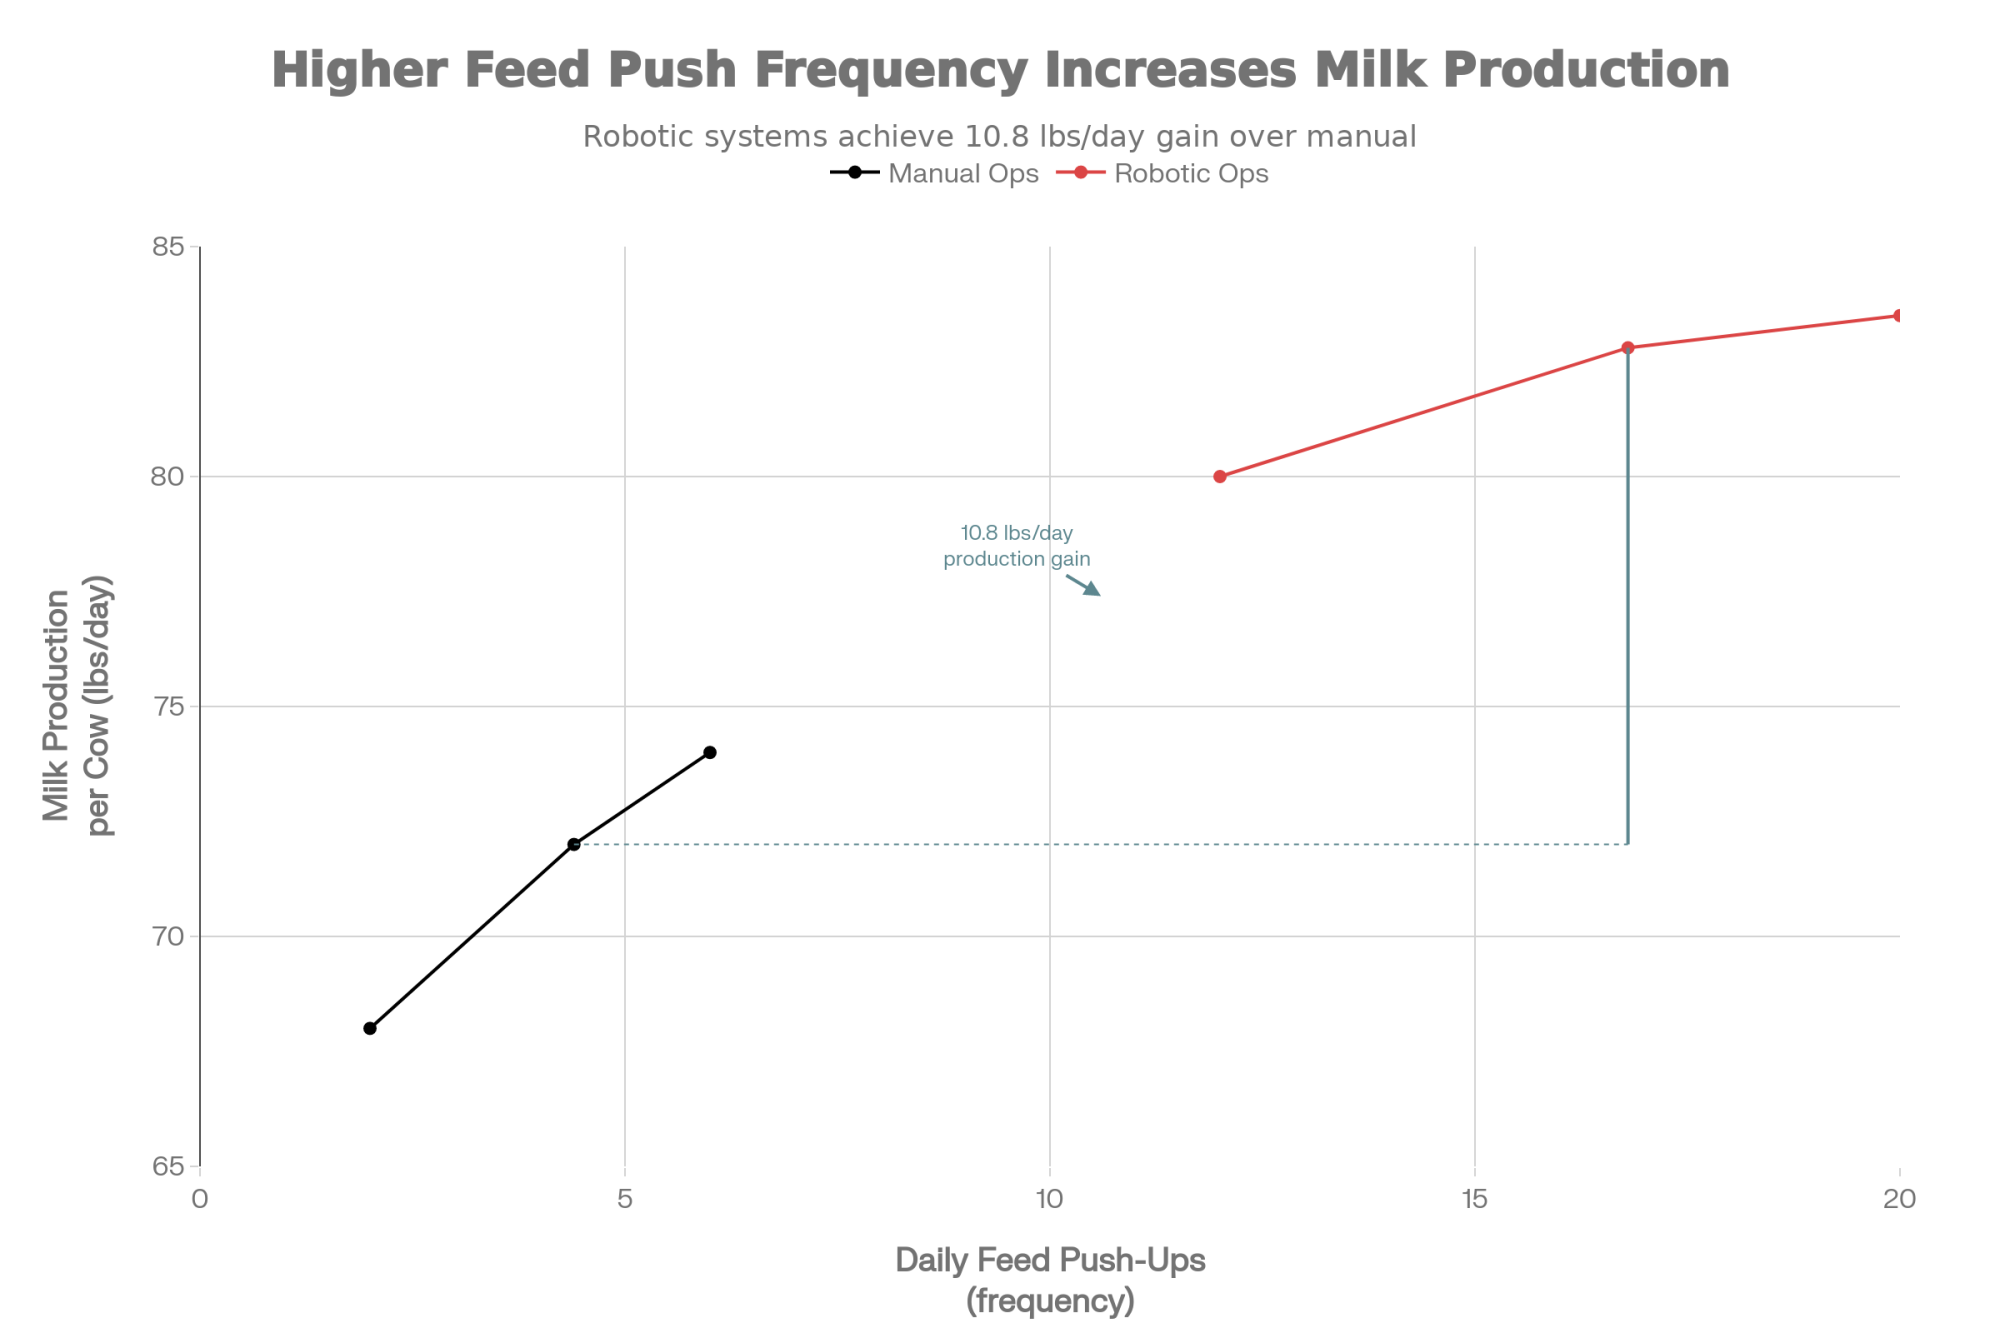
Published research from Canadian AMS farms shows:
- Robotic feed pushing farms: 10.8 lbs/day more milk per cow vs. manual operations
- Push frequency: 16.8 daily push-ups (robotic) vs. 4.4 (manual)
The researchers noted: “Employment of robotic technology does, in many cases, ensure the task needed to be done is actually completed, both frequently enough and consistently.”
Fresh Cow Consideration
Here’s something worth thinking about: transition period animals have higher nutritional demands and sensitivity to feeding consistency. The 16.8 daily push-ups could have outsized benefits for fresh cow groups specifically—keeping feed accessible during those critical first 21 days when intake is everything.
Dr. Abraham Du Plessis, dairy consultant and veterinarian with Progressive Dairy Solutions, puts it directly: “The Monarch tractor is going to be the tool that’s going to improve the profitability of every dairy farm in a big way.”
For operations where labor shortage is the critical constraint—and if this applies to you, you already know it—autonomous capability may matter more than any other specification.
Monarch vs. John Deere: Different Tools, Some Overlap
These competitors serve somewhat different segments, and it’s worth understanding the distinction.
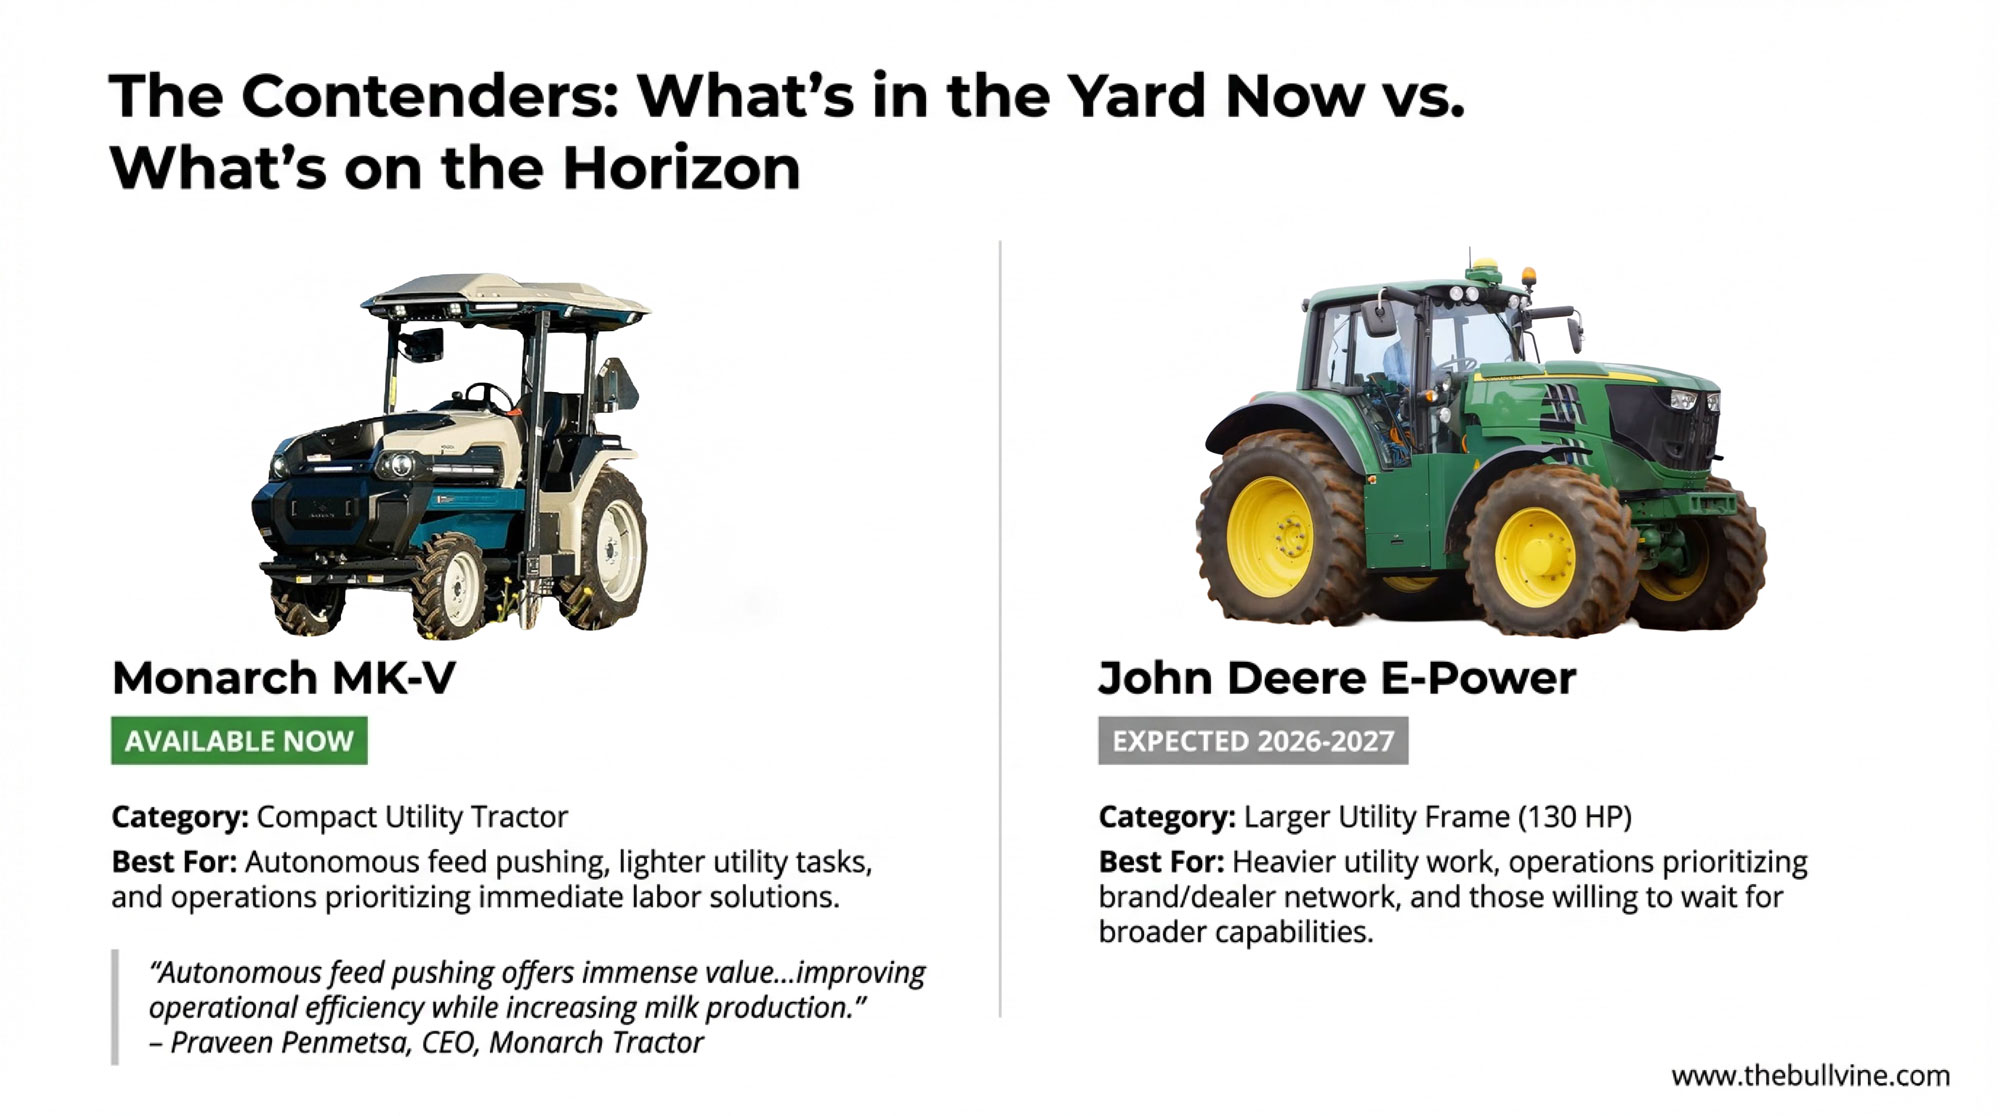
Monarch MK-V
- Status: Commercially available NOW
- Category: Compact utility tractor
- Strength: Autonomy-first design; Autodrive feed pushing deployed on working dairies
- Best for: Feed pushing, lighter utility tasks, operations prioritizing autonomous operation
“Autonomous feed pushing offers immense value to dairy farmers by improving operational efficiency while increasing milk production,” says Praveen Penmetsa, CEO of Monarch Tractor, in an interview with Farm Progress.
John Deere E-Power
- Status: Pilot programs; production expected 2026-2027
- Category: Larger utility frame
- Strength: Brand trust, dealer network, cold-weather engineering, ecosystem integration
- Specs: 130 HP continuous output; “autonomy-ready,” according to EV Engineering Online
The overlap: Both compete for feed pushing and similar repetitive tasks. But the E-Power’s larger frame positions it for heavier utility work that the MK-V isn’t designed for.
For operations prioritizing autonomy today, Monarch’s availability is compelling. For those wanting brand stability and broader capability, waiting for E-Power may make sense. There’s no single right answer here.
Timing Framework: Where Do You Fit?
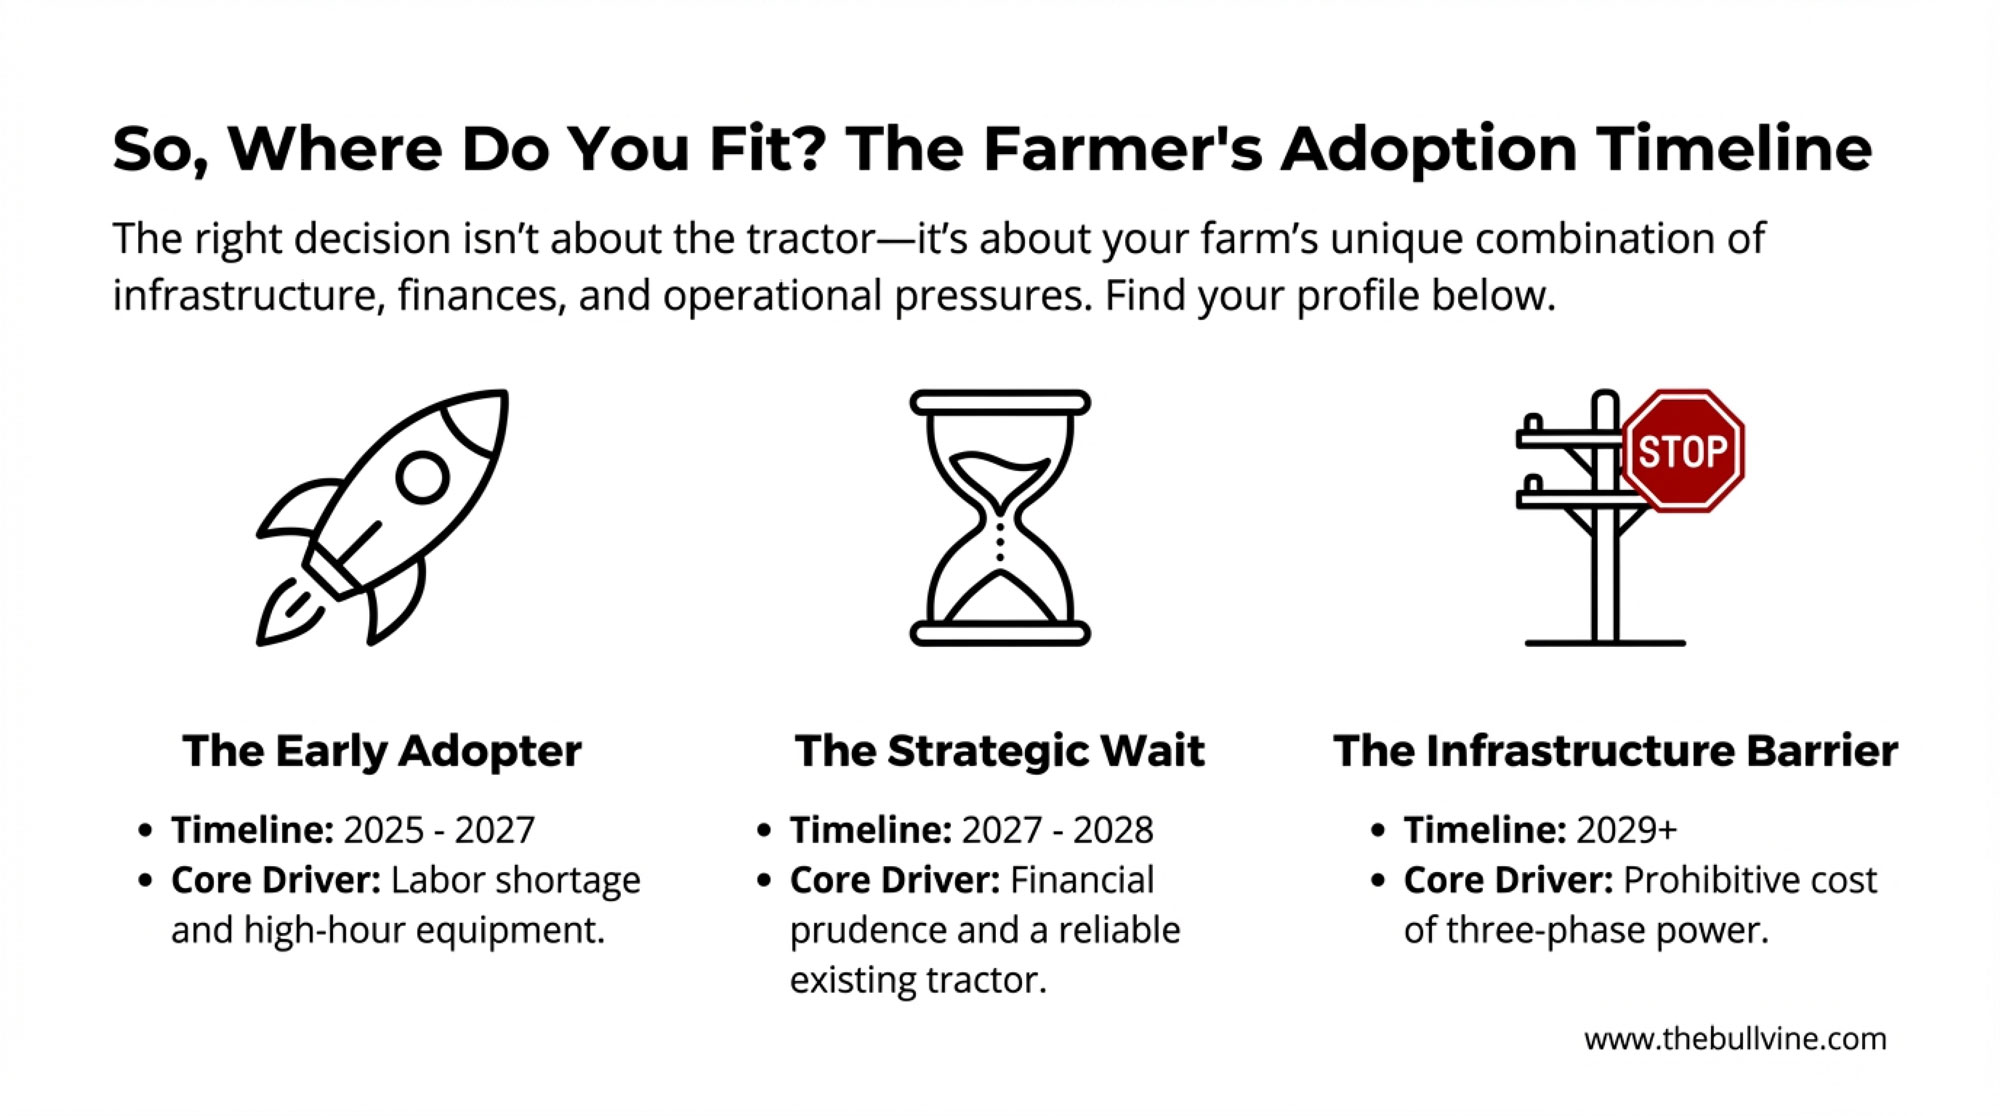
Early Adopter Profile (2025-2027)
Evaluate now if most of these apply to your operation:
- 400-1,200 cows
- Current diesel is at 10,000+ hours or needs major repairs
- 1,500-2,500 annual equipment hours
- Three-phase available or upgrade under $20,000
- State has electrification incentives
- Enclosed facilities (noise matters)
- Labor shortage affecting operations
- Stable/growing profitability
Action: Evaluate Monarch MK-V; request John Deere pilot participation; get infrastructure quotes; pull actual operating hour data.
Expected outcome: 2-4 year payback with incentives.
Strategic Wait Profile (2027-2028)
Patience makes sense if most of these apply:
- 200-400 cows OR 1,200+ cows
- Current diesel has under 8,000 hours, running well
- 800-1,500 annual equipment hours
- Three-phase upgrade $20,000-$40,000
- No state incentives
- Labor stable
- Profitability pressured/variable
Some producers in this situation are choosing to wait. A Michigan farmer with a reliable mid-hours tractor and a five-figure three-phase quote decided E-Power’s production timeline and potentially improved financing conditions made patience the smarter choice for his operation. “The technology’s going to improve, and the costs are going to come down,” was his thinking—and that’s a reasonable position for operations in this profile.
Action: Track maintenance costs; monitor E-Power timeline; revisit late 2026.
Expected outcome: 3.5-5 year payback with proven technology and established pricing.
Infrastructure Barrier Profile
If the three-phase exceeds $40,000-$60,000 or grid constraints exist:
Get that utility quote immediately—it’s your true decision point. If costs are prohibitive, evaluate battery-buffered charging alternatives or plan for 2029-2030 when additional solutions may emerge. The technology is evolving rapidly.
| Decision Factor | Early Adopter Profile (Buy Now) | Strategic Waiter Profile (2027-2028) | Infrastructure Barrier (2029+) |
| Herd Size | 400-1,200 cows | 200-400 or 1,200+ cows | Any size |
| Current Diesel Condition | 10,000+ hours or major repairs needed | <8,000 hours, running well | Any condition |
| Annual Equipment Hours | 1,500-2,500 hours | 800-1,500 hours | Variable |
| Three-Phase Upgrade Cost | <$20,000 or available | $20,000-$40,000 | >$40,000-$60,000 |
| State Incentive Access | Wisconsin, NY, California programs | Moderate incentives or none | Limited/none |
| Labor Situation | Shortage affecting operations | Labor stable | Variable |
| Milk Price/Profitability | Stable or growing | Pressured/variable | Pressured |
| Expected Payback Period | 2-4 years with incentives | 3.5-5 years | 7-12+ years |
| Recommended Action | Evaluate Monarch MK-V now; request Deere pilot access | Track maintenance costs; monitor E-Power timeline | Get utility quote; consider battery-buffered charging |
Key Takeaways
- $50,000+ in diesel maintenance over 15 years—electric sidesteps most of it
- Infrastructure first: Get your three-phase quote before anything else
- Geography matters: Wisconsin, New York, California incentives change ROI dramatically; states without programs mean longer payback
- Financing is challenging: 161% higher borrowing costs than 2020-2021; ask about lease options
- Cold weather: Plan for 25-30% capacity reduction in northern winters
- Monarch vs. Deere: Different sizes, some task overlap; Monarch available now, E-Power 18-24 months out
- Autonomy may matter most: For labor-constrained operations, consistent feed pushing drives real production gains—especially for fresh cow groups
Have you recently priced a three-phase upgrade? Share your quote in the comments—the variance between utilities is significant, and your experience could help another producer make a smarter decision.
Complete references and supporting documentation are available upon request by contacting the editorial team at editor@thebullvine.com.
Learn More:
- Tech Reality Check: The Farm Technologies That Delivered ROI in 2024 (And Those That Failed) – Tactical Analysis: Validates the specific ROI of robotic feed pushers (2.1-year payback) versus other investments, providing crucial data for producers weighing the autonomous capabilities of electric units against other automation options.
- Decide or Decline: 2025 and the Future of Mid-Size Dairies – Strategic Context: Delivers a “survival guide” for the 700-1,200 cow operations squeezed by consolidation, offering a perfect strategic framework to determine if your farm is positioned for capital expansion or operational optimization.
- How Dairy Farmers Are Finally Breaking Free From the 365-Day Grind – and Finding More Time and Profit – Labor & Lifestyle: Goes beyond the balance sheet to explore how automation strategies—like the ones found in Monarch’s MK-V—are successfully reducing burnout and recapturing family time for progressive operators.
 Join the Revolution!
 Join the Revolution!
Join over 30,000 successful dairy professionals who rely on Bullvine Weekly for their competitive edge. Delivered directly to your inbox each week, our exclusive industry insights help you make smarter decisions while saving precious hours every week. Never miss critical updates on milk production trends, breakthrough technologies, and profit-boosting strategies that top producers are already implementing. Subscribe now to transform your dairy operation’s efficiency and profitability—your future success is just one click away.


