


12% milk increase in the research. 4% on real farms. $234,000 yearly gap. Nobody showed you the full picture. Until now.
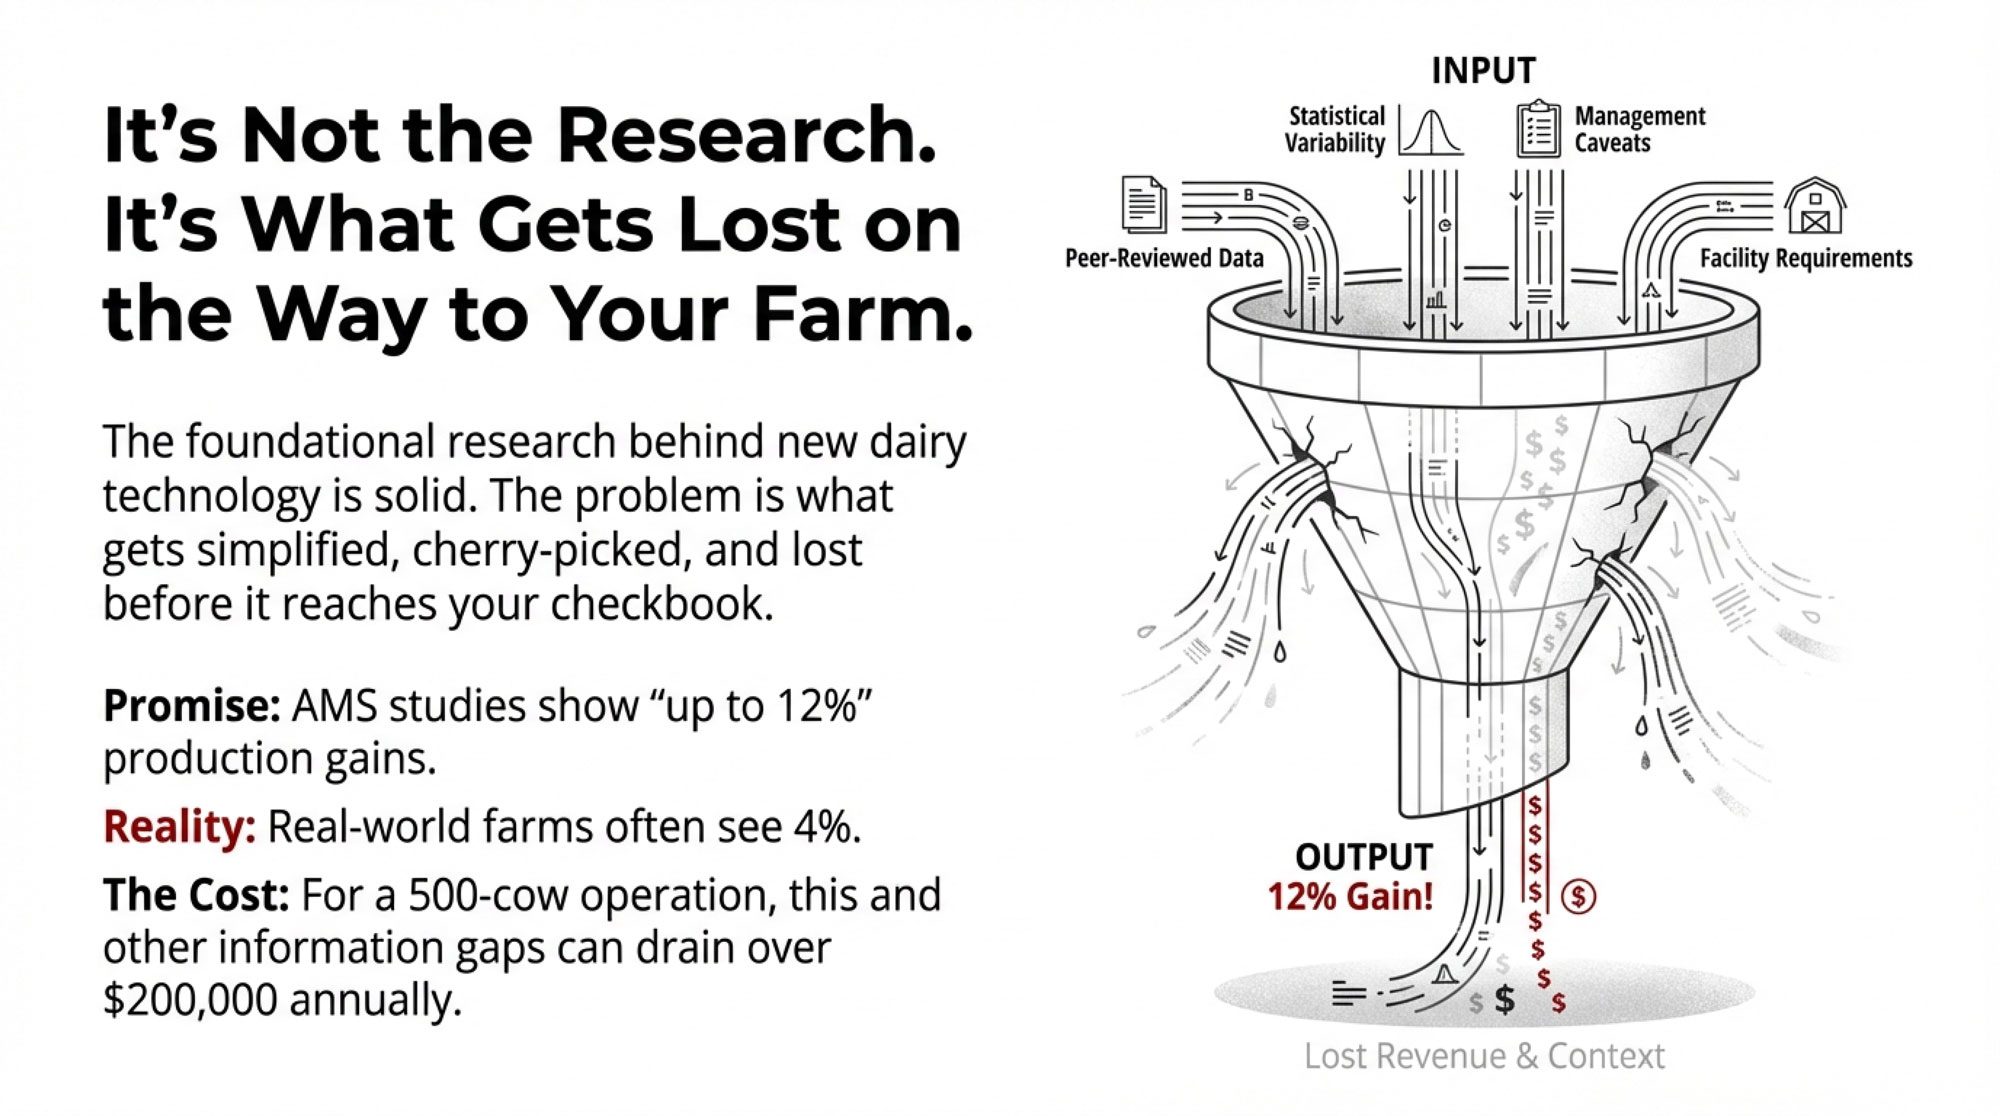
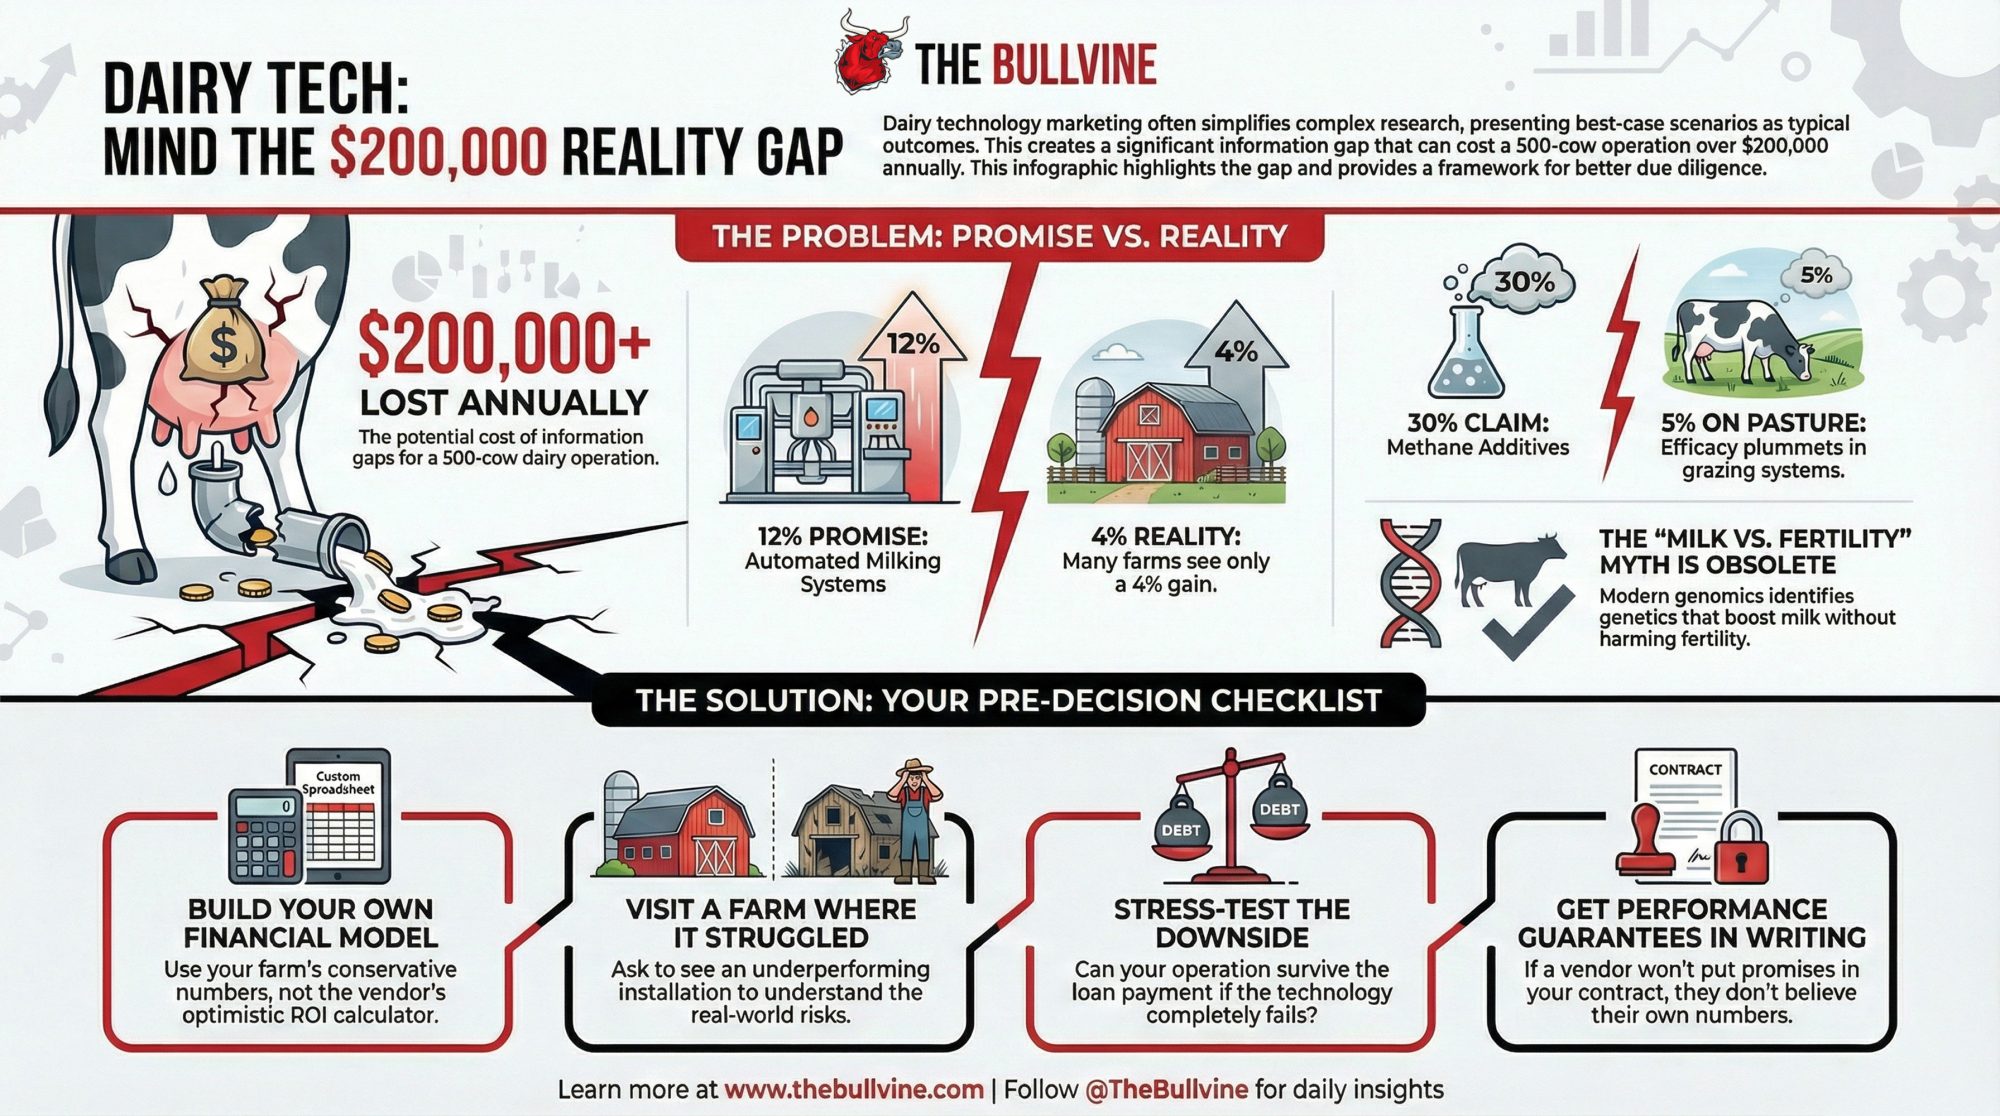
EXECUTIVE SUMMARY: The research behind dairy technology claims is solid—the problem is what gets lost before it reaches your checkbook. AMS studies show ‘up to 12%’ production gains; real farms often see 4%. Methane additives promise 30% reductions; grazing operations get 5%. The milk-fertility trade-off everyone accepts? Genomic research shows it’s an oversimplification costing you progress. Add it up: these gaps can drain $200,000+ annually from a 500-cow operation. If you’re using vendor ROI calculators to plan your debt service, you’re not planning—you’re gambling. Here’s the full picture, plus an 8-point framework to protect your next major investment.

I had a chat with a Wisconsin dairy producer not long ago—let’s call him Dave—who’d done what most of us would consider solid homework before signing papers for a four-robot milking system back in 2022. The dealer had shown him university research claiming 10-12% production increases. The ROI calculator projected a payback period of under 5 years. A neighbor couldn’t stop talking about his new setup.
Eighteen months later, Dave’s 380-cow operation had boosted production by about 4%. Not a failure—but barely a third of what he’d built his financial projections around. Labor savings materialized, though not quite as dramatically as he’d anticipated. And that fetch cow situation? It ate up more management time than anyone had mentioned during the sales process.
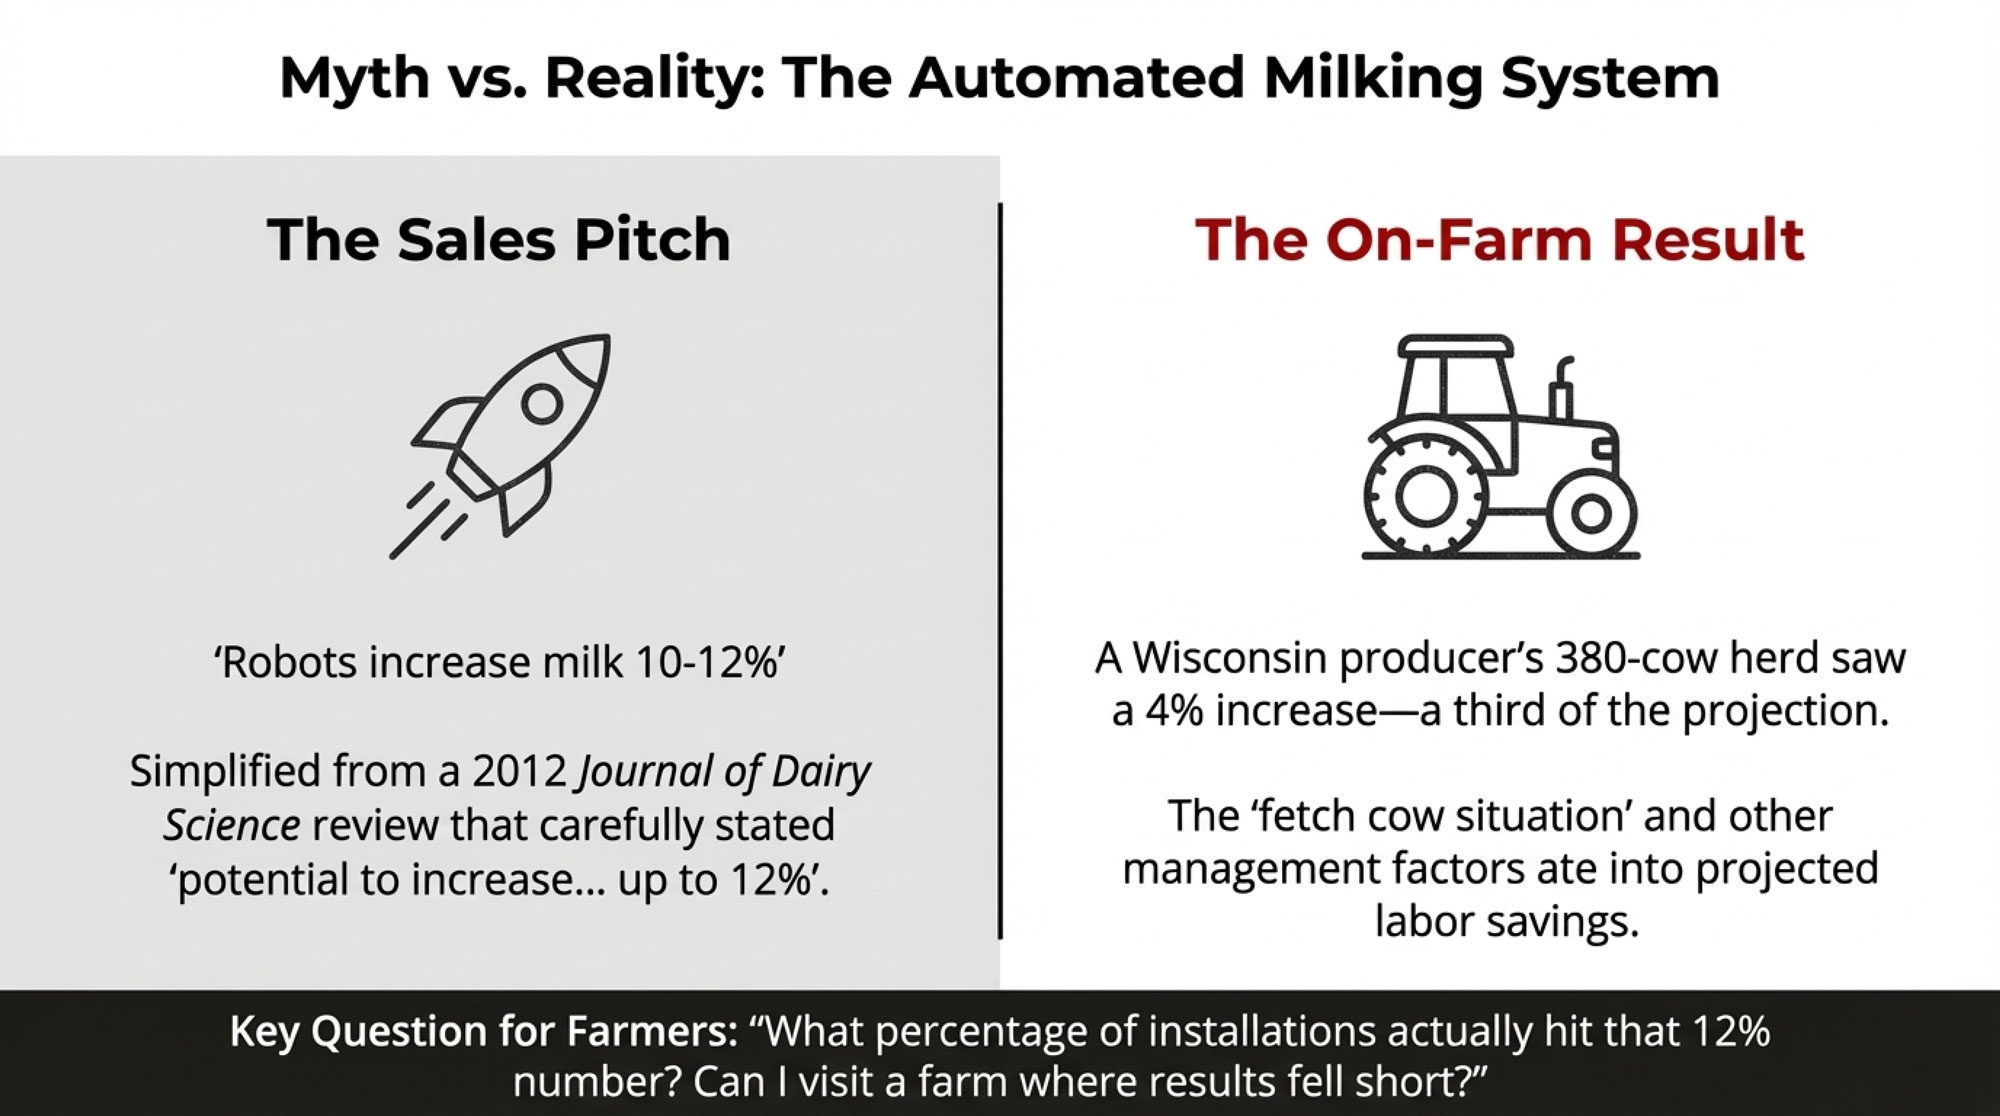
“I don’t regret the decision,” he told me. “But I wish someone had shown me the full distribution of outcomes instead of just the highlight reel. The research they quoted was real—it just didn’t apply to my situation the way they made it sound.”
His experience resonates with many producers I’ve spoken with over the years.
The Journey Research Takes Before It Reaches Your Kitchen Table
Here’s something worth acknowledging upfront: most of the foundational research behind dairy technology claims is actually pretty solid. The scientists doing this work at places like the USDA’s Animal Genomics and Improvement Laboratory, Wageningen University, and land-grant extension programs across North America are rigorous professionals. They include careful caveats, acknowledge variability, and specify the conditions under which their results apply.
The challenge isn’t the research itself. It’s what happens to that research as it moves through the information pipeline toward farmers making real decisions.
Consider automated milking systems. Back in 2012, Jacobs and Siegford published an influential invited review in the Journal of Dairy Science examining how AMS affects dairy cow management, behavior, and welfare. Their finding? AMS “has the potential to increase milk production by up to 12%.” Notice the careful language—“potential” and “up to.” The same paper explicitly noted that producers may not fully realize these benefits depending on management factors and facility design.
By the time those findings work through extension publications, the hedging softens. By the time it reaches some dealer presentations? The message becomes simply: “Robots increase milk 10-12%.” The asterisks disappear.
Here’s what that looks like in practice:
| What Research Actually Says | What Often Gets Communicated | What You Should Ask |
| “Potential to increase production up to12%” | “Robots increase milk 10-12%.” | “What percentage of installations actually hit that number?” |
| “Results depend on management factors and facility design.” | “Modern systems are plug-and-play.” | “What are the top three reasons farms underperform?” |
| “Mixed outcomes observed across installations” | “Our customers see great results.” | “Can I visit a farm where results fell short?” |
| “Adaptation period affects initial performance.” | “You’ll see improvements quickly.” | “What’s the typical timeline to full productivity?” |
Canadian research has examined gaps between producer perceptions and measured AMS outcomes, and the findings suggest these perceptions don’t always align with reality. That’s critical context for anyone evaluating a major capital investment.
The Real Cost of the Information Gap
This naturally raises a question: what’s the actual cost when decisions get made on incomplete information?
I spent some time working through the economics, and the numbers are larger than I initially expected.
The Council on Dairy Cattle Breeding released their Net Merit 2025 revision earlier this year, adjusting weights for feed efficiency, component-based milk pricing, and fertility based on updated economic values. For operations still using older selection approaches, the cumulative difference in genetic progress can be substantial. Canadian producers using LPI face similar recalibration questions—the trait weightings don’t align perfectly with Net Merit, which means the “best” bull on one index may not rank the same way on the other. In Canada, where the LPI heavily weights conformation, a top-ranking bull might fail the Net Merit ‘Economics-First’ test for a commercial operation focused solely on component-weighted milk checks.
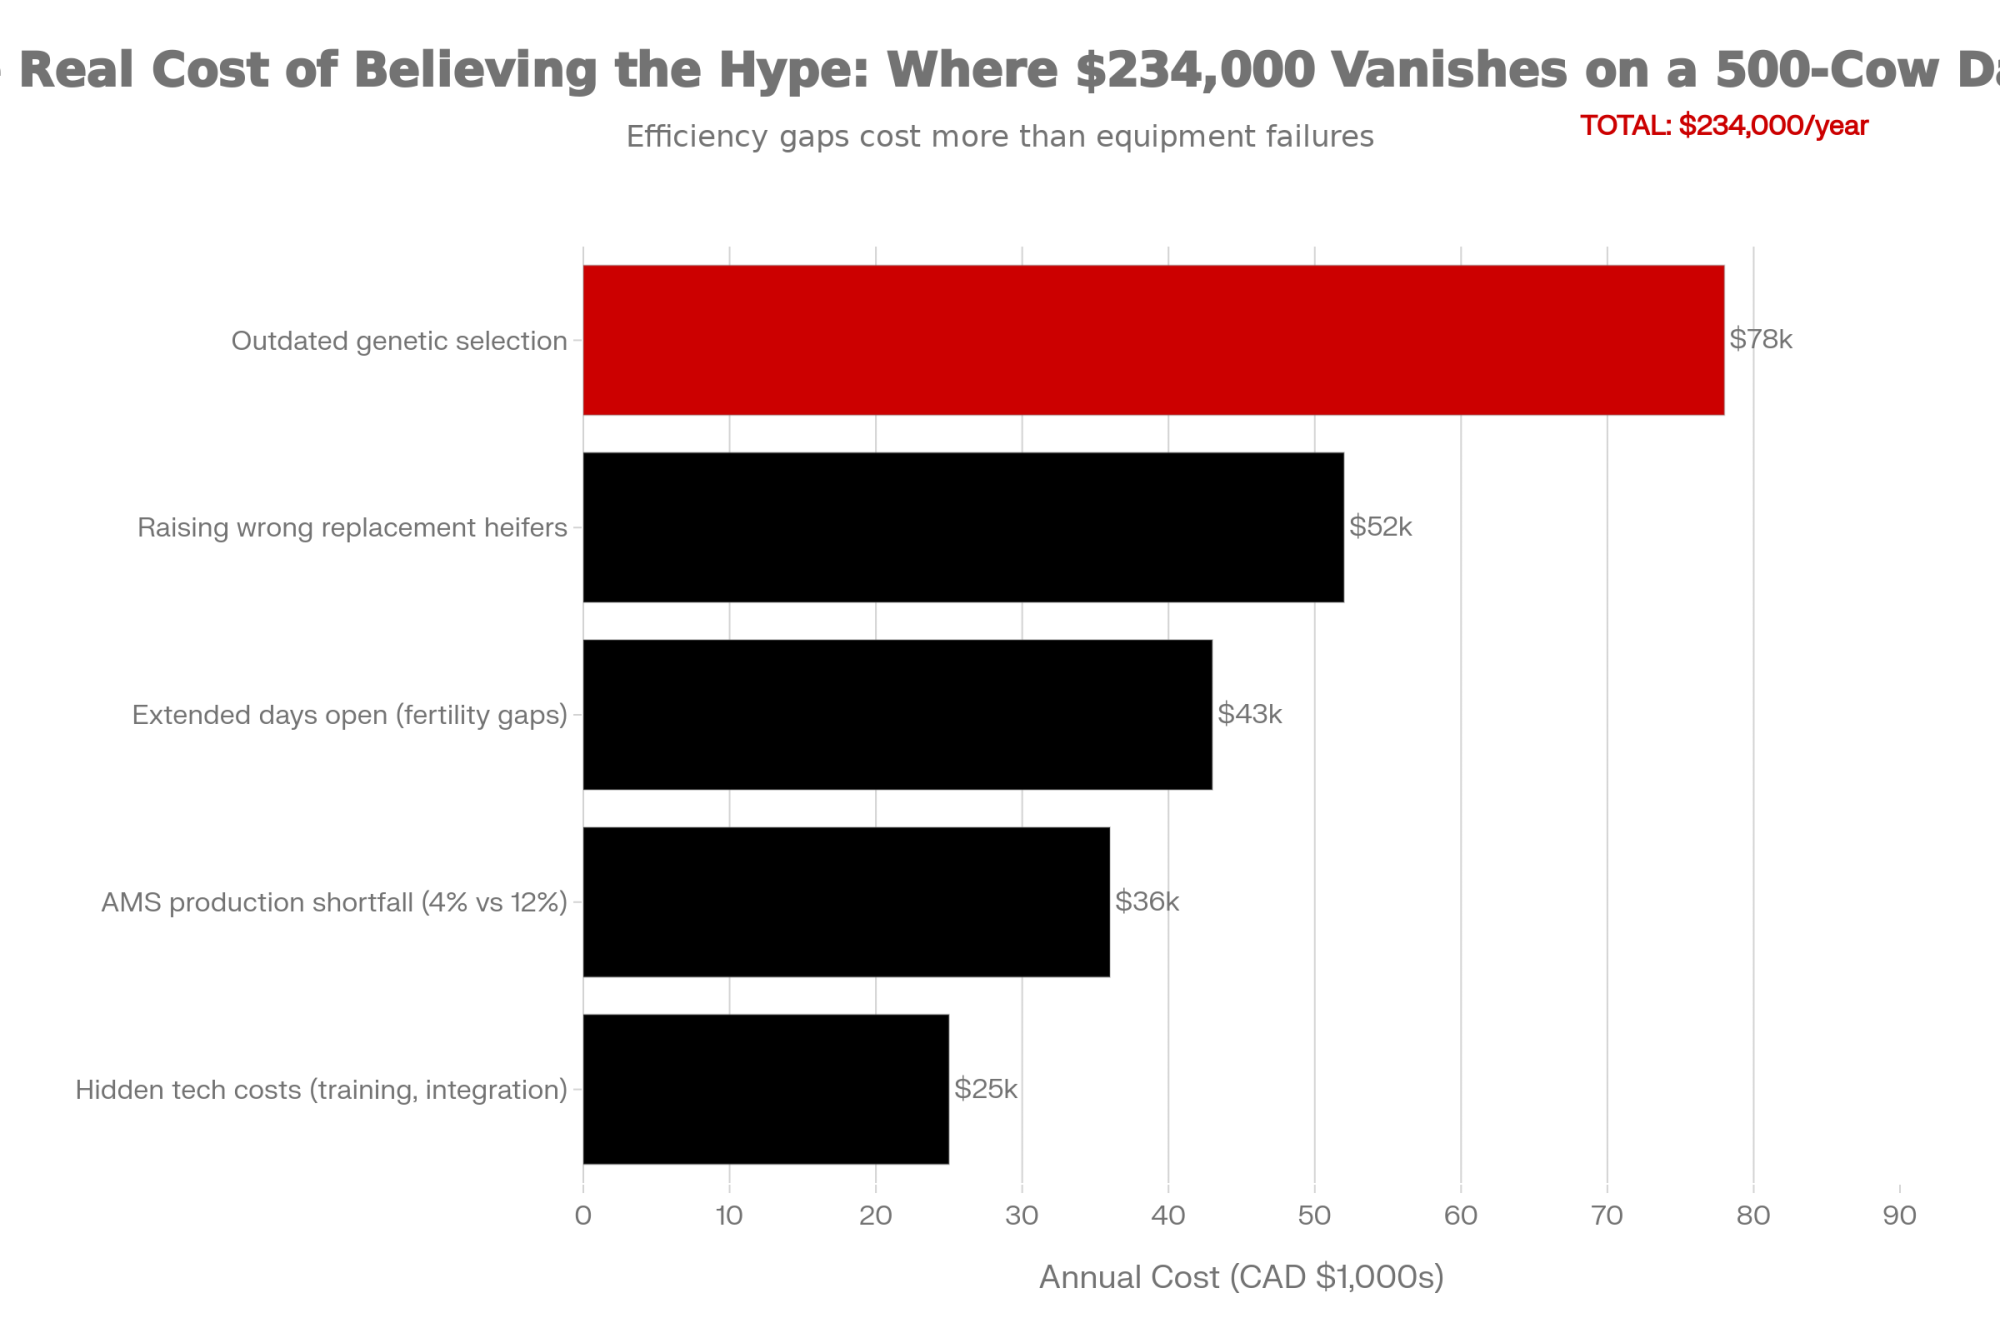
When you add up the various ways outdated approaches cost operations money—from raising replacement heifers that genomic testing would have identified for beef-on-dairy programs, to extended days open from breeding strategies that don’t leverage current fertility data—the conservative total for a 500-cow operation can approach $200,000 or more annually.
Now, I want to be clear: while individual components draw from CDCB and university research, this aggregate estimate represents one analytical framework. Your results depend on current practices, market conditions, and factors specific to your operation. But the magnitude? That demands serious attention.
And if you’re using a vendor’s ROI calculator to plan your 10-year debt service, you aren’t planning—you’re gambling.
What the Genomics Revolution Actually Tells Us About Trade-offs
This gap between research and reality isn’t limited to hardware, such as robots. It’s arguably more dangerous when it’s invisible—locked inside the genetics of your herd, compounding quietly for years before you realize you’ve been leaving money on the table.
The conventional wisdom I still hear at producer meetings goes something like this: “If you want high milk, you’re going to sacrifice fertility and health. That’s just the trade-off.”
Here’s where it gets interesting—that’s not quite right. Or more precisely, it’s an oversimplification that may be costing some operations genetic progress they don’t even know they’re missing.
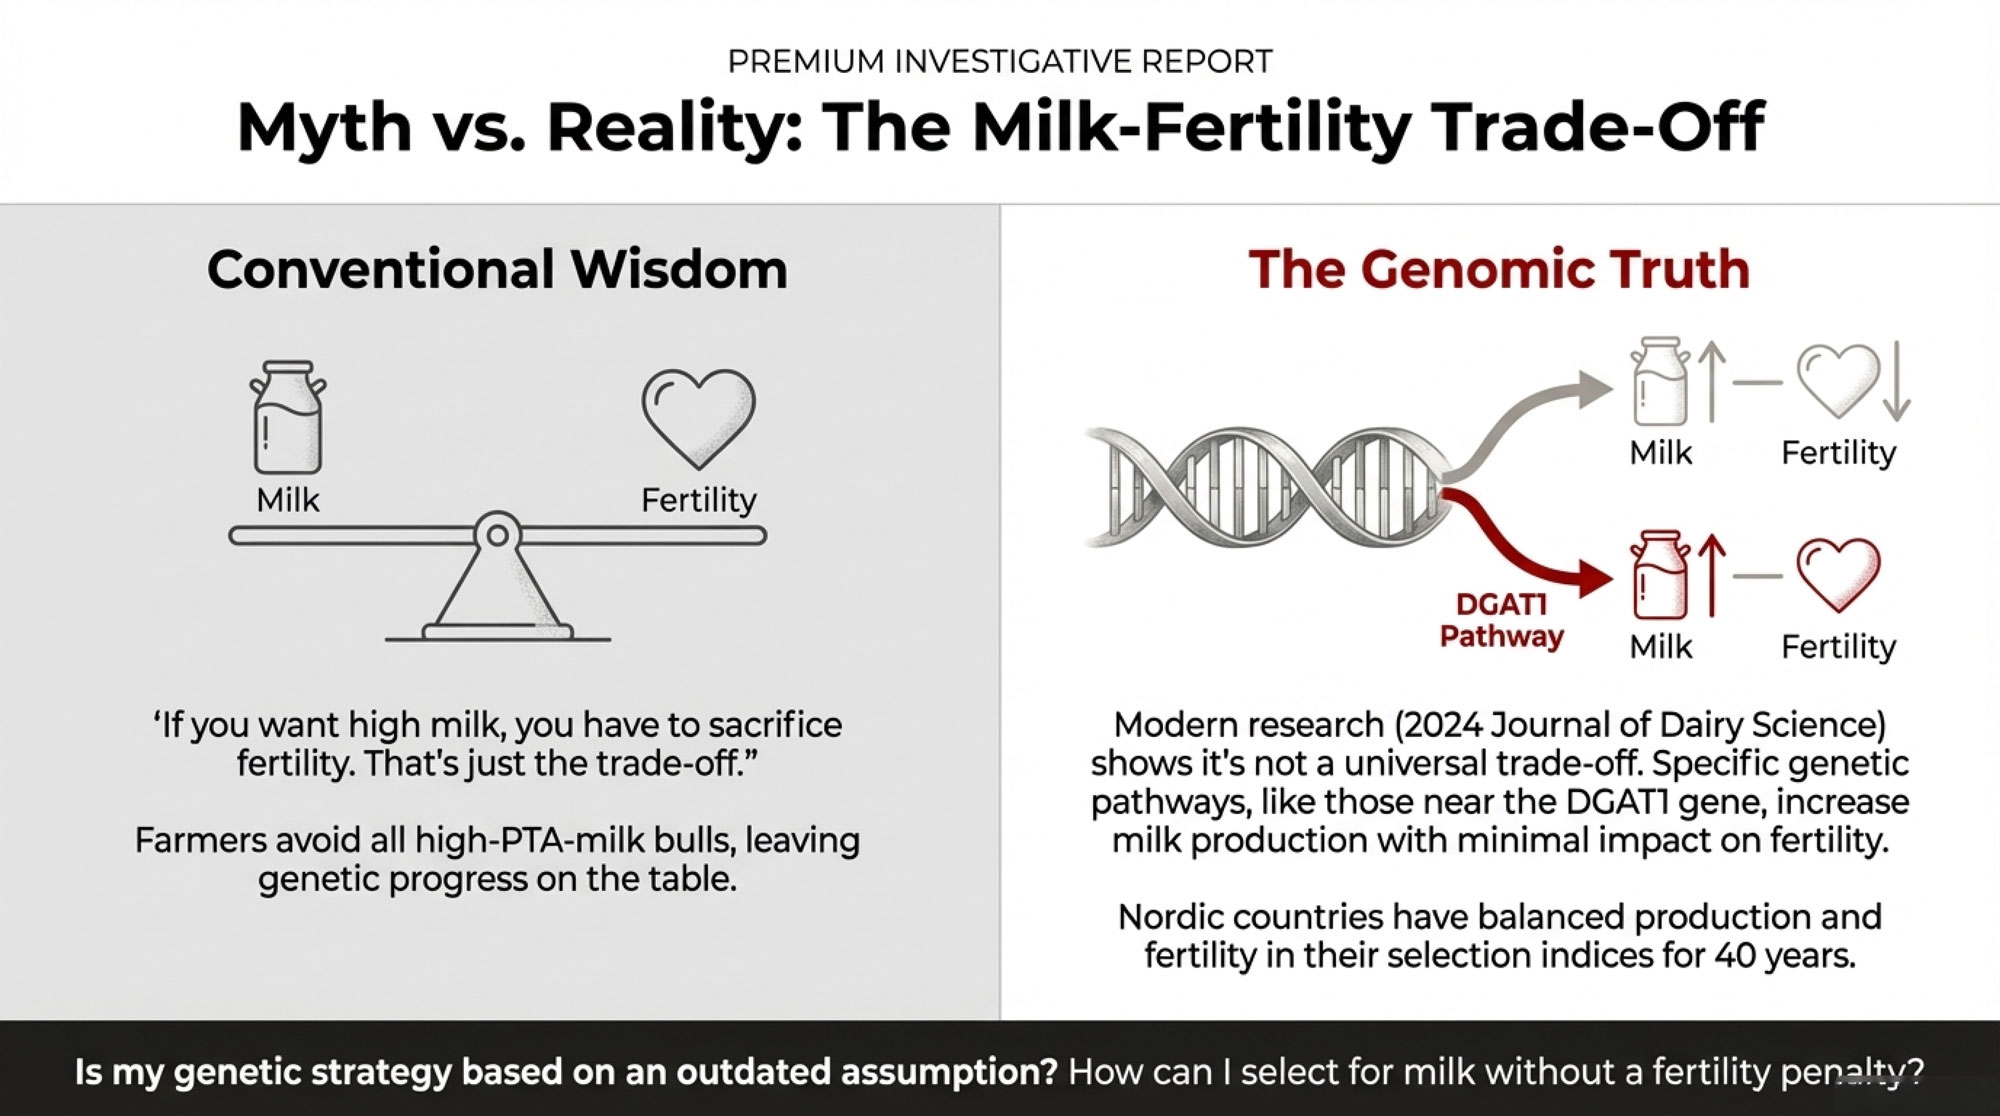
A 2024 study in the Journal of Dairy Science used archetypal clustering to trace which specific genetic variants affect both milk production and fertility. The researchers identified distinct genetic pathways with varying impacts on the production-fertility relationship.
Some genetic variants do show the expected trade-off—they boost milk while hurting fertility. But other variants, particularly those near the DGAT1 gene, increase milk production through completely different biological pathways. Hoard’s Dairyman explained how a mutation in DGAT1 affects fatty acid assembly—the energy the cow would have used for fat production becomes available to support milk yield instead. These variants show minimal impact on reproductive traits.
What does this mean practically? Bulls carrying high-production genetics from the non-antagonistic pathways can deliver milk improvement without the fertility penalty. Breeders who categorically avoid all high-PTA-milk bulls based on the simplified “milk hurts fertility” assumption are leaving genetic progress on the table. This is why we argue that balance is the only sustainable genetic strategy.
The Nordic countries recognized this more than 40 years ago. By incorporating fertility into their selection indices and identifying bulls where production alleles came from pathways that don’t compromise reproduction, they maintained strong genetic fertility levels while continuing to make production progress. Dairy Global reported that Nordic Holstein bulls remain at a higher genetic level for fertility than many other populations.
The research has been available for years. The industry just hasn’t caught up.
A Real-Time Example: Methane Tech ROI and the 5% vs 30% Problem
The same pattern—solid research, simplified messaging, context-dependent results—is playing out right now with methane reduction technology. And this one’s worth watching closely because sustainability premiums and regulatory pressure are raising the stakes fast. EU Green Deal requirements are pushing European processors toward verified emissions reductions, and that pressure will eventually cross the Atlantic.
3-NOP, marketed as Bovaer by Elanco, received FDA approval in 2024 as a methane-reducing feed additive. You’ve seen the headlines: “Reduces methane emissions by about 30% in dairy cows.”
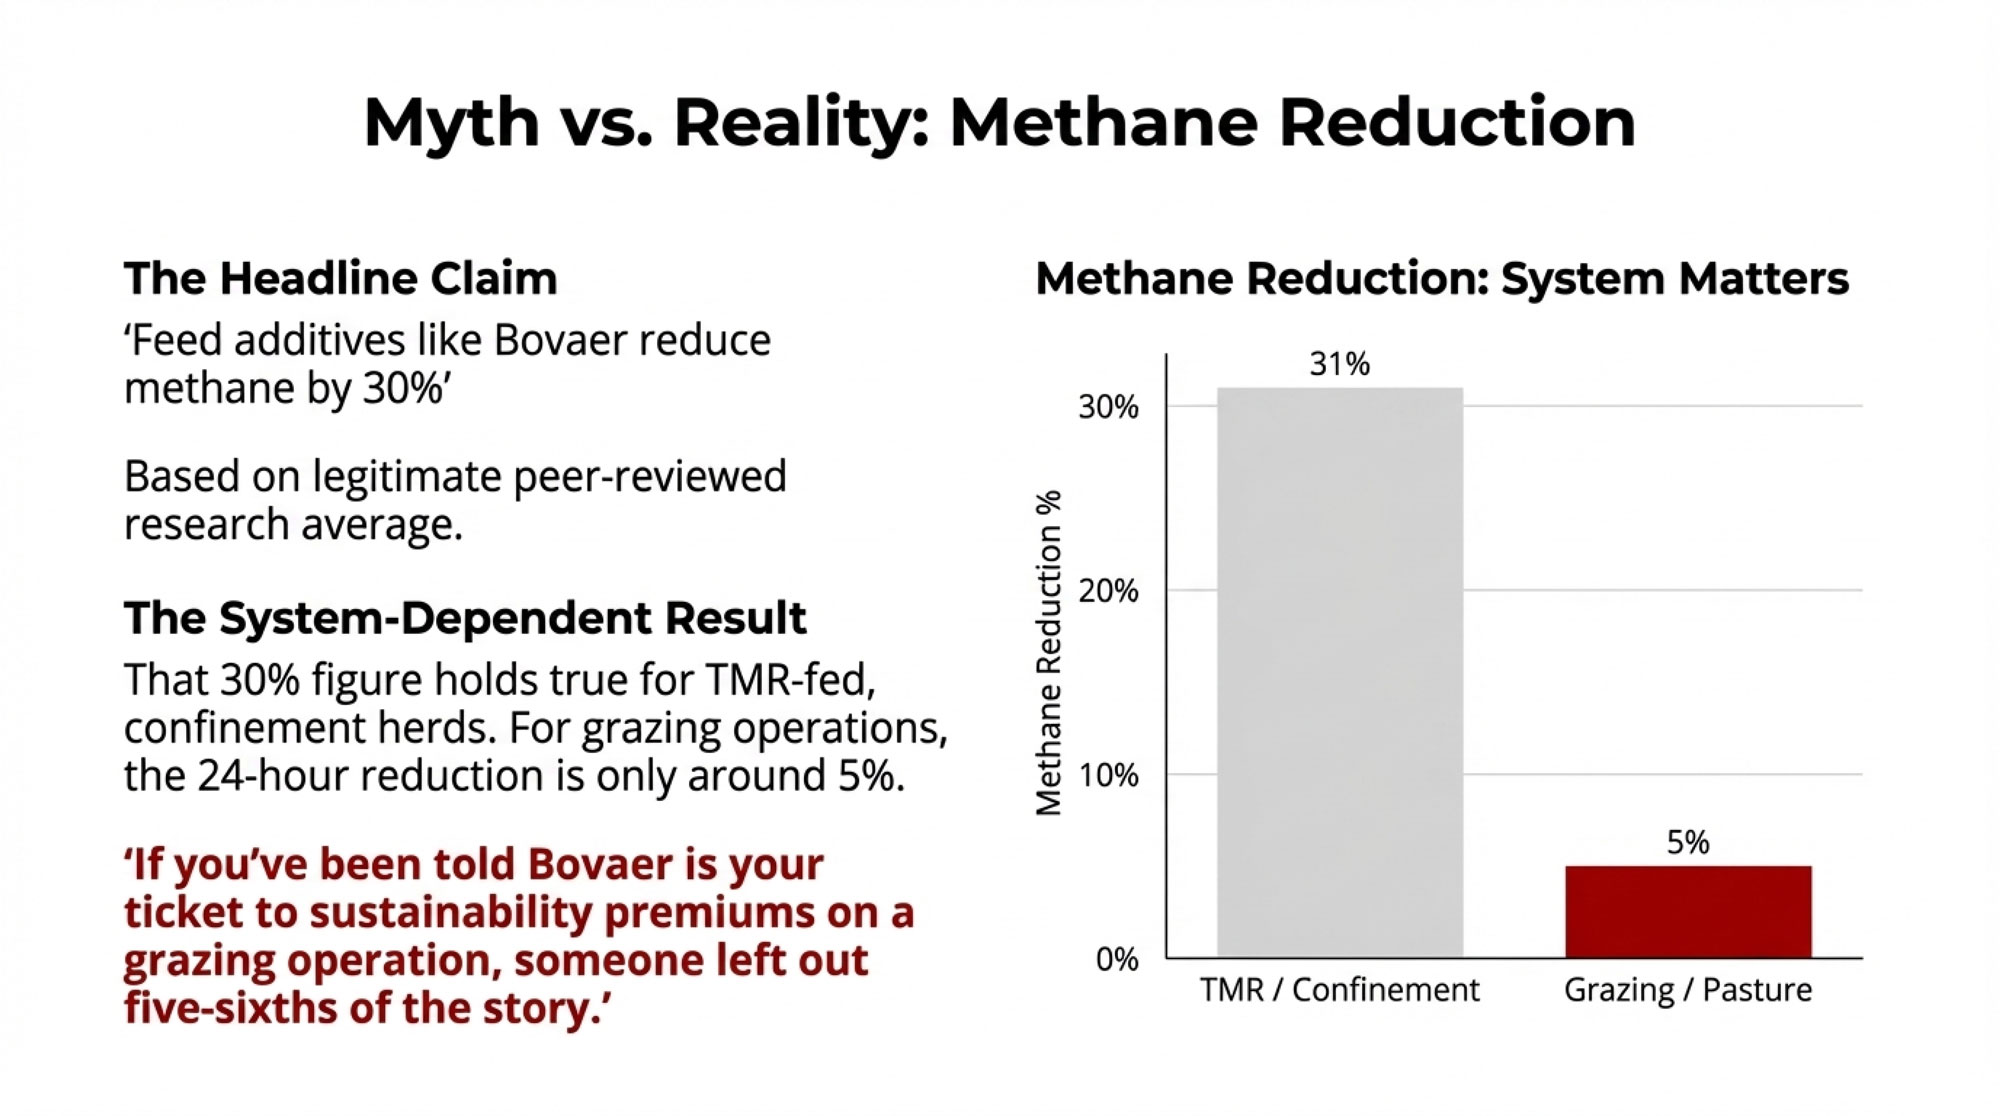
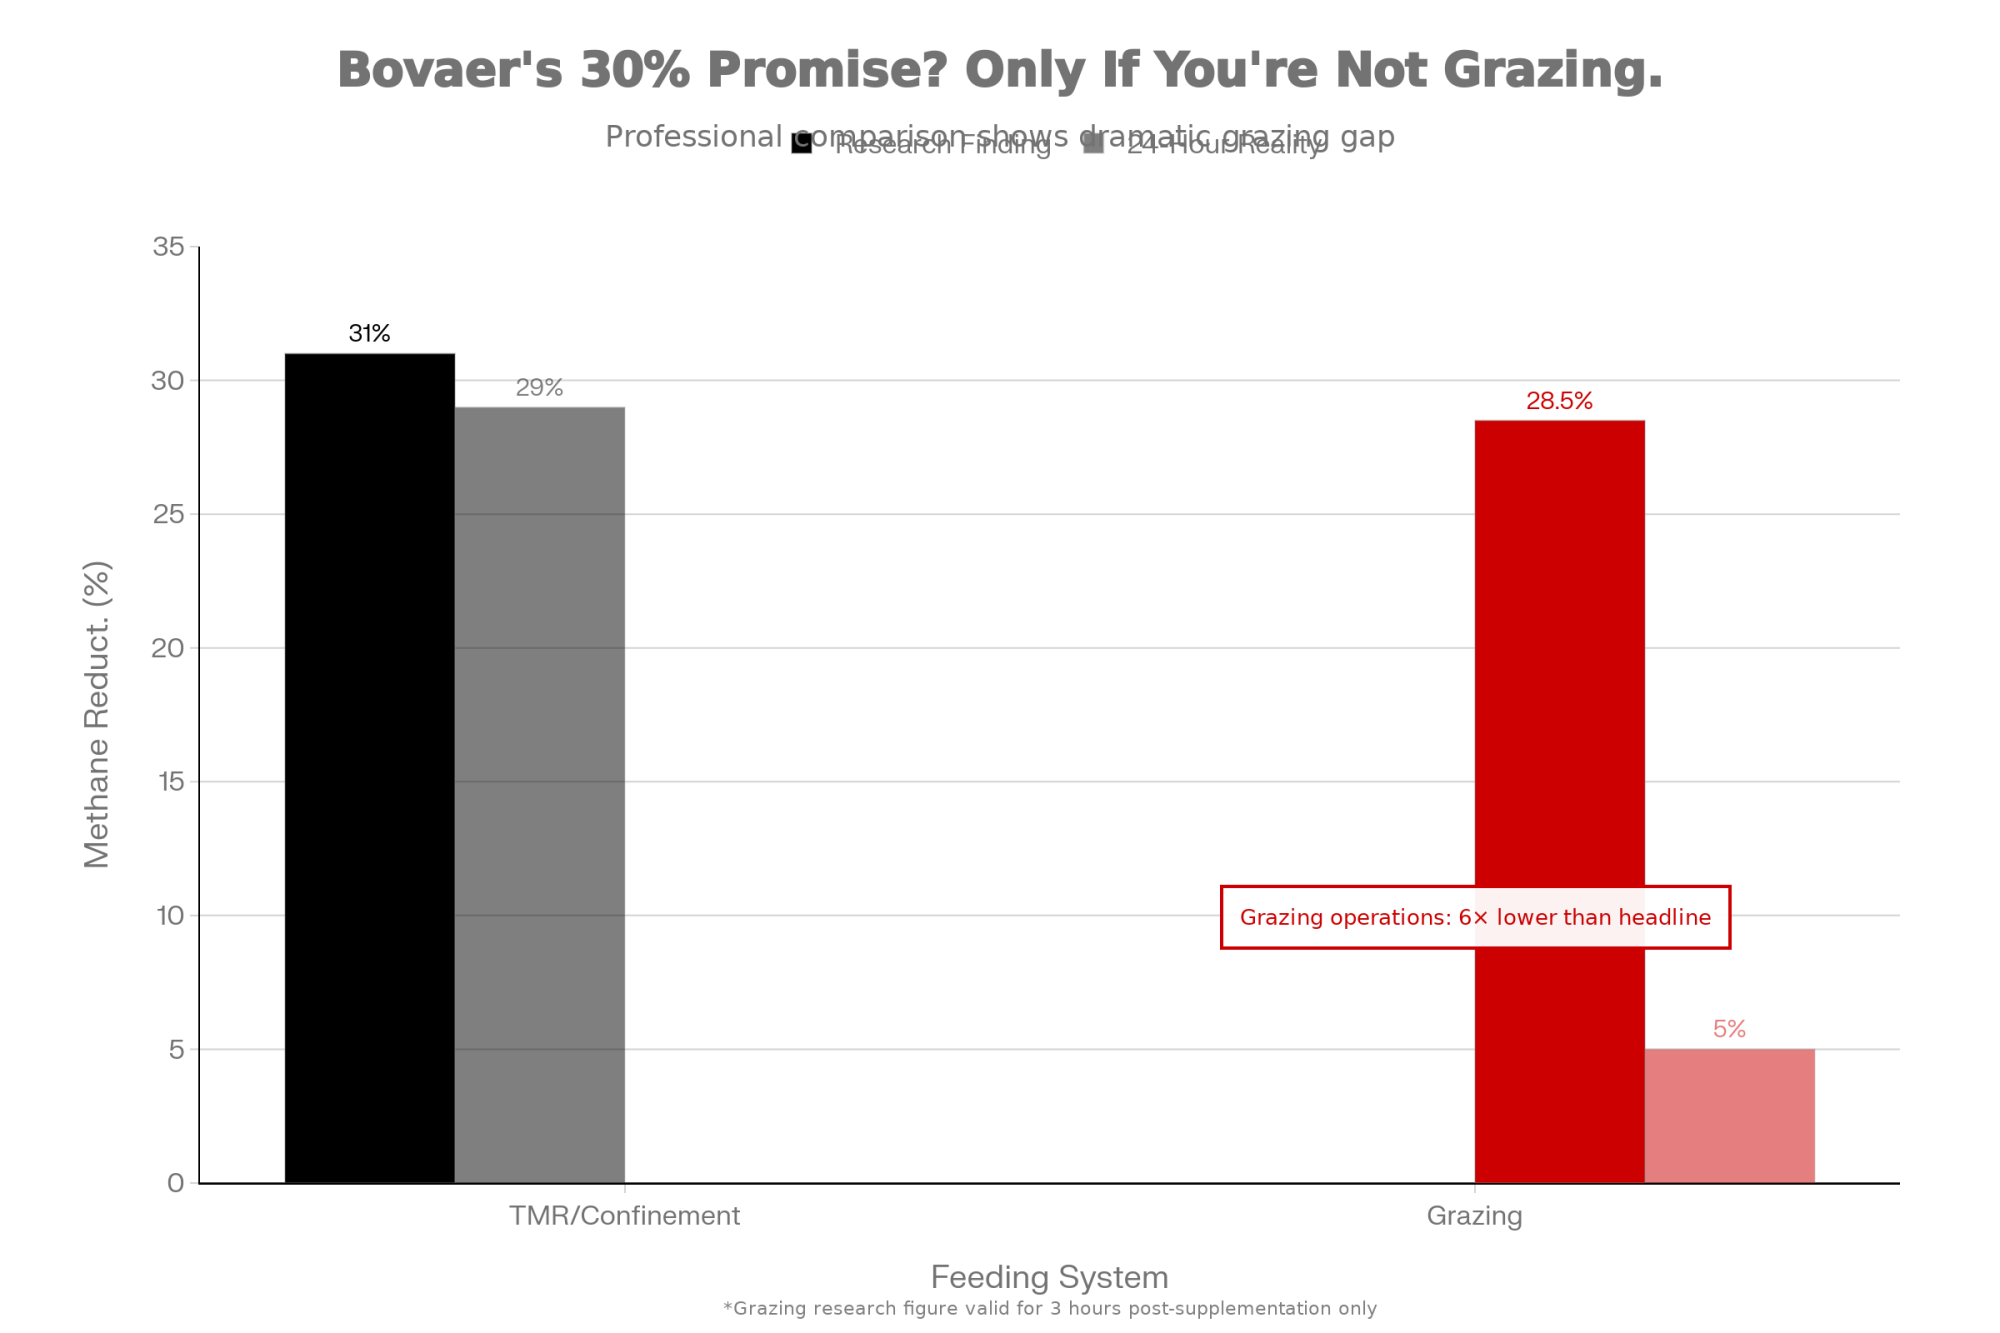
The peer-reviewed research is legitimate. A 2023 meta-analysis by Kebreab and colleagues in the Journal of Dairy Science found 3-NOP reduced methane by about 31% on average.
But here’s what doesn’t make the headlines: over 70% of the total variability in outcomes was due to heterogeneity across studies. That 31% is an average masking substantial variation.
If you’ve been told Bovaer is your ticket to sustainability premiums on a grazing operation, someone left out five-sixths of the story.
| Feeding System | Research Finding | What It Means For You |
| TMR (confinement) | Up to 30%+ reduction | Additive stays in feed continuously; full efficacy possible |
| Grazing (twice-daily supplementation) | ~5% reduction over 24 hours | Methane drops 28.5% for 3 hours post-supplementation, then returns to baseline |
That grazing data comes from a 2024 Teagasc trial in Ireland, published by Costigan and colleagues in the Journal of Dairy Science. For grazing operations, the economic math is completely different than the headline suggests.
What farmers hear: “Reduces methane 30%.”
What they need to know: “Results range from 5-30%+ depending on feeding system, and the economics only work if carbon credits or sustainability premiums in your market cover the additive cost.”
A Practical Approach to Dairy Technology Investment

After talking with producers who’ve navigated major technology decisions—some successfully, some expensively—certain patterns emerge.
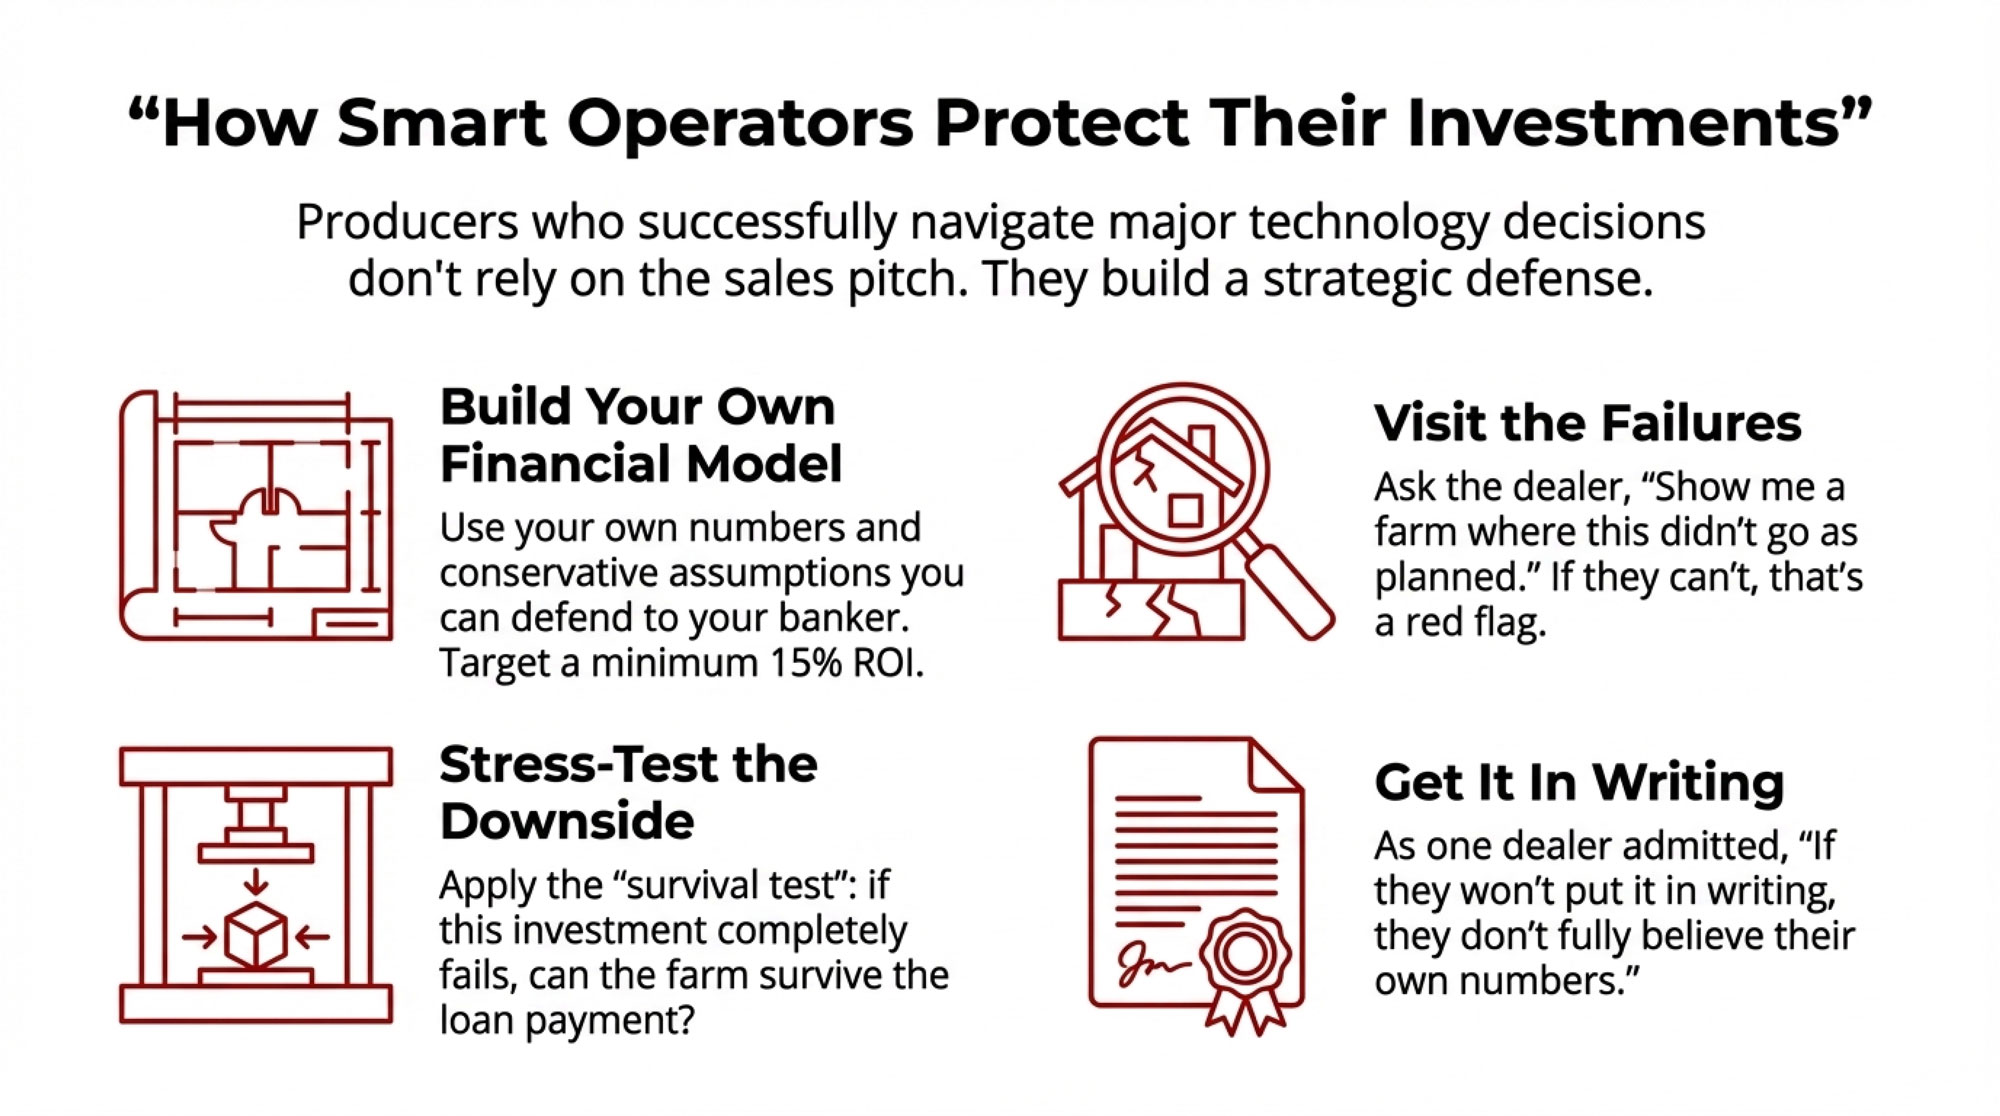
They build their own financial models. Not the vendor’s calculator—their own, using assumptions they can defend to their banker at 2 AM when they can’t sleep.
| Cost Category | Vendor Calculator Assumption | Real Farm Cost | Your Gap ($/year) |
| Equipment price | $250,000 | $250,000 | $0 |
| Installation | Included | 50-100% of equipment cost | $75,000 |
| Training & learning curve | “Minimal” | 6-12 months lost productivity | $18,000 |
| Labor replacement | $15/hour × 2 FTE | $22/hour skilled tech (new hire) | $14,560 |
| Facility modifications | Not mentioned | Electrical, HVAC, fetch cow area | $32,000 |
| Integration support | Free first year | $4,500/year ongoing | $4,500 |
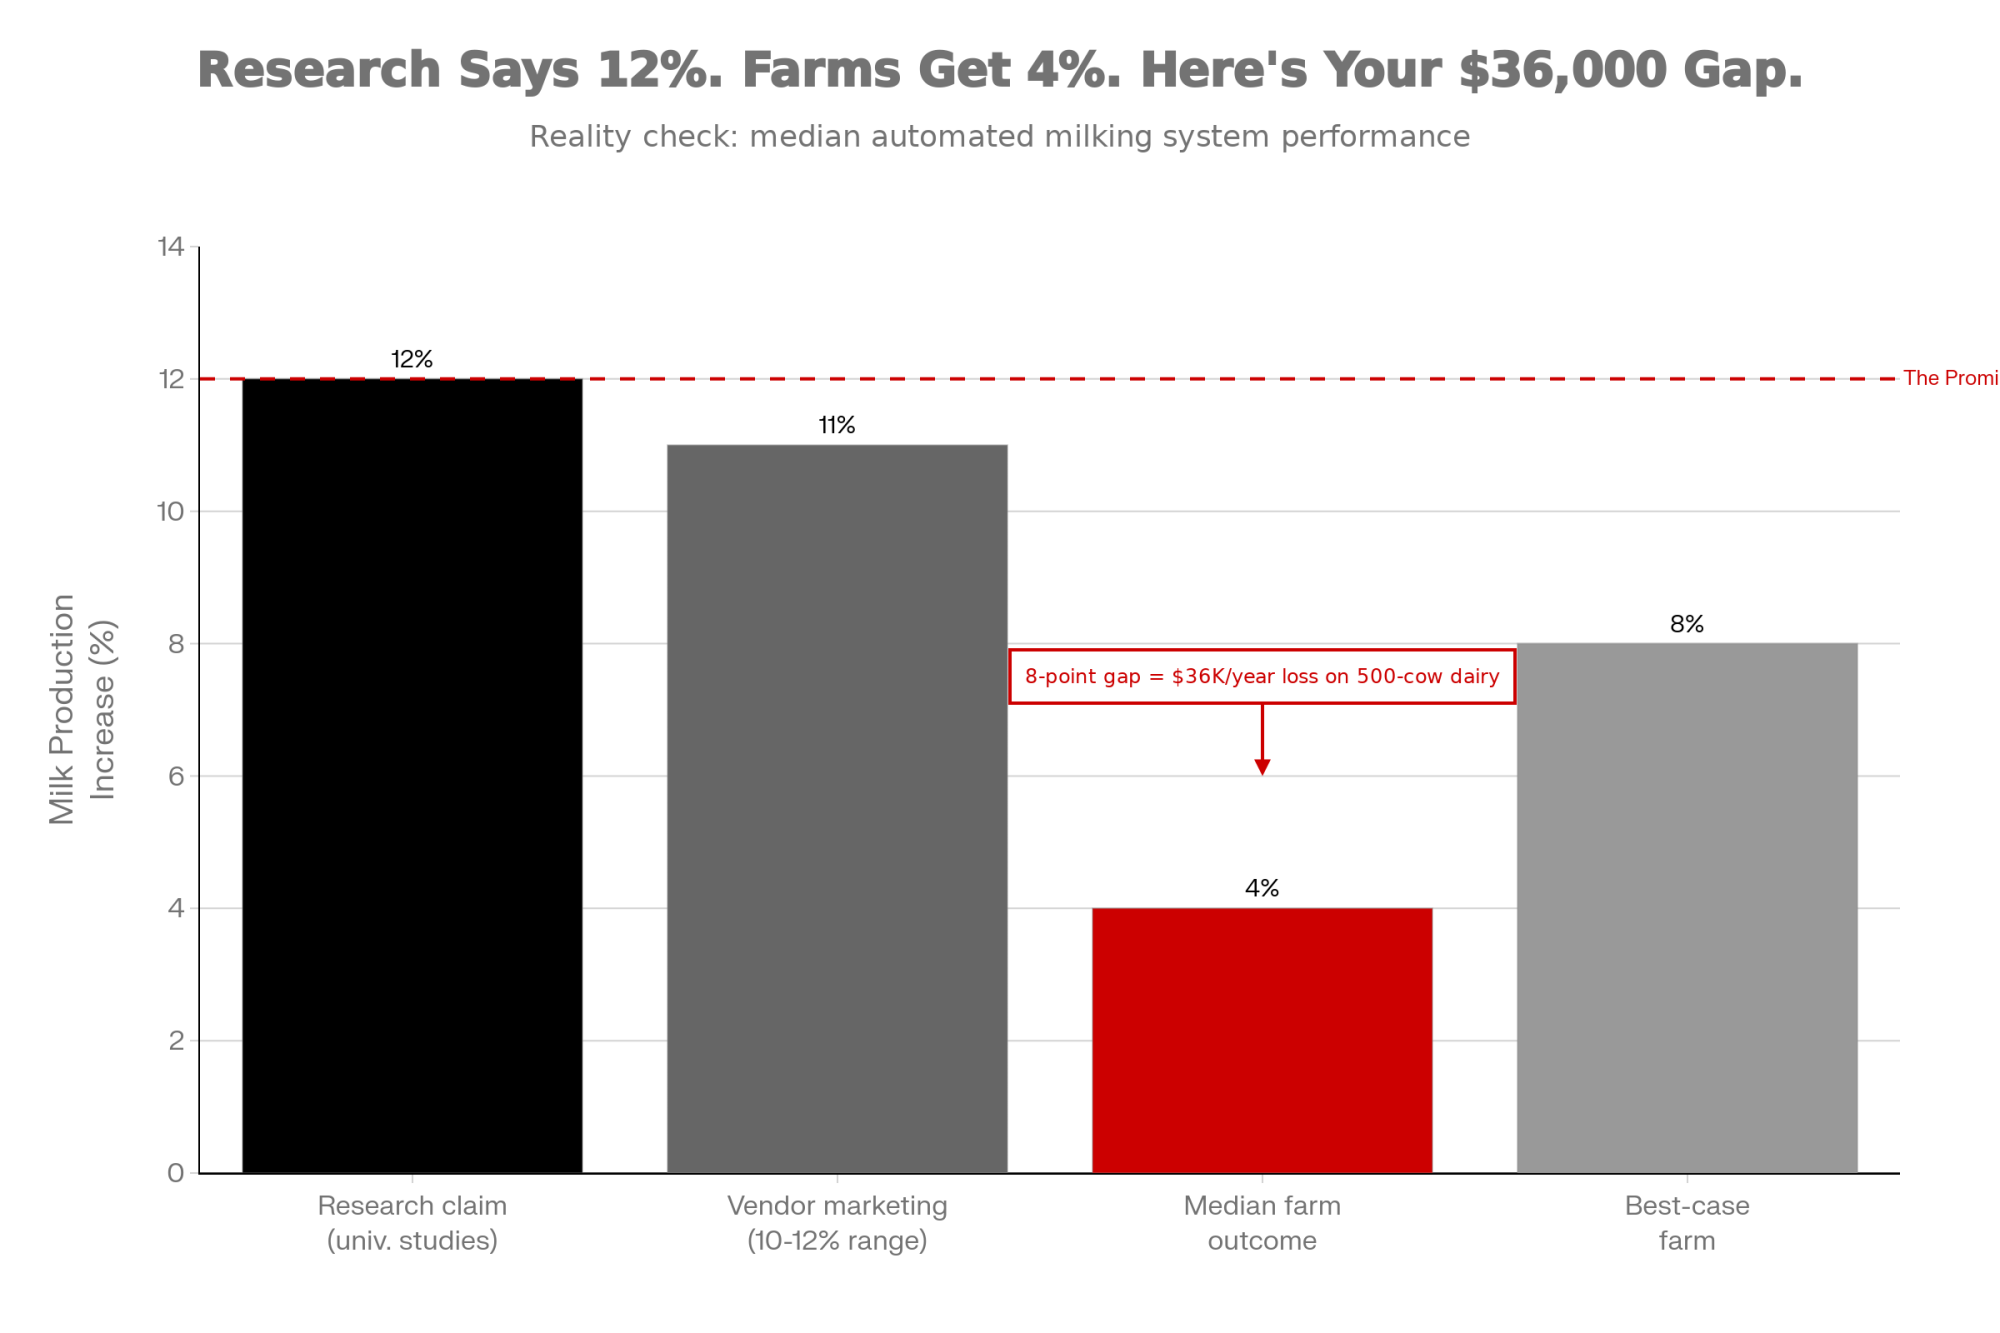
| Production shortfall | 10-12% gain | 4% actual (median farm) | $36,000 |
| TOTAL HIDDEN COSTS | — | — | $180,060 |
Financial advisors working with dairy operations commonly recommend targeting a minimum 15% ROI to justify the risk and management complexity. Your model should include the costs that get glossed over: installation expenses (often 50-100% of equipment cost for robotics), learning curve losses during adaptation, training fees, and the wage differential between the labor you’re replacing and the skilled technical labor you’ll need.
They visit farms where the technology struggled. When a dealer offers tours, most people want success stories. Sharp buyers ask: “Show me a farm where this didn’t go as planned. What went wrong?”
If a vendor can’t provide that reference, ask yourself why.
They stress-test the downside. One California producer applies what she calls the “survival test”: “If this completely fails, can our farm survive the loan payment while we figure out Plan B? If the answer is no, the potential upside doesn’t matter.”
They get promises in writing. Minimum production guarantees. Response time commitments. Performance clauses.
As one equipment dealer candidly told me: “If they won’t put it in writing, they don’t fully believe their own numbers.”
When the Process Works
What’s encouraging is that a thorough evaluation often leads to genuine adoption success.
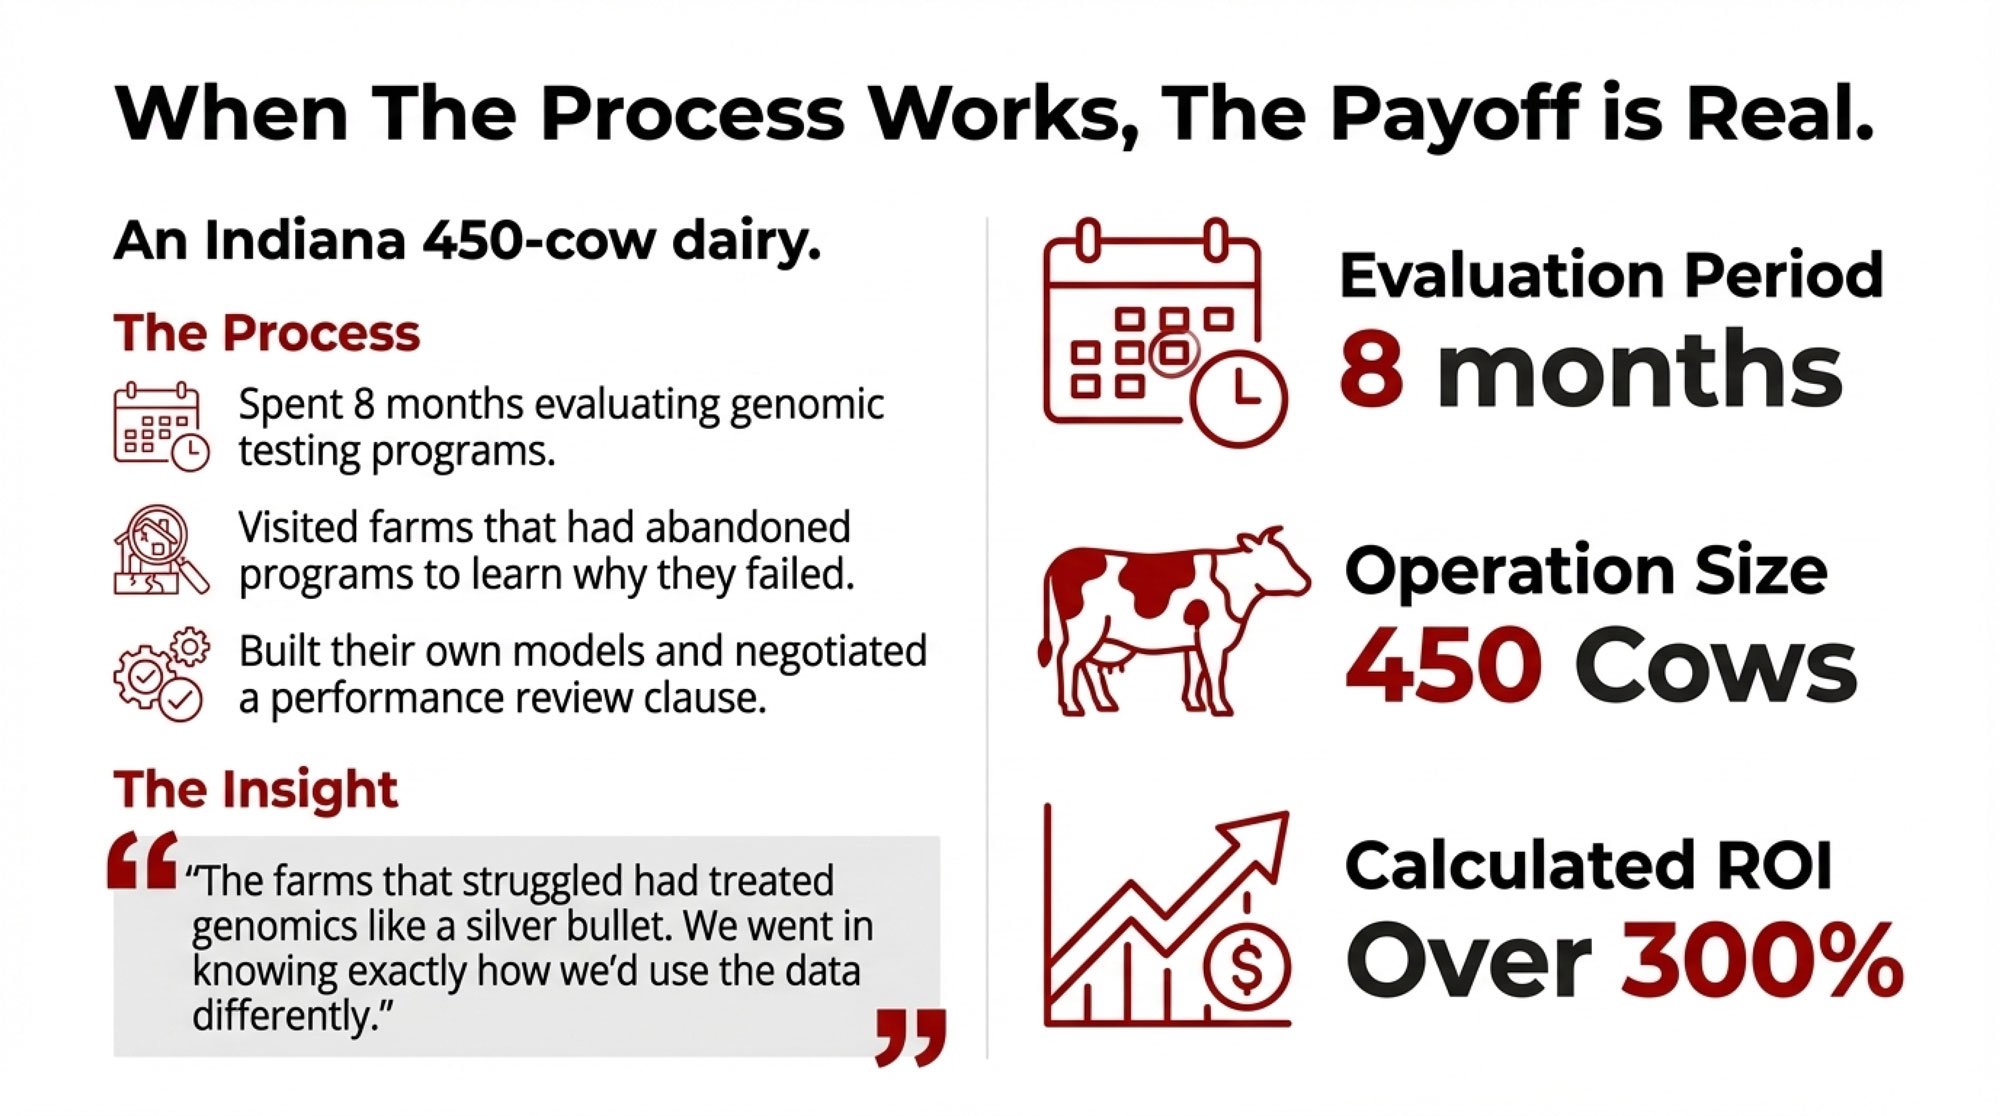
An Indiana operation spent eight months evaluating genomic testing programs before committing to comprehensive heifer screening on their 450-cow dairy. They visited farms that had abandoned programs after disappointing results. They built their own models. They negotiated a performance review clause.
“The farms that struggled had treated genomics like a silver bullet,” the producer told me. “They tested everything but didn’t change their breeding or culling strategies based on results. We went in knowing exactly how we’d use the data differently.“
Two years in: reduced replacement costs, improved conception rates, shortened genetic lag. Calculated ROI: over 300%.
The difference wasn’t whether they adopted technology. It was how.
Your Pre-Decision Checklist
Before signing for any major technology investment:
| Decision Criterion | Why It Matters | ✓/✗ |
|---|---|---|
| Visited underperforming installations | Dealers show successes; you need failure modes and frequency | ☐ |
| Built independent financial model | Vendor calculators exclude hidden costs that determine survival | ☐ |
| ROI exceeds 15% (realistic scenario) | Below 15% doesn’t justify risk + complexity for most operations | ☐ |
| Operation survives if tech completely fails | If no, potential upside doesn’t matter—one failure ends the farm | ☐ |
| Claims validated with independent sources | University extension ≠ vendor-funded studies; verify independently | ☐ |
| Hidden costs accounted for | Installation (50-100%), training, facility mods—often doubles true cost | ☐ |
| Payback under 5-7 years (conservative) | Longer = higher risk of obsolescence, market shifts, refinancing stress | ☐ |
| Performance guarantees in writing | If they won’t contract it, they don’t believe their own numbers | ☐ |
If you can’t honestly check all of them, slow down. There’s rarely a penalty for taking another month.
The Bottom Line
The gap between research and practice isn’t something farmers created; it’s fallen to them to navigate. Publication bias, constrained extension services, the natural tendency for complex findings to get simplified—these won’t change quickly.
What can change is how you approach decisions.
A Minnesota producer who’s successfully adopted several technologies over the past decade put it this way: “I’ve learned to treat every technology pitch with healthy skepticism. The claims might be technically true, but the version that applies to my specific farm is probably less impressive than the headline. Once you accept that going in, you can make much better decisions.”
The research is solid. The scientists are rigorous. The caveats they provide are valuable.
The question is whether that complete picture makes it to your kitchen table before you sign the check.
Your move: Before your next genetics meeting or equipment conversation, pick one claim you’ve heard recently and trace it back to the original research. The gap between headline and reality might change how you approach your next capital decision.
KEY TAKEAWAYS
- 12% in research, 4% on farms: AMS production claims come with asterisks that vanish before reaching your kitchen table. Demand outcome distributions—not highlight reels.
- 30% vs 5%—system matters: Methane additives deliver in TMR but fall flat on pasture. If you’re grazing, someone left out five-sixths of the story.
- The milk-fertility “trade-off” is costing you: Some genetic pathways boost production without hurting reproduction. Blanket avoidance of high-PTA-milk bulls leaves progress—and money—on the table.
- $200,000+ vanishes annually: Information gaps—outdated genetics, missed beef-on-dairy calls, tech underperformance—drain six figures from a 500-cow operation every year.
- Vendor calculators aren’t due diligence: Build your own model. Visit farms where it failed. Stress-test the downside. Get guarantees in writing. If you can’t check all eight boxes—slow down.
Complete references and supporting documentation are available upon request by contacting the editorial team at editor@thebullvine.com.
Learn More
- The Tech Reality Check: Why Smart Dairy Operations Are Winning While Others Struggle – Master your technology budget by uncovering why total implementation costs run 40% above sticker price, delivering the verified math required to hit a 3.8-year payback period instead of drowning in unforeseen debt.
- Dairy Profit Squeeze 2025: Why Your Margins Are About to Collapse (And What to Do About It) – Secure your long-term margins by navigating 2025’s structural reckoning of tariffs and surging feed costs, arming you with strategic risk management tools to thrive while the rest of the industry faces margin collapse.
- From Saving a Baby’s Life to Transforming Your Dairy Herd: The Gene Editing Revolution Is Here – Revolutionize your herd health by harnessing the CRISPR shift to eliminate billions in mastitis losses, gaining a clear-eyed look at how precise biological edits will soon replace expensive management “band-aids” with permanent solutions.
 Join the Revolution!
 Join the Revolution!
Join over 30,000 successful dairy professionals who rely on Bullvine Weekly for their competitive edge. Delivered directly to your inbox each week, our exclusive industry insights help you make smarter decisions while saving precious hours every week. Never miss critical updates on milk production trends, breakthrough technologies, and profit-boosting strategies that top producers are already implementing. Subscribe now to transform your dairy operation’s efficiency and profitability—your future success is just one click away.


