


Still drenching every cow over 1.2? The latest data says that the blanket rule is costing you more than the propylene glycol.
Picture this. We’re standing at the fresh cow pen, coffee in one hand, ketone meter in the other. A cow reads 1.3 mmol/L on a blood BHB test, she gets flagged as subclinically ketotic, and somebody reaches for the propylene glycol. You know the routine.
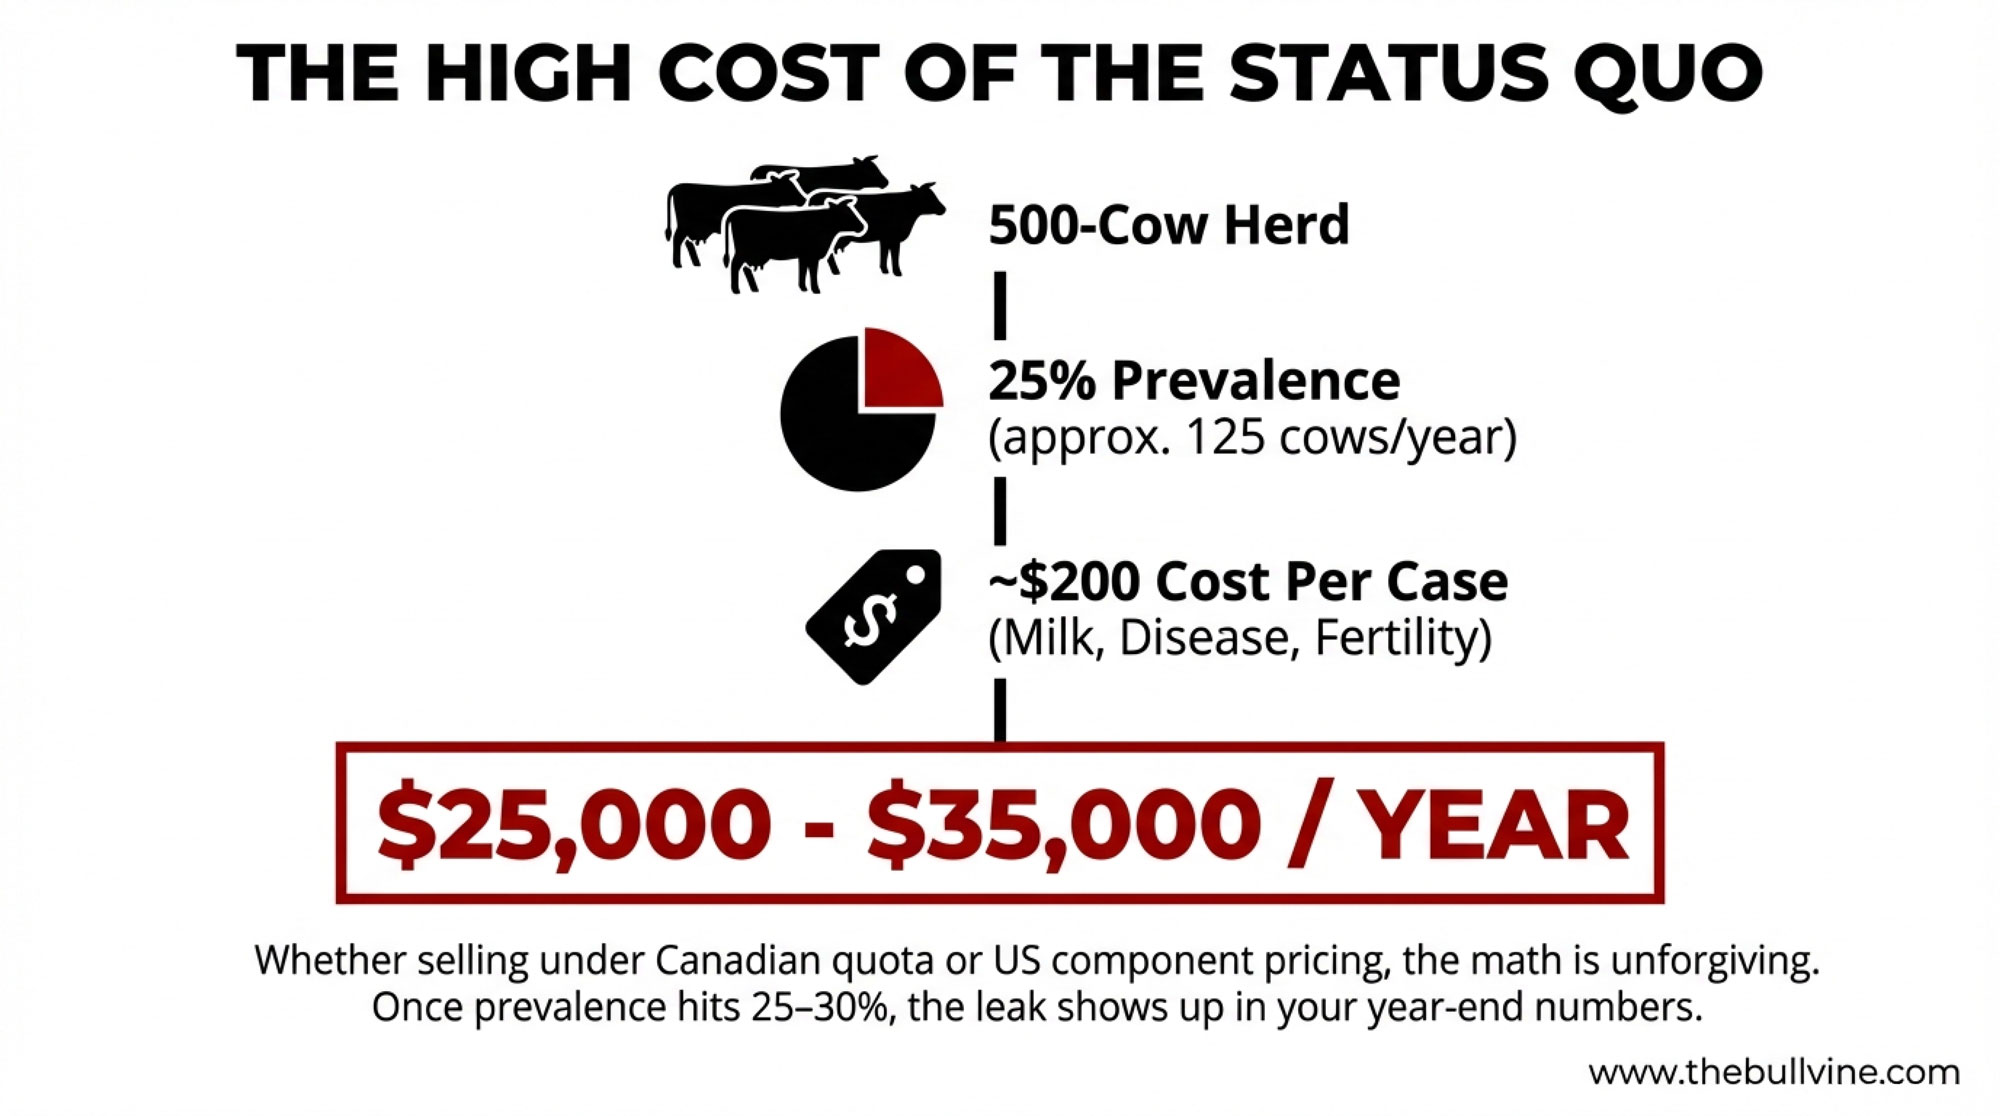
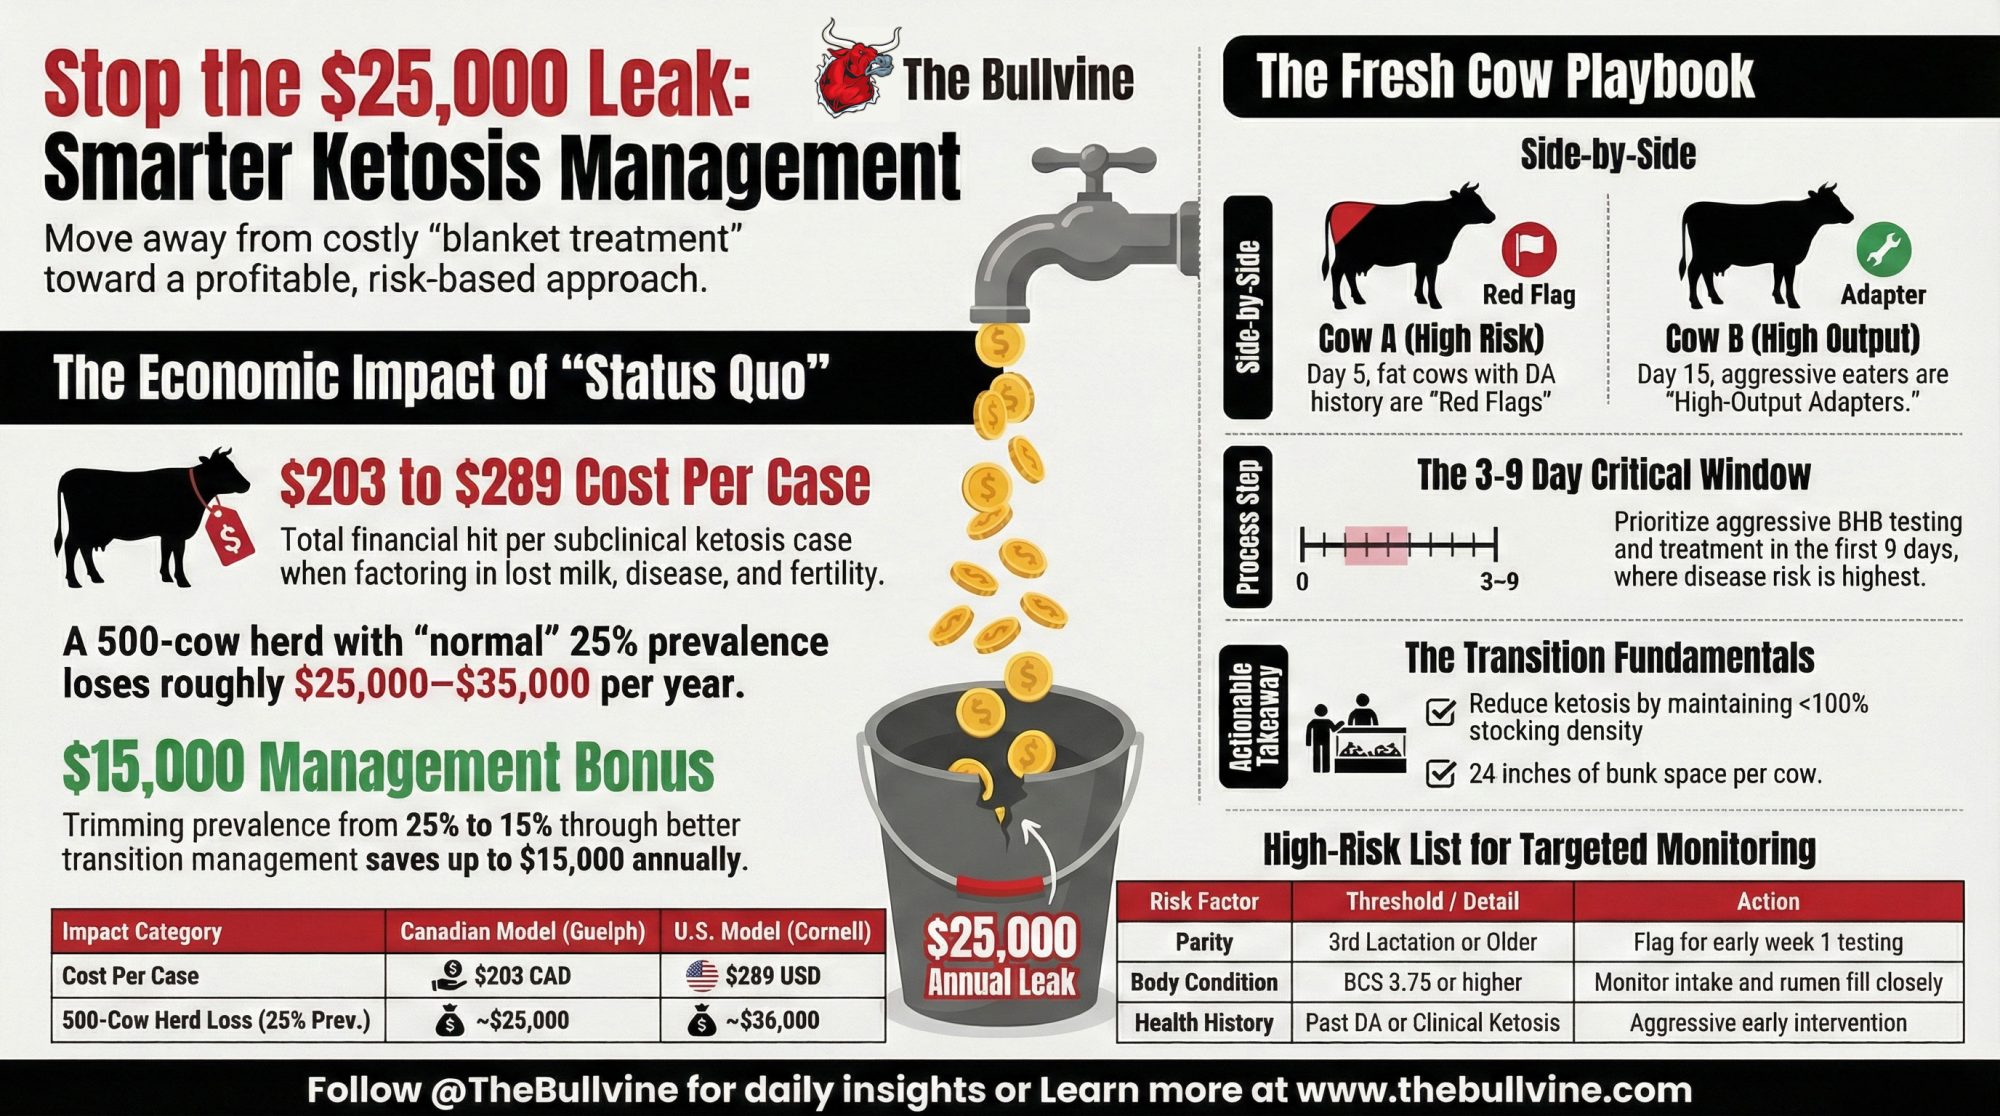
Here’s what’s interesting. When you run the numbers the way the researchers did, how you react to that one reading can swing something like $25,000 to $35,000 a year in modeled losses for a 500‑cow Holstein freestall herd in today’s conditions. A Canadian modeling study based on real herd data pegged the cost of a subclinical ketosis case at about 203 Canadian dollars per cow, once you factor in lost milk, increased disease risk, reduced fertility, and early culling. That work was led out of Guelph and published in 2016, and it’s still the go‑to number many economists use.
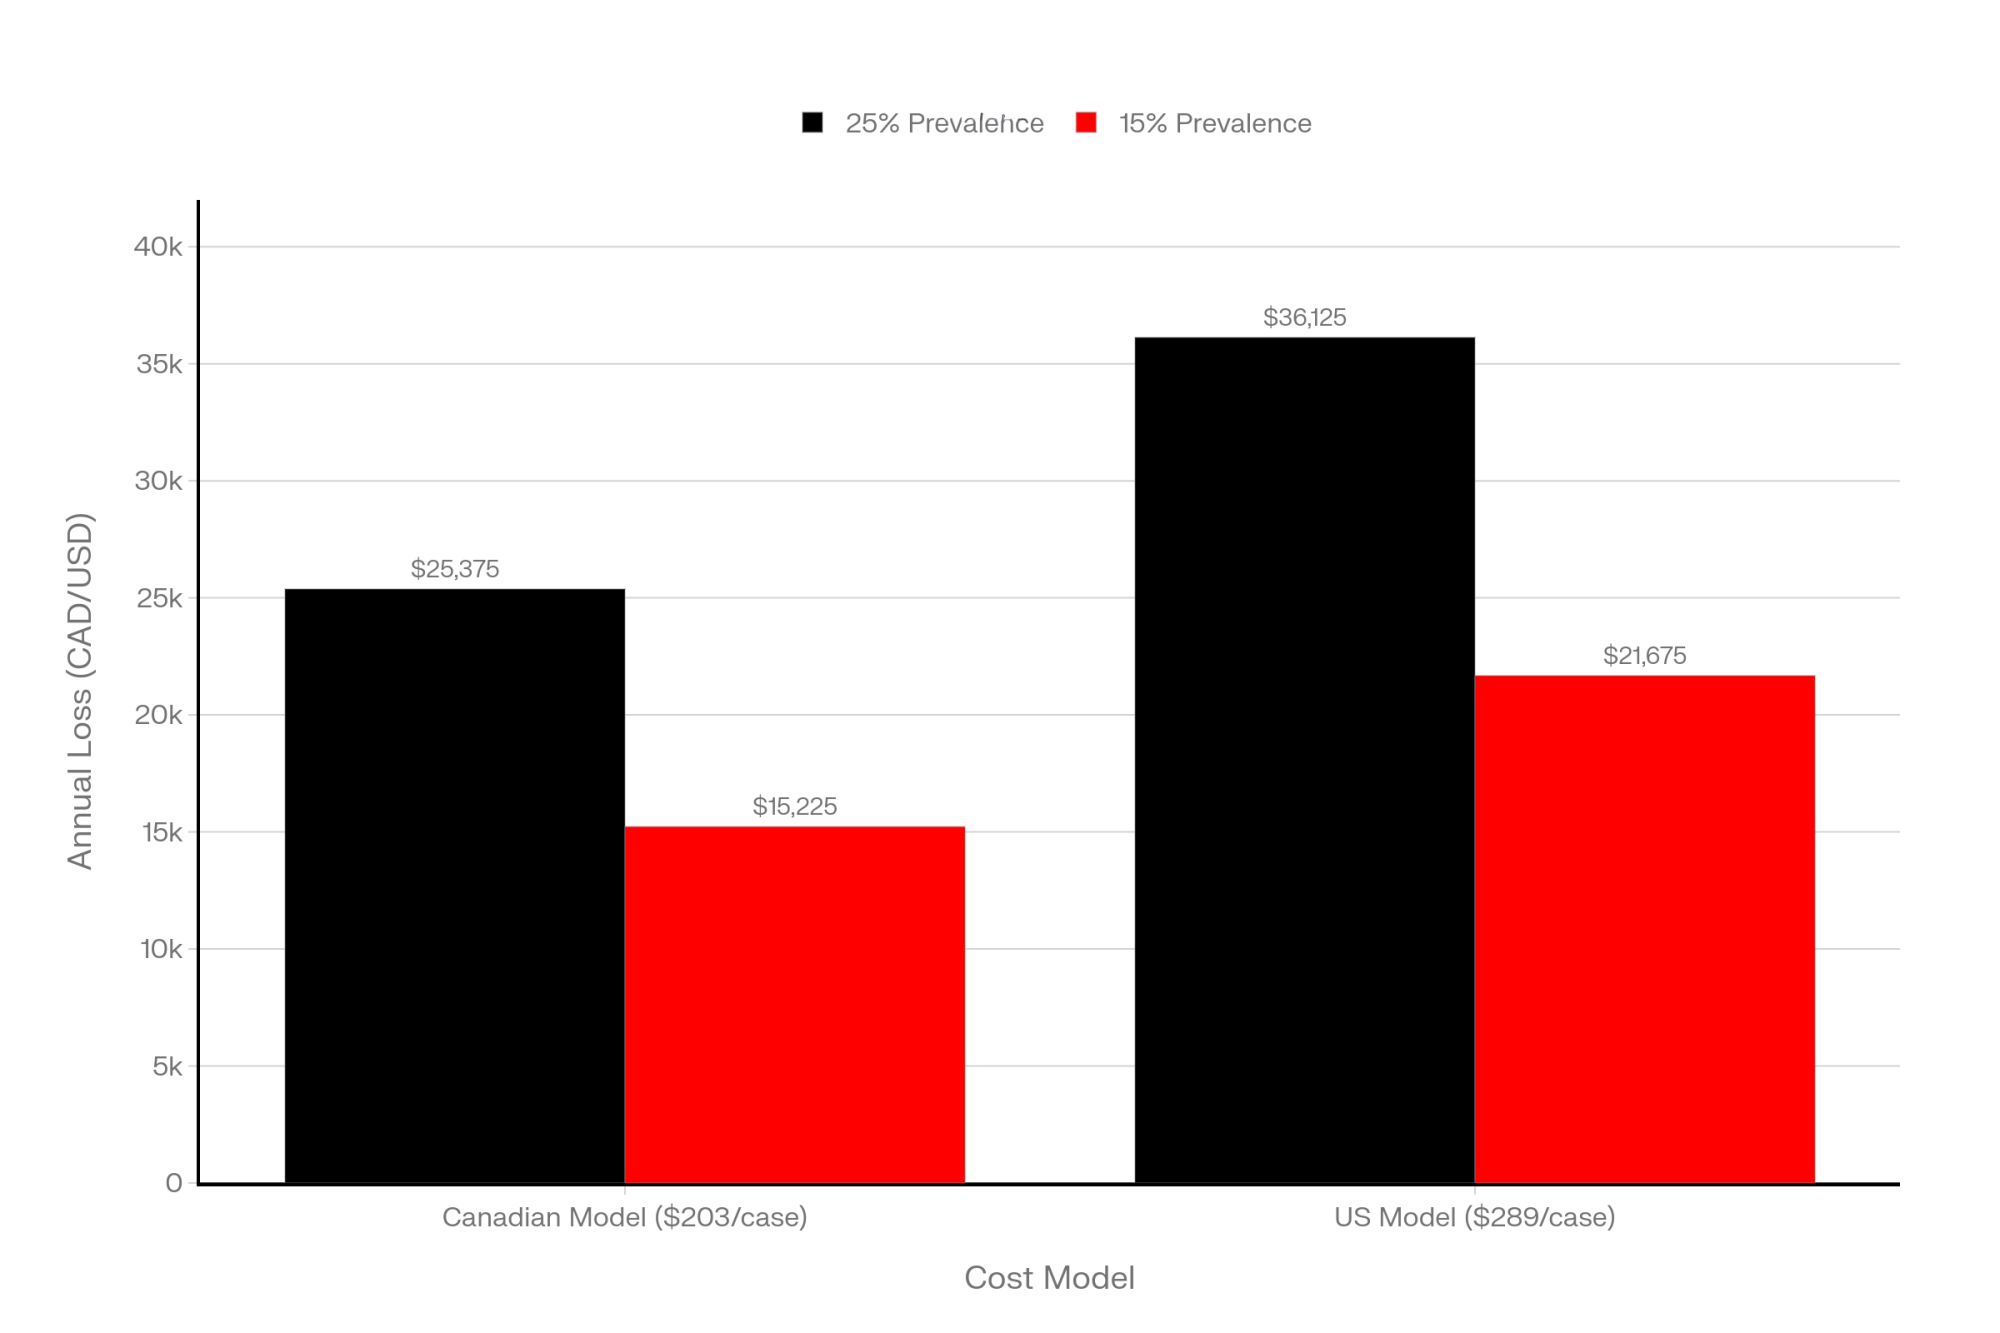
On the US side, a team including Christopher McArt, DVM, PhD at Cornell, developed a deterministic model for early‑lactation hyperketonemia—basically elevated BHB in the first couple of weeks—and came up with an average cost of about 289 US dollars per case when you include the downstream metritis and displaced abomasum that tend to travel with high ketones. That’s a different model and a slightly different definition, but it gives you the same basic message: once cows slide into that high‑BHB zone, the bill adds up.
Now take a 500‑cow herd. If about a quarter of those cows quietly drift into subclinical ketosis in the fresh cow window—which is right in line with big global surveys using a 1.2 mmol/L cut‑point—that’s about 125 cows a year. A multicountry project that tracked 8,902 cows on 541 farms across 12 countries found an average subclinical ketosis prevalence of 24.1 percent using the same 1.2 mmol/L blood BHB definition. At 203 dollars a case, 125 cows comes out to something like $25,000 in modeled losses; plug in the 289‑dollar estimate, and you’re looking at closer to $36,000.
And if that herd can trim SCK prevalence from roughly 25 percent (125 cows) down to 15 percent (75 cows) by tightening transition management and being smarter about which cows actually get treated, the math shifts quickly. That’s 50 fewer cases. On the Canadian model, you’ve just saved a bit over $10,000, and on the hyperketonemia model, you’re up around $14,000–$15,000 in modeled savings.
Whether you’re selling under Canadian quota, US component pricing, milk‑solids contracts in New Zealand, or more volume‑weighted arrangements in Europe, those per‑case costs don’t care. Once herd‑level prevalence creeps from the low‑20s into the 25–30 percent band, the leak becomes large enough to show up in the year‑end numbers.
And yet, on many farms, the whole conversation still begins and ends with one simple line on the meter: 1.2 mmol/L. So let’s talk about where that line came from and why, in 2025, it probably works best as a reference point—not as the only rule you live by.
Where That 1.2 Line Really Came From
It’s worth noting right off the bat that 1.2 wasn’t pulled out of thin air. Over the past couple of decades, researchers have linked blood BHB levels to things you and I lose sleep over: displaced abomasums, retained placenta, metritis, mastitis, lost milk, and open days.
When a pile of those studies were pulled together in an invited review on diagnosing and monitoring ketosis in high‑producing cows, the authors found that cut‑points in the 1.2 to 1.4 mmol/L range did a pretty solid job of identifying cows that were more likely to run into trouble, without burying you in false positives. In practice, 1.2 proved a handy “early tripwire” for subclinical ketosis in many trials and on many farms.
Other reviews that focus on ketone bodies in dairy cows land in roughly the same place. Subclinical ketosis is most commonly defined at about 1.2 mmol/L blood BHB, and 3.0 mmol/L and above is usually where people start talking about clinical ketosis. When you couple those BHB numbers with non‑esterified fatty acids (NEFA), the pattern is clear: cows that come out of the transition period with both BHB and NEFA on the high side see more metabolic disease and poorer fertility.
On the physiology side, the newer work has filled in some of the “why.” A 2024 review on the big metabolic diseases in the transition period, along with related work on body condition and adipose tissue, shows that cows in deeper negative energy balance mobilize more fat, load the liver with triglycerides, and start sending off more inflammatory and oxidative stress signals. Ketotic cows in those studies had higher NEFA levels, more liver fat, and a different inflammatory profile than their herd mates, even when they didn’t appear “sick” in the classic sense. Multi‑omics papers—where they look at dozens or hundreds of metabolites and proteins at once—back that up with a distinct metabolic fingerprint in cows that develop ketosis.
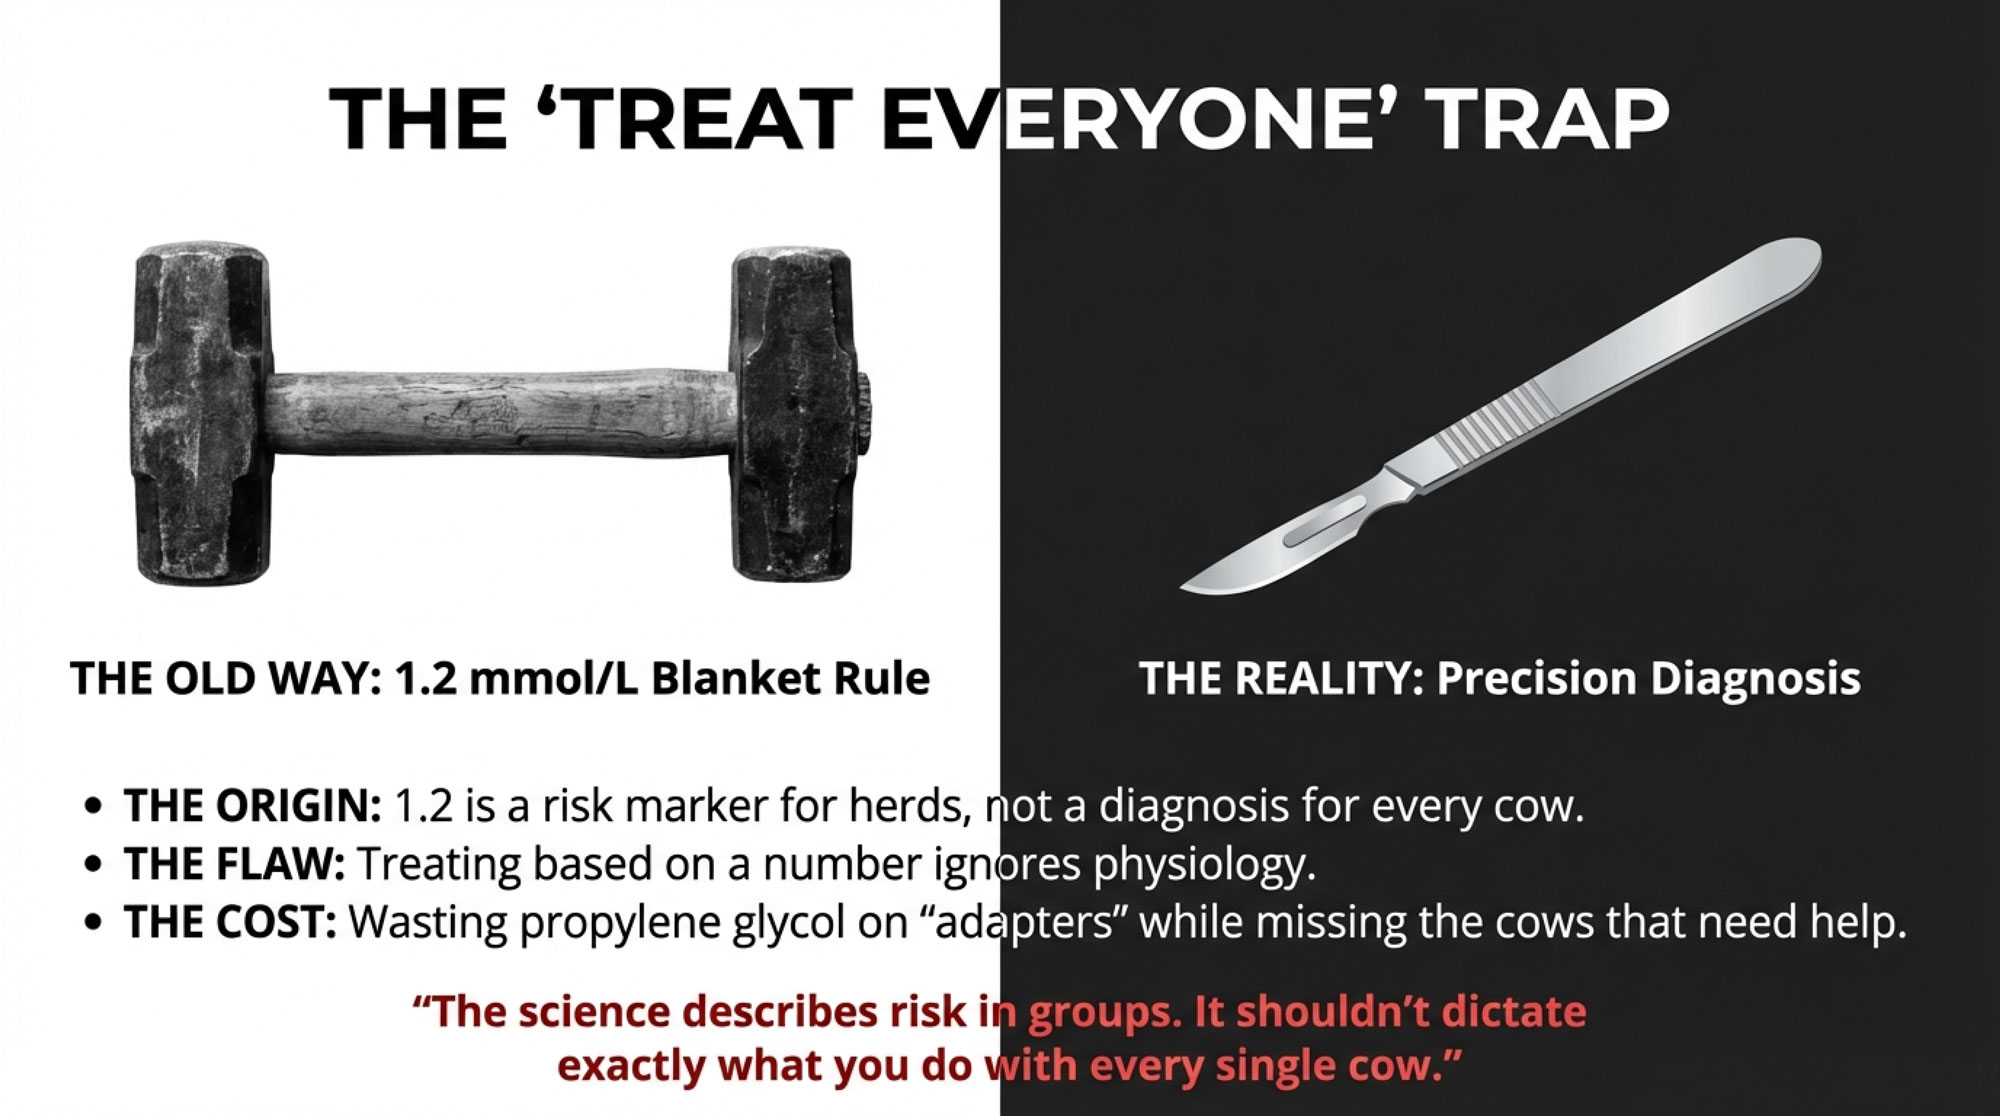
So at the herd level, 1.2 mmol/L is a very useful risk marker. If a high proportion of your fresh cows are over that line, especially in those first couple of weeks, the odds go up for disease, lost milk, and slower rebounds. That’s why you see that number in so much university research and extension material.
But it’s just as important to remember what that line was designed to do. It was meant to describe risk in groups of cows, not to dictate exactly what you must do with every single cow that pings 1.2 or 1.3 on the meter.
| Cost Component | Canadian Model ($203 total) | US Model ($289 total) | Note |
|---|---|---|---|
| Lost milk (reduced production for 30–60 days) | $95 | $135 | Largest driver |
| Increased disease risk (metritis, mastitis, DA treatment) | $65 | $110 | Cascading costs |
| Reduced fertility (extended open days, re-breeding) | $35 | $35 | Long-term impact |
| Early culling / forced early exit | $8 | $9 | Replacement herd cost |
| Total per case | $203 | $289 | Difference reflects severity & follow-on issues |
Looking at the Big Picture: How Common Is This, Really?
If you zoom out from your own herd and look at the global picture, you see pretty quickly that you’re not alone.
That multicountry field project we just mentioned—8,902 cows, 541 farms, 12 countries—sampled cows at 2-21 days in milk and used 1.2 mmol/L as the blood BHB cut-off. Overall, subclinical ketosis prevalence averaged 24.1 percent, but the range across countries was wide: some places were down around 8–9 percent, while others, including some pasture‑heavy systems, pushed above 40 percent.
More recent syntheses that pull together multiple SCK and hyperketonemia studies land in the same ballpark. Global prevalence sits in the low‑to‑mid‑20 percent range when you use something like 1.2 mmol/L as your line in the sand, with individual herd results scattered across the range depending on management, genetics, and climate. The Merck Veterinary Manual and updated transition reviews also underline that most hyperketonemia cases show up in the first two to three weeks after calving, and that multiparous cows are consistently at higher risk than first‑lactation animals.
So if you run a quick fresh‑cow audit in an Ontario or Wisconsin freestall—or in a Quebec tiestall herd—and find that about one in four clinically normal cows in the first three weeks are testing over 1.2, that actually lines up pretty well with what these big data sets describe as “normal” for modern Holstein herds. It doesn’t mean it’s where you want to stay long‑term, but it does mean you’re fighting a battle a lot of herds are in the middle of right now.
What the numbers really help with is this: they tell you that once prevalence drifts into the mid‑20s and stays there, the cost per case math starts to really matter. That’s where it’s worth asking not just “how many cows are over 1.2?” but “which cows are over it, and when?”
Same Number, Two Very Different Cows
This is where the story gets more interesting, once you come back down from the spreadsheets to the cows in front of you.
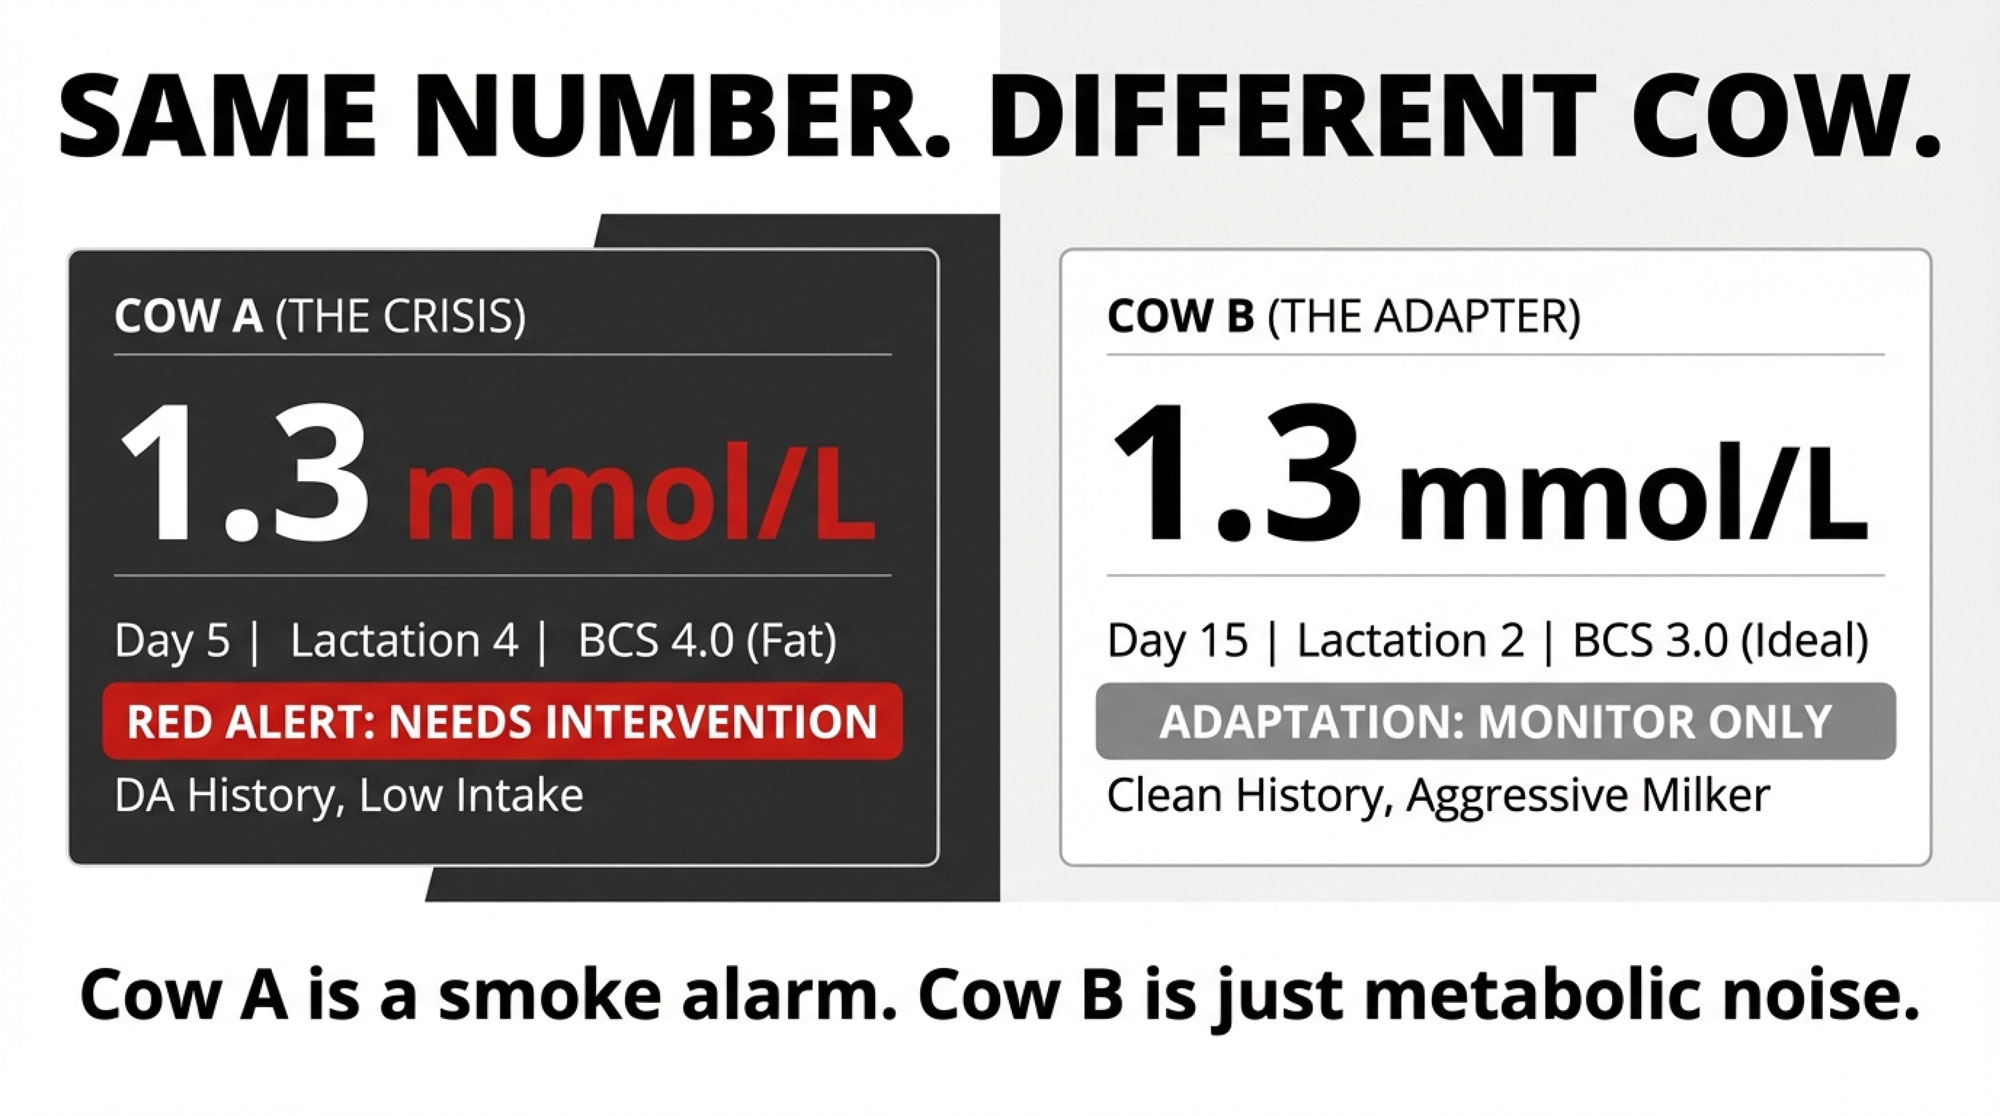
In barns I’ve walked—Midwest freestalls, Quebec tiestalls, Western dry lot systems—the same pattern keeps showing up. You pull blood on two fresh cows. Both read 1.3 mmol/L. But when you actually look at them, they’re not the same animal at all.
Cow A: Trouble Brewing in Week One
Cow A is the kind of cow many of us could pick a mile away:
- Day 5 in milk
- Fourth‑lactation Holstein
- Walked into the close‑up pen heavier than you’d like (body condition around 3.75–4.0 on a five‑point scale)
- History of displaced abomasum in the last lactation
- Hanging back at the bunk; rumen fill looks flat
- Maybe giving 55 pounds of milk with butterfat levels that feel low for her genetics and stage
- Blood BHB: 1.3 mmol/L
Cow B: The High‑Output Adapter in Week Two
Cow B, on the other hand, looks like a different species some mornings:
- Day 15 in milk
- Second‑lactation Holstein
- Calved at a tidy BCS of about 3.0–3.25
- Clean first lactation—no DA, no recorded ketosis
- Right up at the bunk, every push‑up, rumen fill is excellent
- Pushing close to 95 pounds with strong butterfat for the pen
- Blood BHB: 1.3 mmol/L
To make that contrast easier to see, here’s a quick side‑by‑side:
| Feature | Cow A: Early-Window Risk | Cow B: High-Output Adapter | What This Means |
|---|---|---|---|
| Days in Milk | Day 3–9 | Day 10+ | Early trouble vs. normal adaptation |
| Body Condition | 3.75–4.0 (over-conditioned) | 3.0–3.25 (moderate) | Deeper NEB = greater metabolic stress |
| Clinical Signs | Poor rumen fill, sluggish, weak milk | Aggressive eater, excellent fill, strong solids | Feeding behavior predicts outcome |
| Blood BHB (1.3 mmol/L) | 🚩 Red Flag | ⚠️ Background Noise | Identical reading, opposite meaning |
| Treatment Decision | Treat immediately with PG + support | Monitor & retest in 24–48 hours | Context beats blanket rules |
| Financial Impact | $203–$289 loss without treatment | Likely self-resolving; treat waste money | Smarter triage = $10K+ savings |
Now, if you lay Cow A alongside what the research is telling us, she ticks almost every high‑risk box. Transition‑period reviews and body condition work show pretty consistently that cows calving with a BCS of 3.75 or higher are more likely to run into ketosis, displaced abomasum, fatty liver, and related problems—especially if they then lose a lot of condition after calving. Multiparous cows in those early days in milk simply have higher odds of subclinical ketosis and its knock‑on effects than heifers do.
A 2024 review on metabolic diseases in the transition period went so far as to say that cows calving at or above BCS 3.75 should be considered at increased risk of ketosis compared to leaner cows, and earlier work supports that. Add in her history of DA and the fact she’s already hanging back at the bunk with mediocre rumen fill, and that 1.3 reading starts to look like the tip of a bigger iceberg.
Cow B, by contrast, looks a lot more like what some people call a “high‑output adapter.” She’s not fat, she’s eating hard, she’s ruminating well, and she’s throwing milk and components. In that context—and especially once you’re past day 10 or so—that 1.3 reading may be telling you something very different.
So what’s interesting here is this: same BHB number, two very different risk stories.
Why Timing and Physiology Change the Story
If you step back and look at this across studies, the timing piece just keeps jumping off the page.
That big multicountry field project sampled cows at 2-21 DIM, and, as many of you have seen, most subclinical ketosis cases clustered in the first part of that window. Transition reviews and metabolic profiling studies repeatedly show that the lion’s share of ketosis and fatty liver issues hit in the first two to four weeks postpartum, with a lot of the real trouble packed into days 3–14.
Some of the more detailed work that follows cows from the dry period into early lactation shows that cows that eventually develop hyperketonemia often have higher NEFA, different liver enzyme profiles, and other “out of balance” signals in the last week or two before calving and the very first week after. In other words, by the time the meter says 1.3 at day 5, the underlying physiology has been heading that way for a while.
On the flip side, newer reviews on ketone metabolism in dairy cows are reminding us of something many of us sensed: ketones aren’t just “bad fuel.” They’re also a normal energy source and signaling molecule. How much risk a given BHB number carries depends a lot on when you see it and what else is going on in that cow’s life—her body condition, her intake, her milk curve, her parity, and so on.
You see this really clearly when you look at pasture‑based systems. DairyNZ’s “Blood BHB and Cow Performance” project followed 980 cows in three seasonal herds and tested blood BHB three times a week for the first five weeks after calving. They defined moderate hyperketonemia as 1.2 to 2.9 mmol/L. In that study, about 76 percent of cowshad at least one test in that moderate range, and about 11 percent had at least one severe result at or above 2.9 mmol/L.
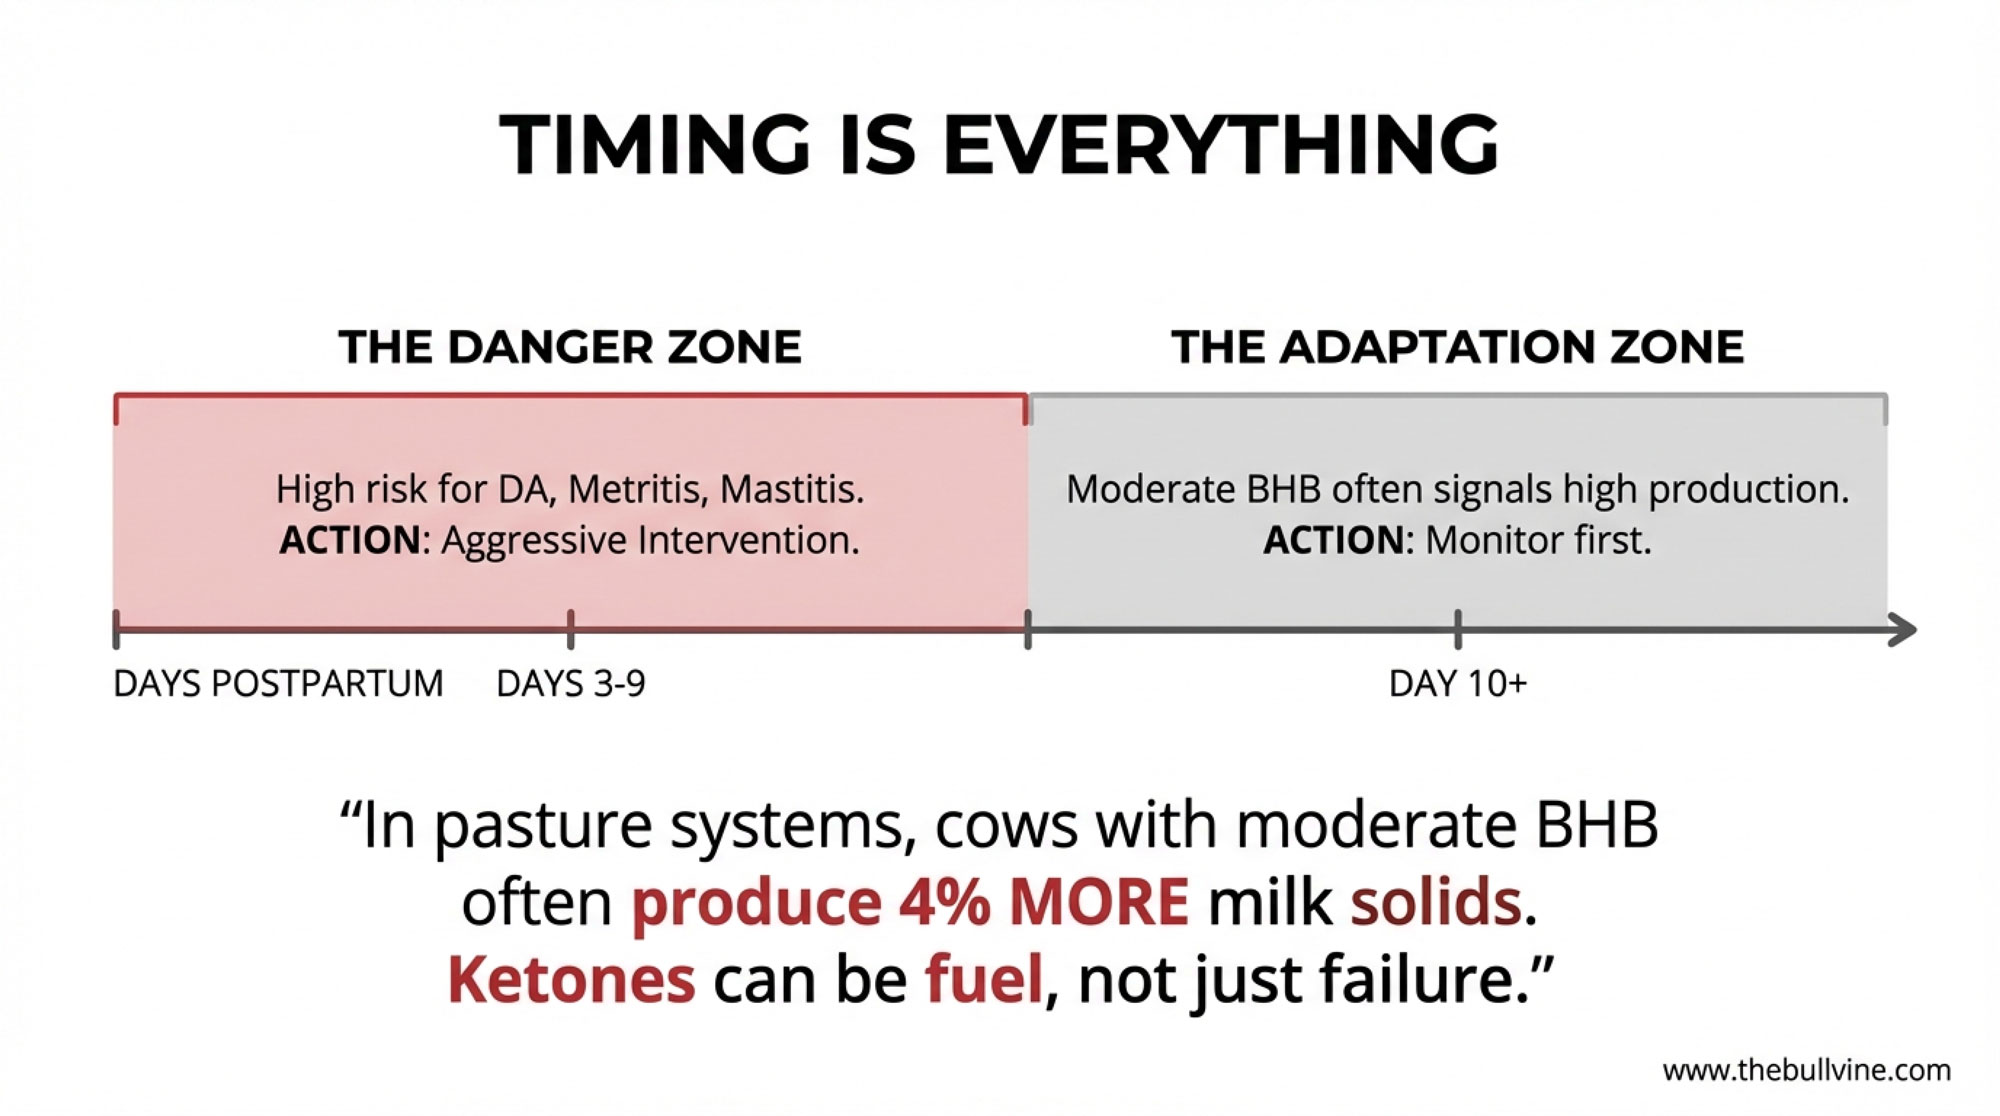
Here’s the twist that sticks with a lot of people: in that specific pasture‑based context, cows that had at least one BHB test over 1.2 mmol/L actually produced about 4 percent more milk solids in the first 15 weeks than cows that stayed below 1.2. And when they looked at uterine health and six‑week in‑calf rates, they didn’t find a consistent negative relationship with those moderate BHB elevations in those herds.
That doesn’t mean ketones are “good” now. What it does suggest is that in some pasture systems, a moderate bump in BHB can just be part of the metabolic dust that comes with high output, especially when cows aren’t over‑conditioned and are eating aggressively.
So a cow like B—two weeks fresh, moderate BCS, strong intake, strong rumen fill, high milk and solid components—can easily show you 1.3 on the meter and still be doing just fine. A cow like A, at day 5, older, fatter, off feed, and with a DA history, is in a very different place. Treating those two cows exactly the same, just because the numbers are identical, is where a lot of hidden costs creep in.
Why “Treat Every Cow Over 1.2” Often Leaves Money on the Table
Once you put Cow A and Cow B side by side, it gets tougher to defend a blanket rule that says, “we automatically treat every cow over 1.2 mmol/L exactly the same way, every time.”
The DairyNZ work is a good example of why. In one of their follow‑up trials, they took cows with moderate hyperketonemia (1.2–2.9 mmol/L) and split them into two groups. Half got daily monopropylene glycol drenches until their BHB dropped below 1.2. The other half were left untreated. As you’d expect, the drenched cows were more likely to bring their BHB down and less likely to progress into severe hyperketonemia over 2.9 mmol/L.
But when the team followed those same cows for milk solids production and six‑week in‑calf rates, the story got more complicated. They didn’t see consistent improvements in milk or reproduction across all herds and seasons. Some groups did better, some didn’t, and overall, they described the performance response as not strongly or consistently positive.
A 2022 open‑access study from Italy looking at subclinical ketosis and early propylene glycol treatment came to a similar kind of conclusion: early diagnosis and treatment can absolutely help in some situations—especially when prevalence and risk are high—but the benefit in terms of production and fertility depends heavily on the herd’s baseline management, the underlying transition program and the economics on that particular farm.
So what I’ve found, and what the data support, is that propylene glycol is still a very useful tool. It’s just that a blanket “treat every cow at or above 1.2” rule doesn’t always pay you back in milk or pregnancy rates, particularly in pasture or hybrid systems where many cows will have at least one moderate BHB bump while still doing just fine.
If your written protocol still says “treat every cow over 1.2,” there’s a good chance you’re spending money and labor on some cows that don’t need it, and not spending enough attention on the cows that really do.
Where the Money Actually Leaks in a 500‑Cow Freestall
Let’s go back to that 500‑cow Holstein freestall many of you are picturing right now—maybe in Wisconsin, maybe in western Ontario or New York State.
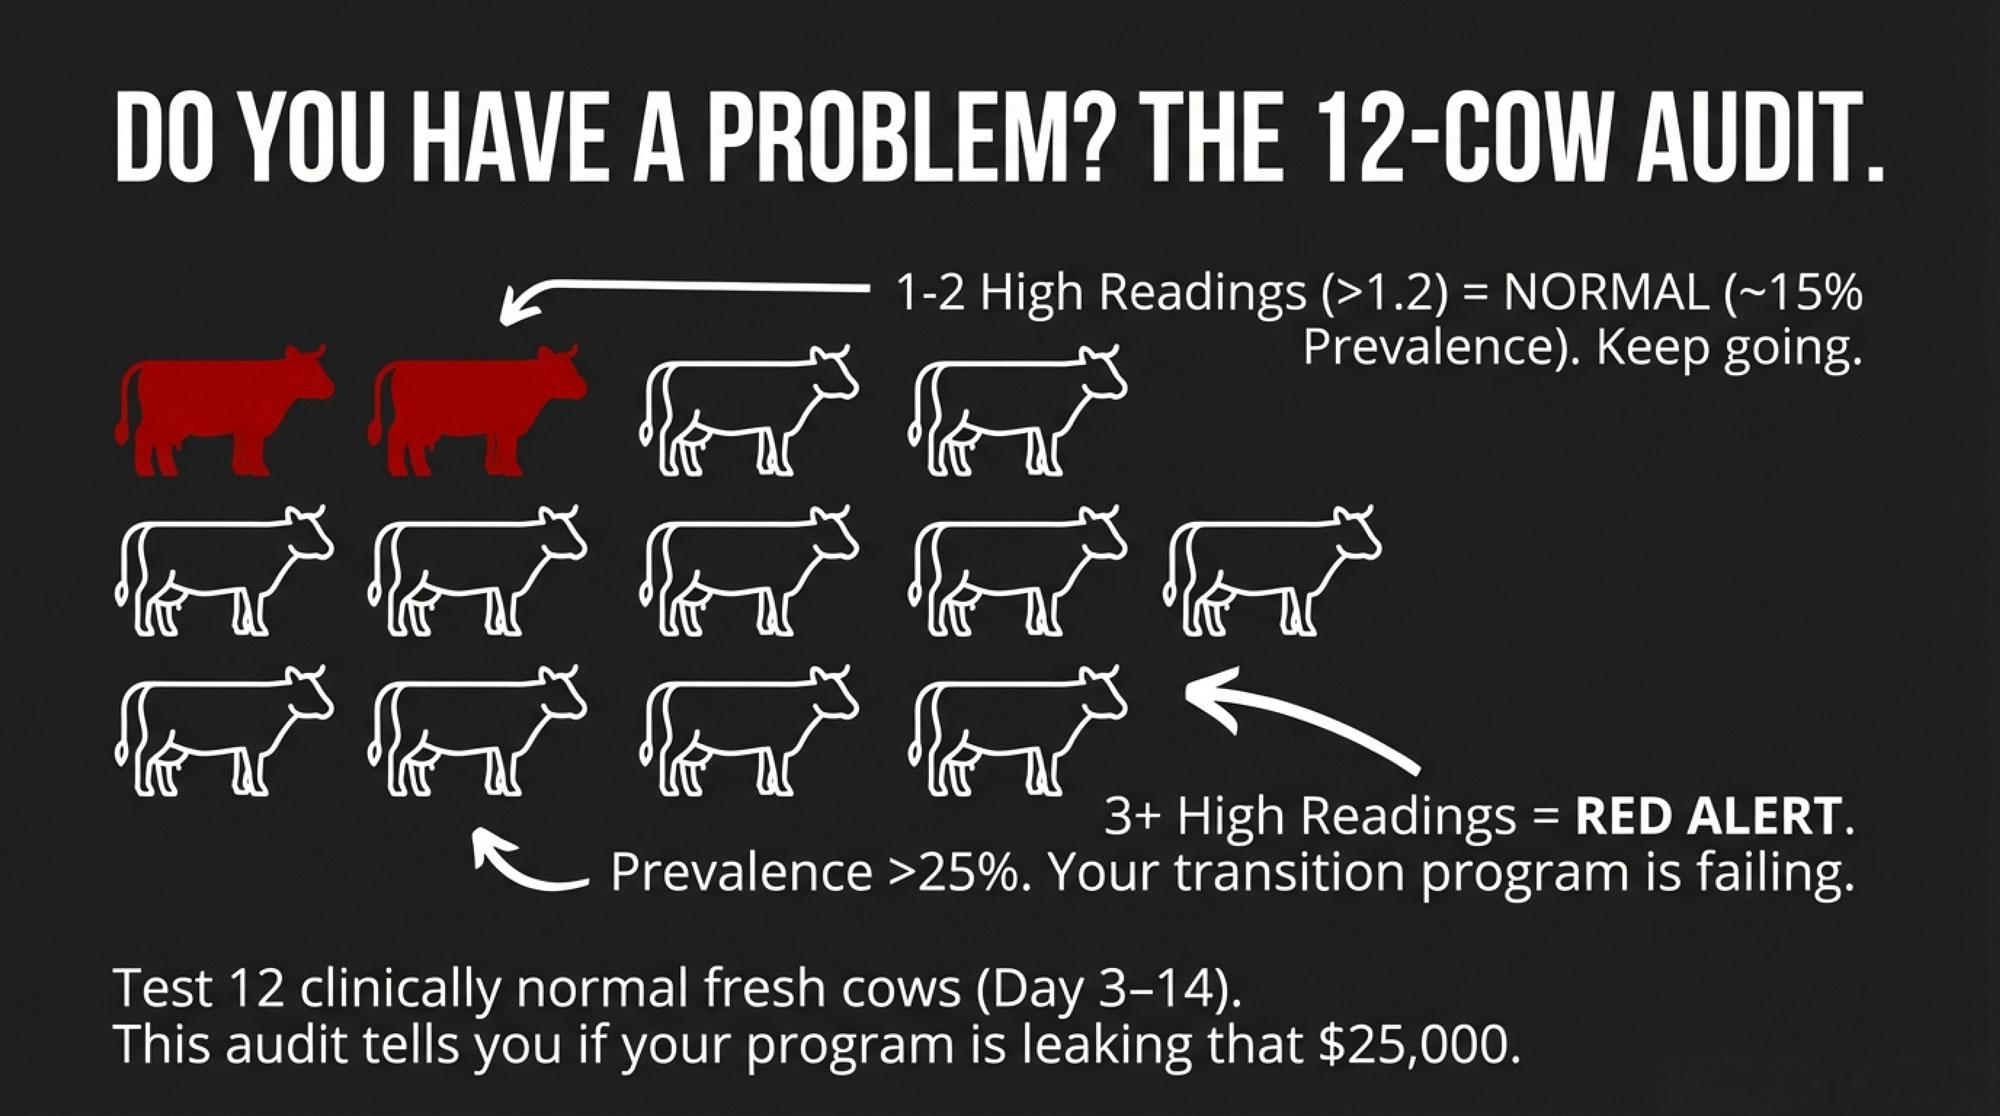
One simple herd‑level check that many vets and extension folks recommend is to grab a small sample of clinically normal, fresh cows—say 10 to 12 animals between days 3 and 14 in milk—and test their blood BHB. You’re not trying to micromanage those particular cows; you’re just taking the herd’s pulse.
Experience and some basic statistics say that if only one or two cows out of twelve come back at or above 1.2 mmol/L, your herd‑level prevalence is probably in the mid‑teens, give or take. Not perfect, but within a range many modern herds find manageable with decent transition programs.
But when three or more out of twelve test at or above 1.2—especially if it’s four or five—you’re probably nudging into that 20–25 percent or higher zone that the global surveys talk about. That’s when the cost‑per‑case math we walked through earlier really starts to bite.
At that point, many Midwest and Northeast herds that have gone through this exercise, often with their vets and nutritionists, found they were doing what a lot of us did at first: testing every fresh cow once or twice a week, treating every reading at or above 1.2, and feeling like they were “on top of ketosis.”
And they were catching more cases than before. But they were also spending a fair chunk of time and PG on:
- Heifers that were eating and milking well
- Moderate‑BCS second‑lactation cows with no history of transition trouble
- Cows that were over 1.2 for a day or two but never showed a real clinical ripple
What’s encouraging is that more and more extension pieces and milk‑recording organizations are now highlighting farms that have moved away from that blanket approach. Instead, they pick out high‑risk cows in advance—older cows, over‑conditioned cows, cows with past DA or clinical ketosis—watch them more closely in the first week, and then use small herd‑level audits like this to see whether the overall transition program is really working.
Those herds often end up with similar or better health and reproduction, fewer nasty surprises in the fresh pen, and less time and money tied up in treating marginal cases that were never likely to crash in the first place.
Timing Really Is Everything
Looking at this trend across study after study and many real barns, timing keeps coming back as the pivot point.
The main ketosis diagnostic reviews and the 2024 transition‑disease papers all say the same thing in slightly different ways: subclinical ketosis and hyperketonemia are most common and most impactful in the early postpartum period, especially the first two weeks. That’s exactly when we see most of the fatty liver, most of the displaced abomasums, and a lot of the metritis and mastitis that really dent early lactation.
Some of the more detailed metabolic profiling work shows that cows that end up hyperketonemic often have “off” metabolic profiles—higher NEFA levels and altered liver enzymes—even three weeks before calving. By the time they’re at day 5 or 7 in milk with a 1.3 or 1.4 reading, you’re seeing the tail end of a much longer energy and lipid story.
Clinicians like McArt and others have been pretty clear in their teaching: you can’t read a BHB number in isolation. You’ve got to look at day in milk, parity, body condition, history, appetite, and rumen fill to decide whether a 1.3 reading is a smoke alarm or just static.
So a pattern that many of us are working with now looks something like this:
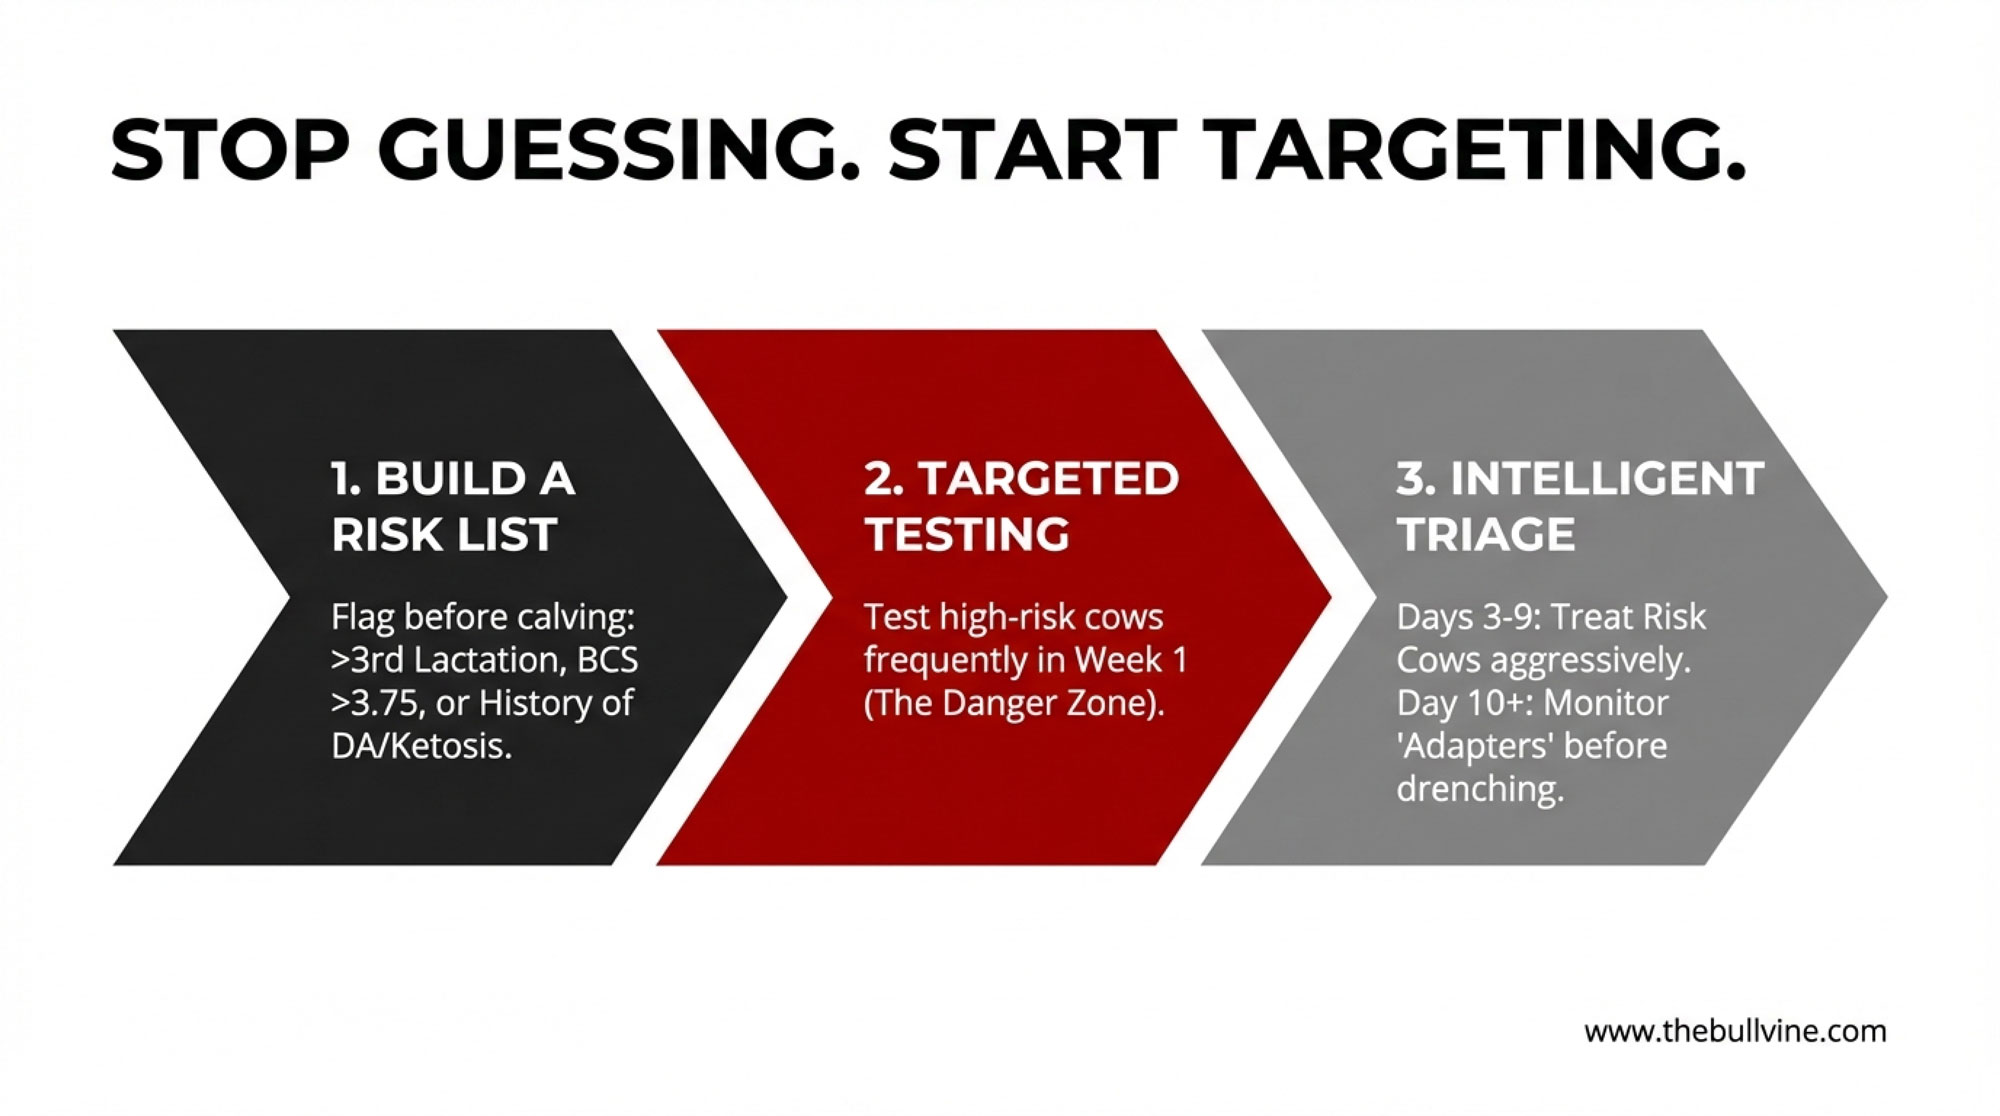
- In roughly days 3–9 postpartum, especially in freestall and tiestall herds, a BHB at or above 1.2–1.4 mmol/Lin a multiparous, over‑conditioned cow that’s backing off the bunk is much more likely to be the start of costly trouble—DA, metritis, mastitis, lost milk, and poor reproduction. That’s the window where catching and treating subclinical ketosis tends to have the biggest health and economic payback.
- After about day 10, a mild BHB elevation—say 1.2–1.7 mmol/L—in a cow that’s eating well, ruminating, and milking hard (especially if she’s a moderate‑BCS animal with no ugly transition history) often carries much less risk. In pasture and hybrid systems, that kind of moderate elevation is sometimes more of a physiological footprint of high production than a red warning light.
So the better question when the meter flashes 1.3 isn’t “is she ketotic?” It’s “where is she in her fresh curve, and what else about her says she needs help—or doesn’t?”
Building a Simple Risk List That Actually Works
The nice thing is, you don’t need a supercomputer to do a better job of this. Most of you already have the key pieces either in your herd software or in your head.
Across Wisconsin freestalls, Ontario and Quebec tiestalls, and Western dry lot systems, the same pattern shows up again and again. The cows at higher risk for subclinical ketosis and transition disease tend to be:
- Third‑lactation and older animals
- Cows that calved over‑conditioned (BCS 3.75 or higher)
- Cows with a previous displaced abomasum or clinical ketosis, or a rough transition with severe metritis or retained placenta
The 2024 metabolic disease review and other transition‑period papers support that. They show higher odds of ketosis and related problems in multiparous cows, and they consistently flag high BCS at calving—especially over 3.75 on a five‑point scale—as a risk factor for deeper negative energy balance, fatty liver, and clinical disease. Epidemiology work and practical field studies also highlight prior DA and clinical ketosis as “repeat offenders” when it comes to risk.
What many herds are doing now, often with their vet and nutritionist at the table, is tagging these cows as “high‑risk” at calving. That might be a note on the calving list, a flag in the herd management software, or even a colored chalk mark on the rump in some tiestall barns. Then they make sure:
- Those cows get more frequent BHB checks in the first week postpartum.
- Their appetite and rumen fill are watched more closely.
- Early treatment decisions factor that risk status into the call.
Meanwhile, lower‑risk cows—heifers and moderate‑BCS second‑lactation cows with clean histories—might get one BHB test somewhere around day 7–10, and then only get pulled in again if their milk, rumen fill, or behavior raises a red flag.
What farmers are finding is that this risk‑based approach lets them concentrate attention and treatment where the payoff is highest, without ignoring cows that actually need intervention. It also lines up pretty nicely with what big milk‑recording datasets and predictive ketosis models are telling us: if you’re going to spend time and money on extra diagnostics, you get the most bang by focusing on cows that already have known risk factors.
Using Herd-Level Audits Without Losing the Forest for the Trees
Risk lists help you with individual cows. The herd‑level audit helps you answer a different question: “is our fresh cow program leaking more than it should?”
| Audit Result(out of 12 fresh cows) | Estimated Herd Prevalence | Herd Status | Action Required |
|---|---|---|---|
| 0–1 cows ≥1.2 mmol/L | < 15% | ✅ Healthy | Continue current program; sample annually. |
| 2–3 cows ≥1.2 mmol/L | 15–20% | ⚠️ Monitor | Good baseline. Tighten BCS at calving; check stocking & bunk space. |
| 4–5 cows ≥1.2 mmol/L | 20–25% | 🚩 Action Zone | Likely 25% prevalence. Review stocking, nutrition, heat abatement. Build risk list; test high-risk cows more frequently. |
| 6+ cows ≥1.2 mmol/L | 25%+ | 🚨 Red Alert | Critical. Transition program broken. Vet + nutritionist urgent. Review stocking (<100%), bunk space (24″ min), BCS (3.0–3.5). Major changes required. |
As we mentioned earlier, several reviewers and extension teams suggest a simple approach: pull 10–12 clinically normal, fresh cows between days 3 and 14 in milk and check their BHB. You’re not using this to decide who to drench right now; you’re using it to estimate how big the subclinical ketosis problem is in the group.
If only one or two of those cows are at or above 1.2 mmol/L, herd‑level prevalence is likely somewhere under the 15‑percent mark. Given today’s genetics and production, many herds find that level manageable with good transition programs.
If three or more out of the twelve cows are at or above 1.2—especially if the number pops higher than that—you’re probably in that 20–25 percent or higher range that global field work keeps showing. At that point, it’s less about arguing whether optional treatments are “worth it” and more about asking whether the entire close‑up, calving, and fresh cow package is doing what it should.
So that little audit doesn’t just tell you who to treat. It tells you whether your transition period is doing its job or quietly bleeding you of $25–35K a year.
Turning the Research into a Practical Treatment Framework
At some point, all this has to live somewhere other than a good conversation over coffee. It needs to be in the actual fresh cow protocols your team pulls out at 4:30 in the morning.
Here’s one way many herds—working with their vets and within their local regulations—are starting to translate the research and field experience into a more nuanced playbook. This isn’t a one‑size‑fits‑all prescription, but it gives you a flavor of how people are moving beyond the “treat everyone over 1.2” mindset.
- Days 3–9 postpartum (freestalls or tiestalls)
- Treat cows with blood BHB readings of 1.8 mmol/L or higher with propylene glycol and appropriate supportive care, especially if they’re multiparous or over‑conditioned. That early window is where high BHB most closely aligns with costly diseases like DA and metritis.
- Look closely at cows in the 1.2–1.7 mmol/L band if they’re on your high‑risk list—older, heavy cows with a history of transition trouble—and if they’re showing poor appetite, low rumen fill, or milk that’s clearly below their genetic potential. Those cows are often where early treatment pays the most.
- For cows in that 1.2–1.7 range that are bright, eating, ruminating, and milking as expected, many vets now recommend retesting in 24–48 hours and using the trend plus clinical signs to decide, instead of automatically drenching.
- Day 10 onward
- Focus treatment on cows with BHB around 2.0 mmol/L or higher, especially if they’re showing clinical signs or have a rough transition history. In that later window, the cows that are still that high often have deeper problems.
- For cows with BHB in the 1.2–1.9 mmol/L range that are otherwise healthy, eating and milking well—particularly in pasture or hybrid systems—many teams shift toward closer monitoring, retesting, and watching butterfat levels and rumen fill, instead of reflexively grabbing the PG jug.
This kind of framework still respects 1.2 mmol/L as a meaningful reference point. It just stops letting that single number be the only voice at the table.
And when you sit down with your nutritionist, this kind of structured approach is gold. You can show them your latest audit results, your risk list, and your current treatment rules, and then talk through where ration design, energy density, fiber, bunk management, and fresh cow monitoring can change so fewer cows ever drift into those high‑risk BHB zones in the first place.
Letting Technology Help You Aim, Not Replace You
What I’ve noticed in a lot of Wisconsin freestalls, New York herds, Western dry lot systems, and even some Ontario barns is that technology works best when it helps you aim your eyes and hands, not when it pretends to make the decision for you.
If you’re running activity and rumination collars on your fresh cows, you’ve probably seen this pattern: a cow’s rumination starts to drop, her activity isn’t quite right, and she just looks a bit “off” in the pen a day or two before she really spikes a fever or shows you a nasty udder or uterus.
Several studies using SCR/Allflex and similar platforms have documented that those drops in rumination and shifts in behavior often show up before obvious clinical disease, including metabolic issues and mastitis. More recent work specifically comparing subclinically ketotic cows with healthy cows found significantly lower rumination and distinct activity patterns in the SCK group, which aligns well with what many of us see on farm.
On herds that are using this tech well, the routine often looks like this:
- The system flags cows whose rumination or activity has clearly deviated from their own baseline and that of their pen mates.
- The fresh cow manager takes that list out to the pen, checks those cows for rumen fill, manure, temperature, feet, milk, and general attitude, and then decides who gets a BHB test and who just needs a closer eye.
- Over time, the vet and farm team tweak the alert thresholds so they’re catching most true problems without drowning in false alarms.
Then there’s the milk‑recording side of the story. Fat‑to‑protein ratio (FPR) has been a favorite “quick read” on energy balance for years. Research has shown that high FPR values early in lactation—often in the 1.4–1.5 or higherrange—tend to signal negative energy balance and a higher risk of metabolic problems when you look at groups of cows.
But when people have tried to use FPR on its own to diagnose subclinical ketosis in individual cows, the accuracy just hasn’t been strong enough. One study that used inline FPR to decide which cows got propylene glycol found that FPR was helpful for triage—deciding which cows deserved a closer look—but it wasn’t reliable enough to be the only trigger for treatment.
In the last few years, there’s also been quite a bit of work using machine learning models that combine daily milk yield with traits like fat‑to‑protein ratio, lactose, solids‑non‑fat, and milk urea nitrogen to predict which cows are at higher risk of subclinical ketosis. Some of those models reach reasonably good accuracy, but they’re far from perfect and are best treated as decision‑support tools rather than automatic treatment engines.
On top of that, there’s the mid‑infrared (MIR) side. Several studies now show that you can use MIR milk spectra from routine milk recording to predict blood BHB and related ketosis risk traits with moderate accuracy. One big Canadian dataset was used to develop a predicted hyperketonemia (pHYK) trait, and cows with higher pHYK scores tended to have lower milk and protein yields, higher fat, higher somatic cell counts, and poorer fertility. That’s a genetic and management story rolled into one.
So the message for 2025 is pretty straightforward: use collars, FPR, ML predictions, and MIR risk reports to help you decide where to look more closely—which cows to test, which pens to walk again, which herds might need a transition rethink. Don’t hand over the steering wheel and let them replace your eyes, your hands, and your meter.
The Transition Period: Where the Big Levers Still Live
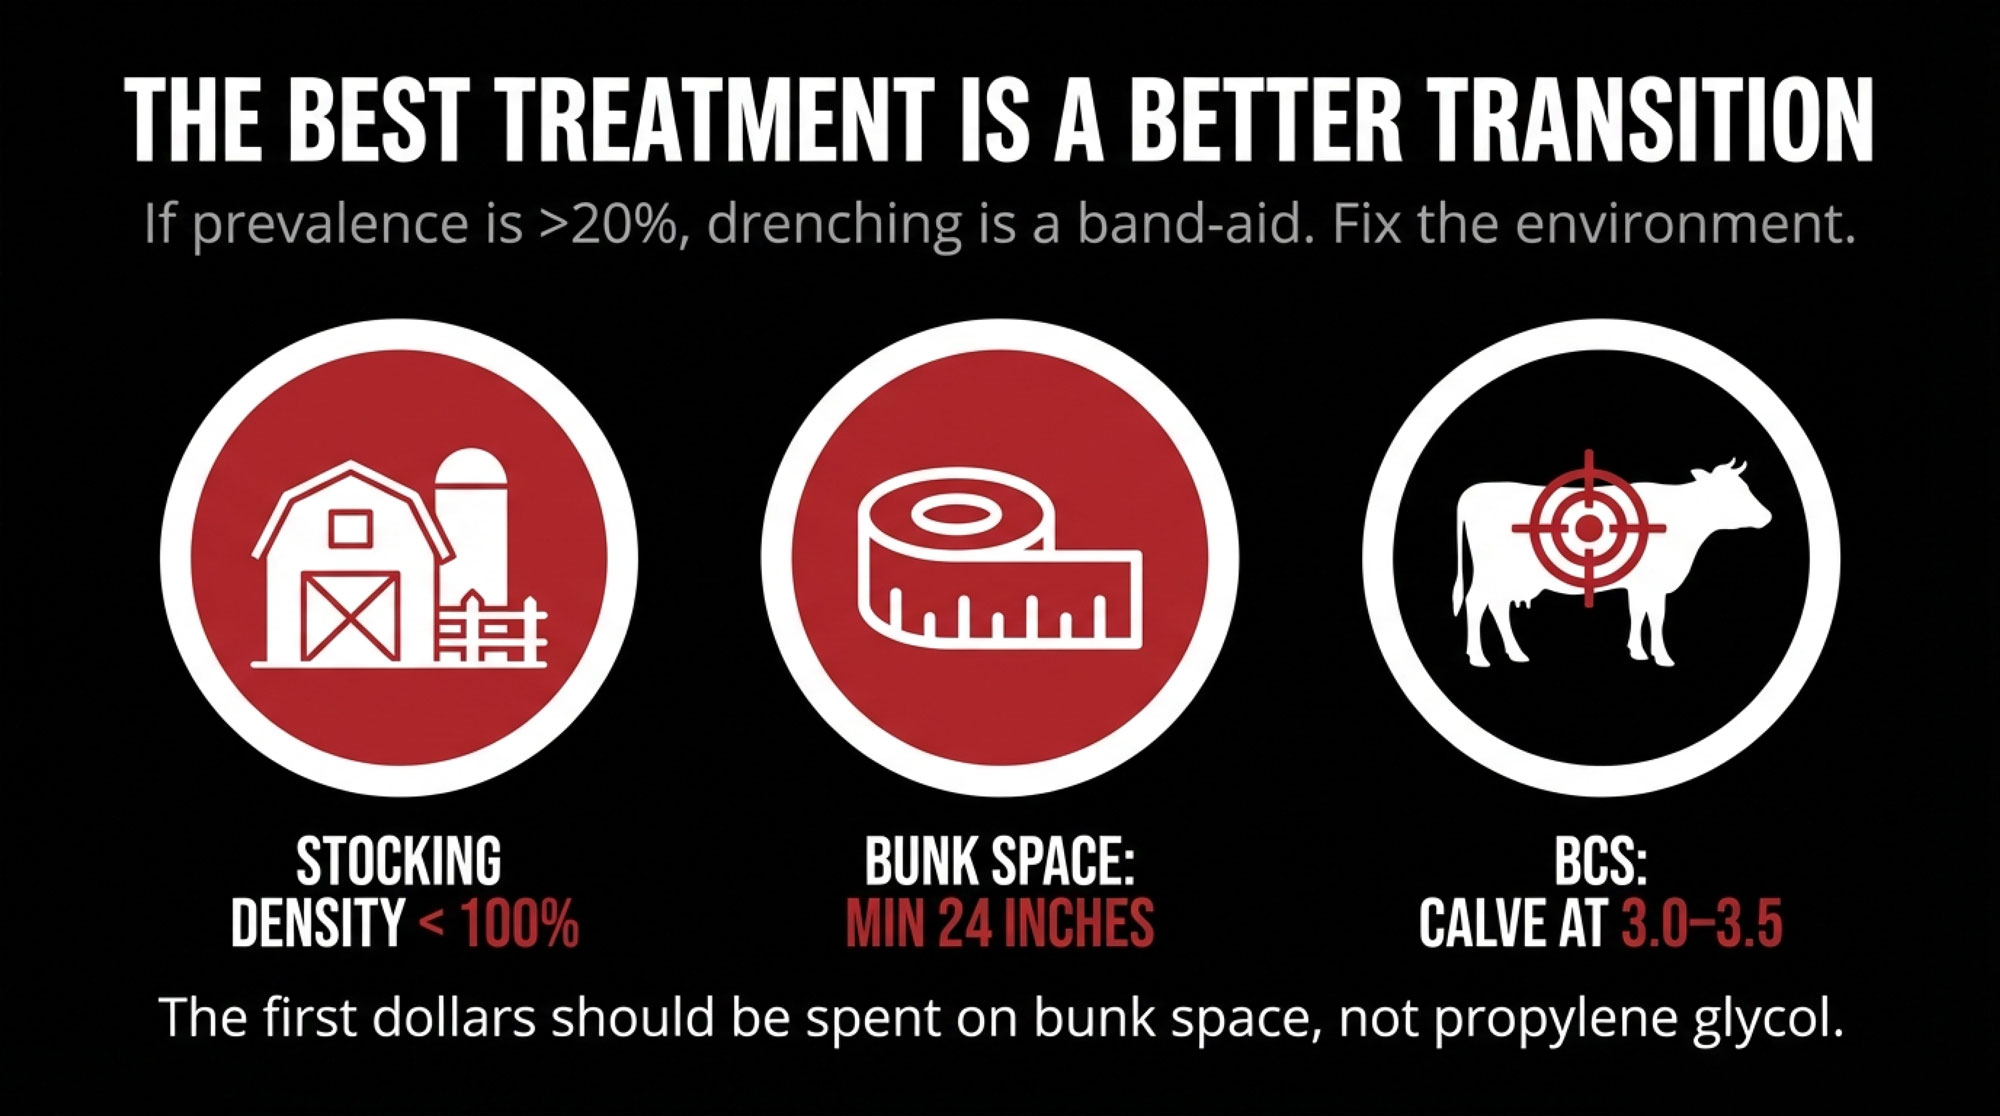
We can spend all day talking about meters and numbers, but if 20–30 percent of your fresh cows are ketotic, the biggest levers almost always live in the transition period, not in how many times you poke a cow’s ear vein.
A 2024 review on the major metabolic diseases in dairy cattle during the transition period pulled together a lot of what many of you already know from experience:
- Body condition: Cows calving too fat—BCS 3.75 or above—have a higher risk of ketosis, displaced abomasum, fatty liver, and other metabolic problems. Cows that then lose a lot of condition after calving are more likely to end up in a deeper negative energy balance, which can affect immune function and fertility.
- Stocking and bunk space: Close‑up and fresh pens that sit at more than 100 percent stocking density for stalls or bunk space see more competition, less lying time, and lower dry matter intake. Extension guidance, including work from Michigan State and others, has been pretty consistent: keep those groups at or below 100 percent and provide at least 24 inches of bunk space per cow if you want to give them a fair shot.
- Heat stress: Dry and close‑up cows under heat stress eat less, and multiple studies have shown that cooling dry cows with shade, fans, and soakers improves postpartum performance—better intake, more milk, and fewer health issues in the next lactation.
In Canada, Lactanet’s transition benchmarking has helped put numbers to what a lot of producers have been seeing. Herds that keep most cows calving between BCS 3.0 and 3.5, avoid chronic overcrowding in transition pens, and stay on top of bunk management tend to run lower rates of metabolic disease—including subclinical ketosis—while still delivering high milk and components. Similar stories come out of well-managed herds in the US Midwest and Northeast.
So if your close‑up pen is sitting at 115 percent stocking most of the time, or your Western dry cows are riding through too much summer heat without shade and water‑based cooling, it’s not hard to see how some portion of that $25–35K modeled ketosis leak is actually sitting in stocking density, bunk access and heat abatement—not just in how often you test or how much PG you buy.
The data suggest that, in many cases, the first dollars are best spent on getting body condition, stocking density, bunk space, and cooling right, and then using testing and treatment to mop up what’s left, rather than the other way around.
Looking Ahead: Breeding for “Ketosis Resilience”
One more piece that’s slowly moving from research into the barn conversation is genetics.
We’ve known for a while that mid‑infrared milk spectra can be used to predict a variety of traits beyond just fat and protein. Now, several studies have shown that MIR‑based predictions of BHB and related hyperketonemia traits have moderate accuracy and non‑zero heritability. In plain terms, some families of cows are genetically more prone to high BHB in early lactation than others.
That big Canadian study that developed the pHYK trait is a good example. When the researchers looked at thousands of lactations, cows with higher pHYK scores—meaning higher predicted ketosis risk—tended to give less milk and protein, more fat (that classic “ketotic fat cow” profile), and they had higher somatic cell counts and poorer fertility. That’s not just a one‑off cow; that’s a pattern with genetic legs under it.
The Merck Manual and other summaries have also started noting that specific genetic markers and modest heritabilities have been identified for ketosis and related metabolic traits. We’re not at the point where every proof sheet has a big “ketosis resilience” index printed on it, but the building blocks are there.
In the meantime, many breeding programs are quietly adding more health and metabolic traits into their overall indexes, and as MIR‑based BHB and pHYK predictions become more common in national evaluation systems, it’s not hard to imagine that “lower ketosis risk” will become one more dial you can turn when picking bulls and culling cows over the next decade.
So while you’re working on fresh cow management and transition nutrition in the short term, genetics is lining up to be a slow but steady ally in the background.

From “Is She Ketotic?” to “Does She Need Help Right Now?”
So, where does all of this leave you the next time you’re in the fresh group and the meter flashes 1.3?
The research and what many of us are seeing on the ground say the same thing: keep using the meter. That 1.2 mmol/L cut‑point is still a valuable benchmark for understanding herd‑level risk. The large field studies and global summaries are very clear that when too many cows are spending time above that line early in lactation, herds pay for it in disease, lost milk, and poorer reproduction. The cost‑per‑case models remind us that each one of those cows has real dollar signs attached.
What’s changed is how we interpret the number and what we do next. Instead of stopping at:
“Is this cow ketotic?”
it’s a lot more useful now to ask:
“Given this cow’s day in milk, parity, body condition, history, appetite, and BHB value, does she need help right now—and if she does, what kind of help is going to pay us back?”
If you’re looking for a simple, practical way to bring this into your next herd meeting—or your next coffee with your vet and nutritionist—here’s a five‑step checklist that many farms are using as a starting point:
- Check your prevalence once in a while.
Pick 10–12 fresh cows between days 3 and 14 in milk and see how many are at or above 1.2 mmol/L. If it’s one or two, you’re probably in the mid‑teens on prevalence. If it’s three or more, assume you’re up in that 20–25 percent‑plus zone, and it’s time to look hard at the overall transition and fresh cow program. - Build and use a risk list.
Flag older cows, over‑conditioned cows, and cows with a past DA or clinical ketosis as high‑risk at calving. Make sure they get more frequent BHB testing that first week, and that their intake, rumen fill, and early milk are watched more closely than the “easy” cows. - Rewrite your PG protocol with your vet.
Shift away from “treat everyone over 1.2” and put day in milk and risk status into the written rules. Treat the early, clearly high‑risk cows more aggressively; be willing to monitor and retest the later, lower‑risk “adapters” before you drench. - Walk your transition pens with fresh eyes.
Look at body condition distribution, stocking density, bunk space, and heat abatement in your close‑up and fresh groups. A lot of the most consistent ketosis wins still come from getting these basics right and then using diagnostics to keep score. - Use tech to focus your effort, not to replace your judgment.
Let rumination collars, FPR, ML predictions, and MIR/pHYK risk reports tell you where to look harder—which cows to test and which pens to fix. But keep the final decisions tied to what you see in front of you: the cow’s behavior, her rumen fill, her milk, her stage of lactation, and her story.
From what I’ve seen in freestalls in Wisconsin and New York, tiestalls in the Northeast, dry lot systems in the West, and pasture herds in New Zealand, the farms that combine solid transition management with this more context‑aware use of ketone testing are the ones quietly getting ahead. They see fewer metabolic surprises in the fresh pen, spend their testing and treatment dollars where they matter most, and have a lot more cows that slide into peak lactation instead of stumbling their way there.
Key Takeaways:
- The “treat every cow over 1.2” rule is quietly expensive. At roughly $200 per case, a 500‑cow herd running 25% subclinical ketosis prevalence is leaking $25,000–$35,000 a year in lost milk, extra disease and open days.
- Same number, very different risk. A 1.3 mmol/L reading on day 5 in an over‑conditioned older cow with a DA history is a red flag; that same 1.3 on day 15 in a moderate‑BCS cow eating hard and milking 95 pounds is often just high‑output physiology.
- Days 3–9 are where the money is. Elevated BHB in that early window lines up strongly with DA, metritis and lost production; after day 10, moderate elevations in otherwise healthy cows usually carry far less risk.
- Risk lists beat blanket protocols. Flag older, over‑conditioned and previously sick cows at calving, watch them closely in week one, and let lower‑risk cows prove they need help before you reach for the PG jug.
- Fix transition before you fine‑tune treatment. Stocking under 100%, 24 inches of bunk space, dry cow cooling and calving BCS of 3.0–3.5 cut ketosis prevalence more than any amount of propylene glycol after the fact.
Executive Summary:
Many herds are still using a simple “treat every cow over 1.2 mmol/L” rule for ketosis, but the economics say that blanket approach is quietly leaking money. In a 500‑cow Holstein freestall, realistic models put the cost of subclinical ketosis at roughly 200 dollars per case, which means a “normal” 25 percent prevalence can drain around 25,000 dollars a year in lost milk, extra disease, and fertility hits, and closer to 35,000 if you use more conservative cost estimates. The science behind the 1.2 mmol/L line is solid for describing herd‑level risk, yet newer work shows that timing, parity, body condition and intake completely change what a 1.3 reading actually means for an individual cow. What’s encouraging is that herds that combine risk lists (older, over‑conditioned and previously sick cows), small fresh‑cow audits, and day‑in‑milk–based treatment thresholds are seeing fewer metabolic surprises while spending less time and money treating marginal cases. The article lays out a practical fresh cow playbook that ties together better transition management, smarter propylene glycol use, targeted BHB testing, and on‑farm tech like rumination collars and MIR‑based ketosis risk to help producers cut subclinical ketosis prevalence from the mid‑20s into the teens. For progressive dairies in 2025, the core shift is moving from “Is she ketotic?” to “Given this cow’s story, does she need help right now—and what’s the most profitable way to give it?”
Complete references and supporting documentation are available upon request by contacting the editorial team at editor@thebullvine.com.
Learn More
- The $42,000 Transition Mistake: Why Blanket Protocols Are Failing Your Best Cows – Gain immediate control of your fresh pen costs with a validated three-tier protocol. This strategy breaks down how to stop over-treating low-risk cows and focus resources where they actually drive milk-in-the-tank and calving-to-breeding success.
- Squeezed Out? A 12-Month Decision Guide for 300-1,000 Cow Dairies – Exposes the structural shifts reshaping the 2026 dairy landscape and arms you with a 12-month survival guide. It reveals how to leverage component pricing and automation to outpace industry consolidation and protect your operation’s equity.
- Digital Dairy Detective: How AI-Powered Health Monitoring is Preventing $2,000 Losses Per Cow – Delivers the blueprint for using AI to predict ketosis and DAs nearly a week before they hit. You’ll gain a decisive advantage by replacing blunt treatments with precision sensors that prevent $2,000 losses per cow.
 Join the Revolution!
 Join the Revolution!
Join over 30,000 successful dairy professionals who rely on Bullvine Weekly for their competitive edge. Delivered directly to your inbox each week, our exclusive industry insights help you make smarter decisions while saving precious hours every week. Never miss critical updates on milk production trends, breakthrough technologies, and profit-boosting strategies that top producers are already implementing. Subscribe now to transform your dairy operation’s efficiency and profitability—your future success is just one click away.


