


When your best customer starts making their own milk, it’s time to rethink everything about your business model
EXECUTIVE SUMMARY: What farmers are discovering right now is that October 2025’s cheese price drop to $1.67 isn’t just another market dip—it’s the canary in the coal mine for structural changes reshaping dairy economics. Mexico’s commitment of 83.76 billion pesos toward dairy self-sufficiency through 2030 effectively removes our largest export customer, who bought $2.47 billion worth of U.S. dairy products last year and absorbed over half our nonfat dry milk exports. Meanwhile, the disconnect between DMC’s calculated $11.66/cwt margin and actual farm economics—where labor costs alone have increased by 30% since 2021, while machinery expenses have risen by 32%—reveals a safety net that no longer accurately reflects operational reality. Recent FMMO data shows protein climbing to 3.38% while butterfat hits 4.36%, creating component pricing opportunities for farms that can quickly adjust rations to capture premiums before the December 1st formula changes. With our national herd at 9.52 million head (the highest in 30 years), producing into weakening demand, and processing plants built on export assumptions that won’t materialize, the next 18 months will determine which operations successfully pivot toward margin management over volume growth. The good news? Producers layering risk management tools, optimizing beef-on-dairy programs, and adding $0.50-0.75/cwt are already demonstrating that adaptation—while challenging—remains entirely achievable, targeting protein-to-fat ratios of 0.80+ and beyond.

You know that feeling when you check the CME spot market and something just feels… off? That’s what hit most of us Monday when block cheese broke through $1.70 to trade at $1.67 on October 13, 2025. After tracking these markets for years, I’ve learned that when those established price floors start giving way, there’s usually something bigger happening beneath the surface.
Here’s the Bottom Line this week:
- Mexico’s push toward dairy self-sufficiency is reshaping export dynamics
- DMC margins no longer reflect true on-farm costs, especially labor and machinery [USDA Farm Labor Survey; U of I]
- Component pricing has flipped: protein premiums are now outpacing butterfat [FMMO data]
Mexico’s Strategic Shift: What It Really Means for U.S. Producers
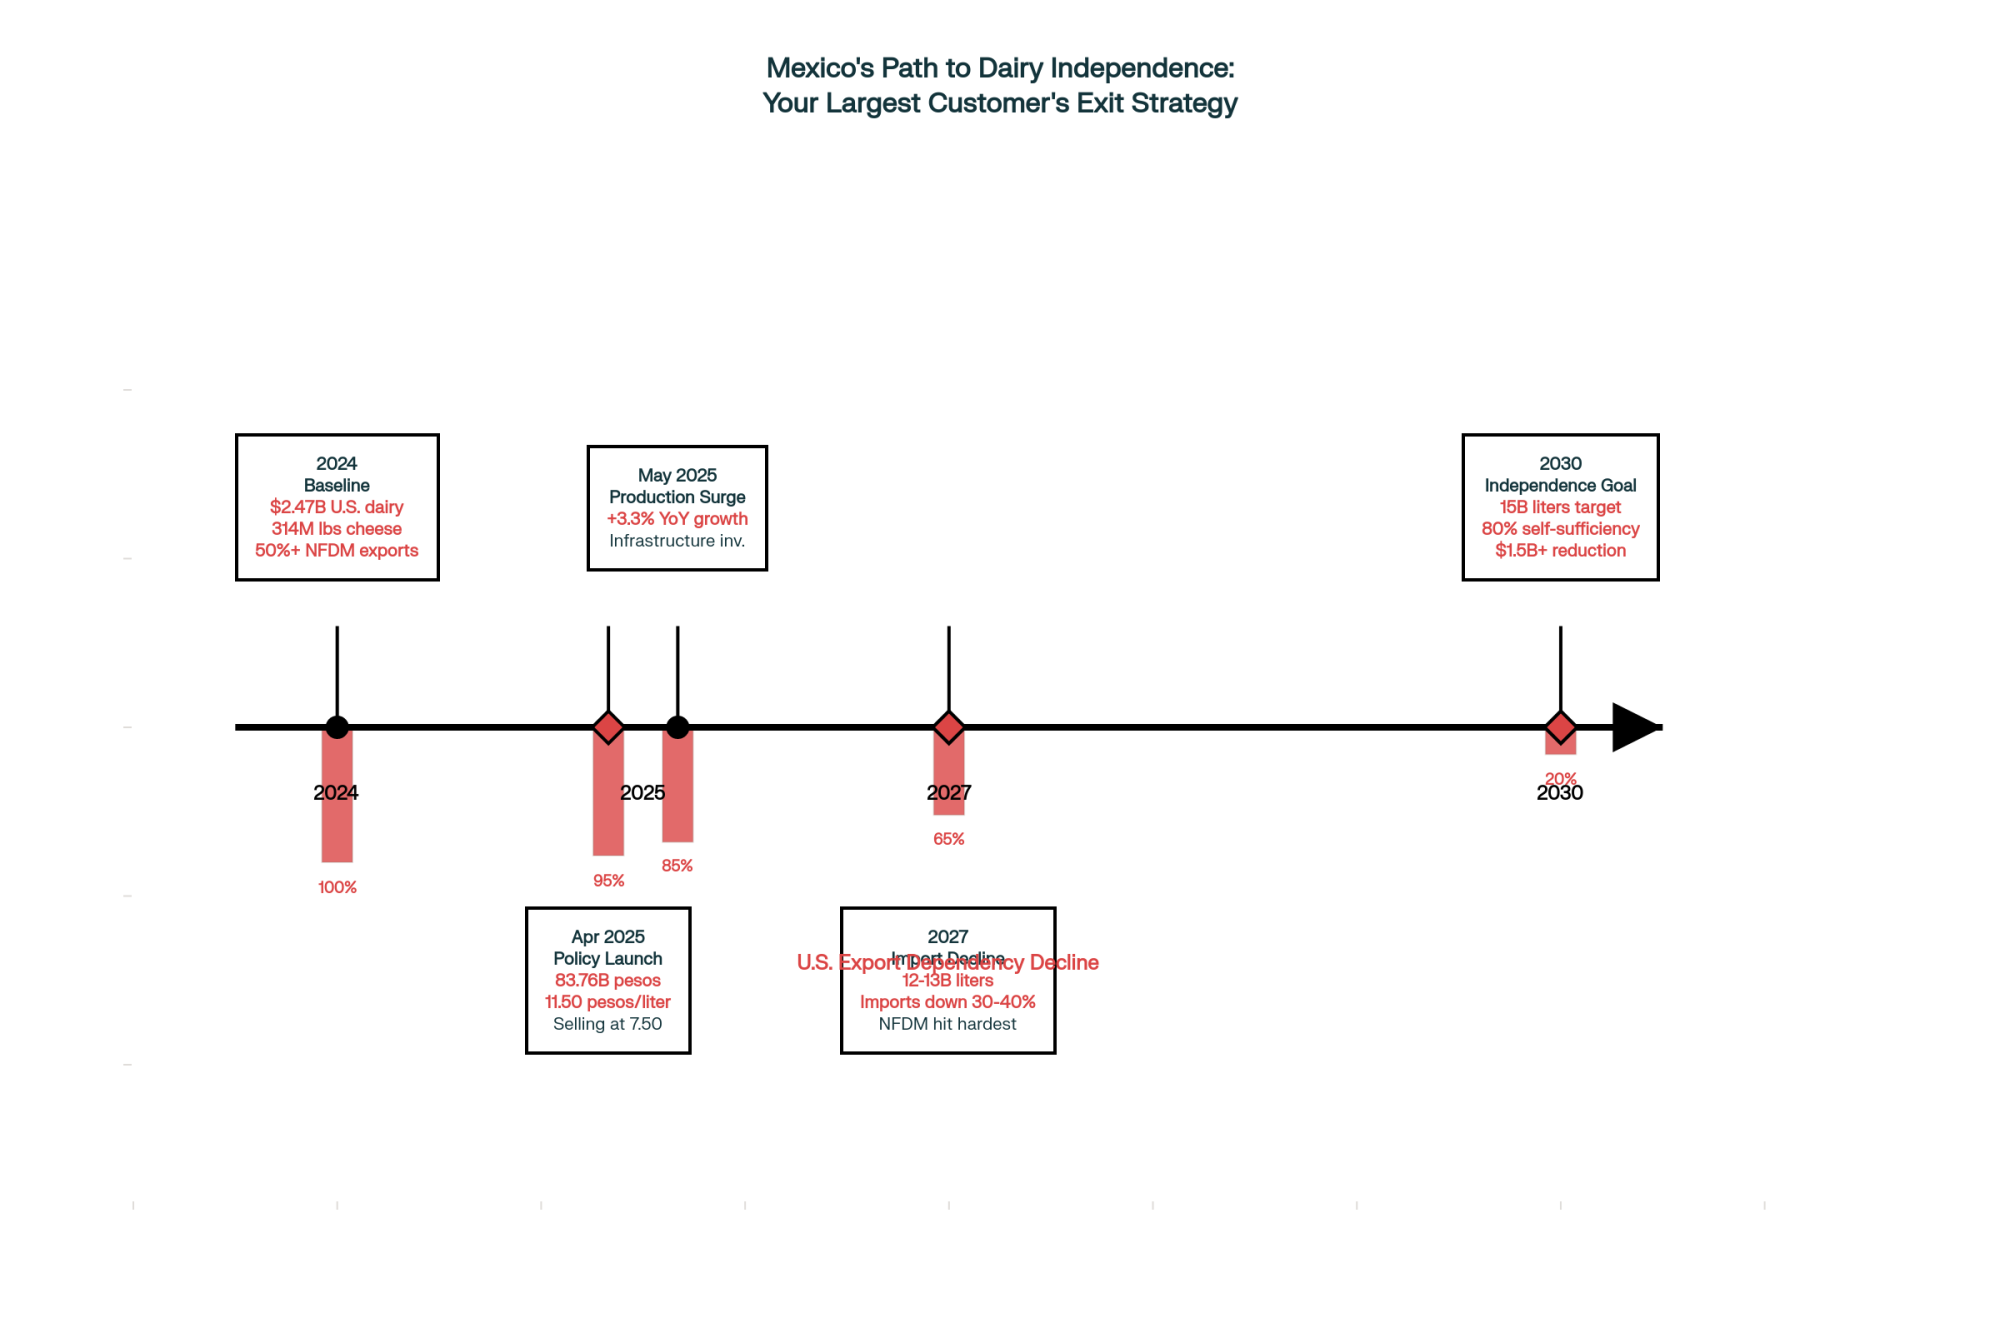
Looking at this trend, Mexico bought $2.47 billion of U.S. dairy in 2024—more than Canada and China combined. They’ve taken over half our nonfat dry milk exports and imported 314 million pounds of cheese through September 2025.
In April, President Sheinbaum announced the “Milk Self-Sufficiency Plan,” committing 83.76 billion pesos (~$4.1 billion USD) through 2030 to boost production to 15 billion liters annually and reach 80% self-sufficiency by 2030. They guarantee producers 11.50 pesos per liter while selling at 7.50 pesos—absorbing that 4-peso difference, roughly $0.22 USD per liter. What farmers are finding is that policy talk is turning into infrastructure: production ran 3.3% ahead of last year through May 2025.
The DMC Disconnect: When the Safety Net Doesn’t Match Reality
I recently had coffee with a 600-cow producer in central Wisconsin who said, “DMC shows an $11.66 margin, but I’m burning through equity just keeping the lights on”. This disconnect deserves a closer look.

The DMC formula originated when feed costs represented half of all expenses. University budget analyses now show feed often runs only 35–45% of costs—not because feed got cheaper, but because labor and machinery soared. USDA’s Farm Labor Survey documents a 30% increase in wages since 2021. A 500-cow operation can spend $300,000–400,000 annually on labor alone—about $1.50–2.00 per cwt that DMC ignores [USDA Farm Labor Survey].
Equipment costs tell a similar story. University of Illinois data shows machinery expenses jumped 32% from 2021 to 2023 and have continued upward through 2025. A 310-HP tractor at $189.20/hour in 2021 now runs $255.80/hour—financing at 7–8% adds another $0.80–1.00 per cwt [U of I].
“The DMC formula often shows acceptable margins while extension economists note significant divergence from on-farm cash flow when non-feed costs rise.”
—Dr. Mark Stephenson, Director of Dairy Policy Analysis, UW-Madison, Distinguished Service to Wisconsin Agriculture Award [UW News]
Component Pricing: Why Protein’s Suddenly the Star
| Scenario | Protein % | Butterfat % | Protein-to-Fat Ratio | Premium Before Dec 1 | Premium After Dec 1 | Monthly Gain (500 cows) |
|---|---|---|---|---|---|---|
| Current Average U.S. | 3.38 | 4.36 | 0.77 | Baseline | Baseline | $0 |
| Target Optimized | 3.45 | 4.30 | 0.80 | +$0.25/cwt | +$0.38/cwt | $1,900 |
| Wisconsin Case Study | 3.38 (from 3.12) | 4.28 | 0.79 | +$0.42/cwt | +$0.58/cwt | $2,900 |
What’s interesting here is that component pricing has flipped. Butterfat averaged 4.36% through September, up from 3.95% five years ago [FMMO data]. Protein climbed from 3.181% to 3.38% but still lags butterfat gains. Cheesemakers generally target a 0.80 protein-to-fat ratio; U.S. milk sits around 0.77, forcing processors to add nonfat dry milk powder [FMMO data].
The FMMO changes effective December 1—boosting protein factors to 3.3 lbs and other solids to 6.0 lbs per cwt—will amplify premiums for higher-protein milk [USDA AMS]. A Sheboygan herd I spoke with pushed protein from 3.12% to 3.38% in eight weeks through amino acid balancing and bypass protein, adding $0.42 per cwt, roughly $3,200 per month on 450 cows.
Herd Dynamics: When Culling Economics Don’t Make Sense
The August USDA report shows 9.52 million head—the highest in 30 years. Why keep expanding herds when margins are tight? Auction data puts replacement heifers at $3,500–4,000, and CDCB research shows cows average 2.8 lactations before exit. When cows leave before paying back replacements, the usual 35% turnover target collapses [CDCB data].
Despite record $157/cwt cull cow prices in July 2025 [USDA AMS], many producers hold onto older cows because replacing them costs more. Beef-on-dairy adds complexity: cross-bred calves fetch $1,370–1,400 at auction, so breeding for beef income often outweighs dairy replacement logic [Auction reports].
Key Takeaways for Action This Week
- Review risk coverage
– Enroll DMC at $9.50 coverage ($0.15/cwt for first 5 M lbs)
– Layer in Dairy Revenue Protection at 60–70% quarterly coverage - Optimize components
– If protein-to-fat <0.77, schedule a nutrition consult
– December 1 FMMO changes make ratios more lucrative - Assess finances
– Maintain debt service coverage >1.25
– Keep working capital >15% of gross revenue - Consider beef-on-dairy
– At $0.50–0.75/cwt extra revenue, review breeding strategy - Lean on the community
– Share experiences at coffee shops and meetings
Regional Adaptation: Different Strategies for Different Situations
| Region | Current Challenge | Winning Strategy | Premium Opportunity | Risk Level | Timeline |
|---|---|---|---|---|---|
| Wisconsin | Mid-size squeeze (500-1,500 cows) | Scale to 2,500+ OR pivot to specialty (300-400) | Specialty: $8-10/cwt | HIGH – Middle vanishing | Decide by Q2 2026 |
| Texas/New Mexico | Scale competition intensifying | Mega-scale expansion (10,000+ cows, +20% growth) | Efficiency: $0.30-0.50/cwt | MEDIUM – Capital intensive | Expand through 2027 |
| Southeast | Fluid premiums fading | Grass-fed organic + agritourism pivot | Organic: $12-15/cwt | MEDIUM – Market transition | Transition 2025-2026 |
| California | Two-tier system emerging | Central Valley scale OR North Coast farmstead cheese | Farmstead: $15-20/cwt | HIGH – Two extremes | Ongoing divergence |
| Pacific Northwest | Capacity limits + basis discounts | Regional cooperative consolidation | Limited due to isolation | VERY HIGH – Exit risk 2026 | Some exits planned 2026 |
| Northeast | High costs vs legacy markets | Local glass-bottle programs + direct sales | Direct sales: $10-12/cwt | MEDIUM – Niche viable | Building programs now |
Wisconsin’s mid-size producers face tough choices: scale up to 2,500+ cows for efficiency or shrink to 300–400 and chase specialty markets. That middle ground is disappearing.
Down in Texas and New Mexico, mega-dairies double down on scale. A 10,000-cow manager plans 20% expansion by 2027, betting automation offsets price pressures. “Every penny of efficiency multiplies,” he said.
The Southeast leans on fluid milk premiums, though processors warn they’ll fade. Several Georgia farms are shifting to grass-fed organic, accepting lower volumes for higher margins.
California’s dairy scene splits into two worlds: Central Valley mega-dairies expanding, North Coast farmstead cheesemakers thriving on agritourism and direct sales.
The Pacific Northwest battles capacity limits and isolation. Basis discounts bite, and some producers plan 2026 exits if conditions don’t improve.
The Northeast juggles legacy fluid markets with new ventures like local glass-bottle programs to offset high costs.
Global Competition: Learning from Other Exporters
The EU’s production is essentially flat (+0.15% in 2025), despite a 1% decline in herd size, with raw milk at EUR 53.3/100 kg (28% above the five-year average) [EU Commission]. They’re pivoting to value-added and sustainability premiums.
New Zealand’s Fonterra posted 103% profit growth in Q3 2025 but is divesting consumer brands to focus on B2B ingredients. Their NZ$10.00/kgMS forecast suggests confidence in fundamentals but a shift away from commodity volume.
The U.S. stands out for its $11+ billion capacity build-out on export assumptions now under pressure [IDFA]. Few competitors committed similar investment levels.
Risk Indicators: Recognizing Warning Signs Early
| Financial Metric | Healthy Range | Warning Zone | Critical Risk | Why It Matters |
|---|---|---|---|---|
| Debt Service Coverage | ≥1.25 | 1.10-1.24 | <1.10 | Cash flow to cover debt payments + cushion |
| Working Capital | ≥15% of revenue | 10-14% of revenue | <10% of revenue | Operating funds to handle market swings |
| Variable Rate Debt | ≤50% of total | 51-60% of total | >60% of total | Exposure to rate increases (7-8% currently) |
| Culling Rate | ≥30% | 25-29% | <25% | Herd turnover and productivity indicator |
| Somatic Cell Count | ≤250,000 | 250,000-300,000 | >300,000 | Milk quality affects premiums/penalties |
| Feed Efficiency | ≥1.4 lbs milk/lb DMI | 1.3-1.39 lbs/lb | <1.3 lbs/lb | Feed cost management and profitability |
Extension economists highlight key stress markers:
Financial
- Debt service coverage <1.25
- Working capital <15% of revenue
- Variable rate debt >50%
Operational
- Culling <30%
- Somatic cell count >250,000
- Feed efficiency <1.4 lbs milk/lb DMI
Behavioral
- Withdrawing from the community
- Deferred maintenance
- Increased accidents
- Family health issues
Spotting these early lets you adjust course before crises develop.
Strategic Positioning: What’s Working for Successful Operations
Conversations with top-performers reveal common themes:
- Layered risk management: DMC + DRP for comprehensive coverage
- Feed cost hedging: Options on corn/soymeal 6–12 months out protect margins
- Component focus: Hitting 0.80–0.85 protein-to-fat captures premiums
- Beef-on-dairy: Crossbred calves add $0.50–0.75/cwt; LRP support starts 2026
Looking Ahead: Probable Scenarios Through 2028

Based on talks with lenders, processors, and economists:
- Mid-2026: Zombie phase persists. Credit tightens; bankruptcies climb 55% in some regions [USDA, AFBF, UArk].
- Late 2026: More plant closures follow Saputo and Upstate Niagara moves, stranding some producers.
- 2027: Mexico’s self-sufficiency hits export volumes; global production pressures domestic prices; Class III may test mid-$14.
- 2028: Herd contracts by several hundred thousand head; Class III stabilizes around $16–17; significant exits reshape the industry.
The Human Element: Supporting Each Other
These challenges take a human toll. Farmer suicide rates run 3.5× higher than the general population, and rural rates climbed 46% between 2000 and 2020 [CDC; NRHA]. These aren’t just numbers—they’re neighbors and friends under immense pressure.
Research from land-grant universities identifies several early warning signs, including routine changes, declining animal care, family health issues, and farmstead neglect. Recognizing these patterns lets communities step in before crises deepen. For those struggling, the National Suicide Prevention Lifeline (988) and National Farmer Crisis Line (1 866 327 6701) offer confidential support from counselors who understand farm life.
The Bottom Line
Even now, opportunities exist. Producers pivoting to specialty markets report net incomes rising despite lower volumes. Beef-on-dairy revenue can offset labor cost hikes. Component optimization often pays for its cost within weeks when executed well.
The next 24–36 months will test us like never before, but this is a structural change, not a cyclical downturn. Government programs can’t restore lost export markets or close idle capacity built for vanished demand. Success will go to those who recognize new fundamentals early and adapt strategically: focus on margins over prices, relationships over volume, and long-term sustainability over endless growth.
Coffee-shop conversations may feel quieter these days, but they matter more than ever. Sharing success stories and stumbling blocks—our collective resilience and adaptability—will guide us through to a sustainable, though different, future.
KEY TAKEAWAYS:
- Capture immediate protein premiums worth $0.42/cwt by adjusting rations to hit 0.80-0.85 protein-to-fat ratios before December 1st FMMO changes—Wisconsin herds report $3,200 monthly gains on 450 cows through amino acid balancing and bypass protein strategies
- Layer risk protection starting at $0.15/cwt with DMC at $9.50 coverage for your first 5 million pounds, then add Dairy Revenue Protection at 60-70% quarterly coverage to protect margins as Mexico’s production ramps up and displaces exports
- Maximize beef-on-dairy revenue, adding $0.50-0.75/cwt to current milk checks—with crossbred calves fetching $1,370-1,400 at auction and Livestock Risk Protection coverage starting in 2026, this strategy offsets rising labor costs that DMC ignores
- Monitor three critical financial ratios weekly: debt service coverage above 1.25, working capital exceeding 15% of gross revenue, and variable rate debt below 50% of total borrowing—extension economists identify these as early warning indicators before operational stress becomes a crisis
- Choose your strategic path by Q2 2026: Wisconsin’s mid-size operations show the middle ground between 500-1,500 cows is vanishing—either scale toward 2,500+ head for efficiency, pivot to specialty markets (grass-fed, organic, local) capturing $8-10/cwt premiums, or plan an orderly exit while equity remains
Complete references and supporting documentation are available upon request by contacting the editorial team at editor@thebullvine.com.
Learn More:
- Unlocking Profitability: The Strategic Power of Beef on Dairy in Today’s Market – This guide provides the tactical blueprint for implementing the beef-on-dairy strategy mentioned in the article. It details genetic selection, calf care protocols, and marketing channels to maximize the revenue stream that adds a critical $0.50-$0.75/cwt to your milk check.
- Navigating the Choppy Waters of Dairy Exports: A 2024-2025 Outlook – While the main article focuses on Mexico, this strategic analysis broadens the lens to the entire global market. It reveals where future export opportunities may emerge and how competitive pressures from the EU and New Zealand will impact U.S. producers.
- The Data-Driven Dairy: How Precision Technology is Reshaping Herd Management and Profitability – This article explores the innovative technologies that directly combat rising operational costs. It demonstrates how investing in sensors, automation, and data analytics can improve feed efficiency, reproductive performance, and labor productivity, helping you manage margins in a tight economy.
 Join the Revolution!
 Join the Revolution!
Join over 30,000 successful dairy professionals who rely on Bullvine Weekly for their competitive edge. Delivered directly to your inbox each week, our exclusive industry insights help you make smarter decisions while saving precious hours every week. Never miss critical updates on milk production trends, breakthrough technologies, and profit-boosting strategies that top producers are already implementing. Subscribe now to transform your dairy operation’s efficiency and profitability—your future success is just one click away.


