


Your 15¢/cwt helped sell $1.75B of cottage cheese. Your Class II price went down $3.01/cwt. Explain that.
Executive Summary: Dairy farmers are still paying 15¢/cwt into a national checkoff that now bets big on TikTok creators and retail algorithms, even as the 2025 Class II price fell $3.01/cwt to $18.33 during the strongest cottage cheese demand year on record. The story opens in Andy and Sarah Lenkaitis’ Illinois barn, where influencers filmed cows and robots while milk from that 75‑cow herd headed to a plant making cottage cheese, a TikTok-helped category that’s now worth $1.75 billion. From there, it follows the money through Dairy Management Inc.’s $165.7 million 2024 budget and into campaigns DMI says returned $15.60 in retail dairy sales for every checkoff dollar, set against USDA data showing fluid milk finally up 0.8% while Class II sagged. Along the way, you get barn‑math you can actually use — from a 300‑cow herd’s roughly $12,319/year checkoff bill to a $484‑per‑cow protein price swing you can compare to your own component check. It all leads to one blunt question: if your money helped create the demand and your milk made the product, are you seeing enough of that margin in your mailbox price to call this checkoff bet a win?
Starbucks launched its Protein Lattes and Protein Cold Foam nationwide on September 29, 2025, delivering 15 to 36 grams of protein per grande. Every cup is classified as Class I milk under federal orders — priced at $21.47/cwt in 2025, a $3.14 premium over the $18.33 Class II price on cottage cheese. For your blend price, every latte beats every yogurt cup.
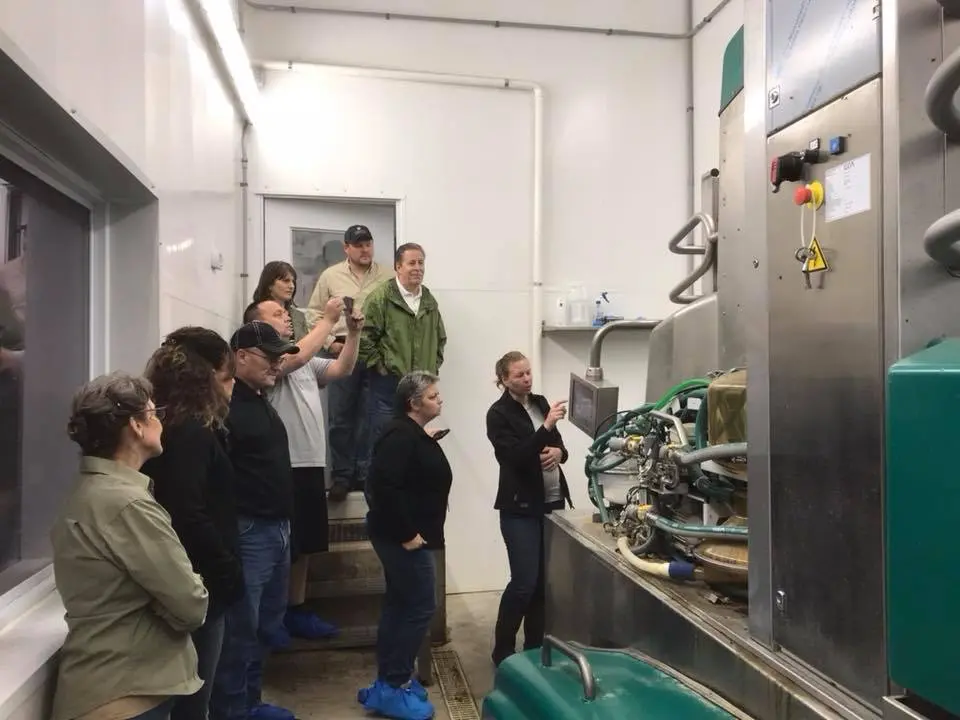
One day in early December 2024, parenting blogger Aneta Linko and her family walked into Andy and Sarah Lenkaitis’s dairy barn in Campton Hills, Illinois — one of three dairy farms left in all of Kane County. The Lenkaitis family milks about 75 Holsteins with robots, grows their own feed, and gives tours to the subdivision neighbors who now surround them on two sides. That day, though, the visitors weren’t neighbors. They were content creators, and the cameras were rolling.
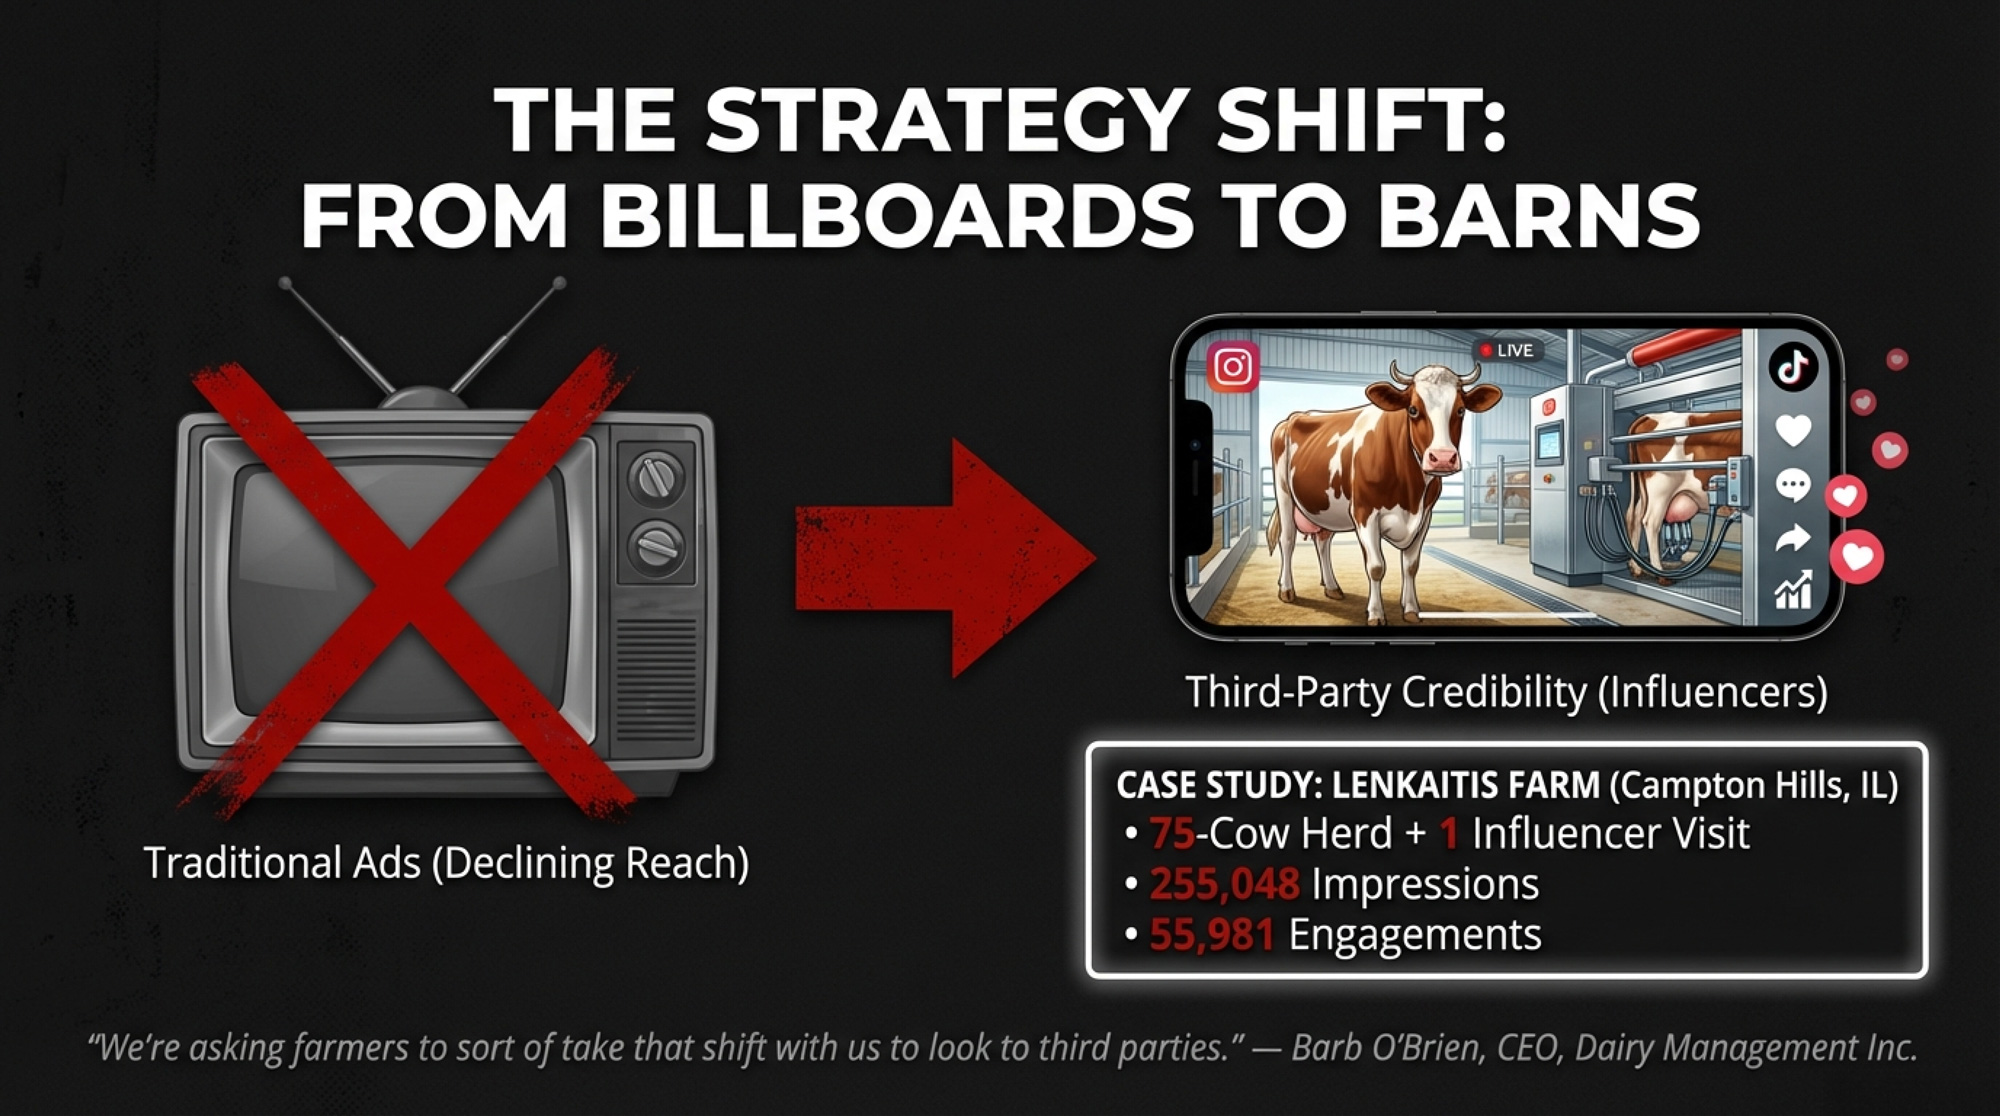
Midwest Dairy had arranged the visit. The resulting posts — Linko highlighting the family’s animal care, the robotic milking system, the quiet daily rhythms of a working farm 40 miles from downtown Chicago — generated 255,048 impressions and 55,981 engagements. One farm. One day. Quarter-million eyeballs. And every dollar that funded it came from the same place: your checkoff.
The strategy behind that visit didn’t originate in Campton Hills. It came from Barb O’Brien, President and CEO of Dairy Management Inc. On the Your Dairy Checkoff Podcast, O’Brien told producers the organization had fundamentally changed course. “We’re spending fewer dollars directly to consumer ourselves,” she said. “We’re asking farmers to sort of take that shift with us to look to third parties, who we think can bring more visibility, more credibility, and ultimately more sales.”
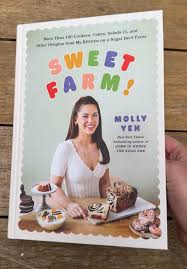
Food Network star and checkoff partner Molly Yeh — a New York Times bestselling author who lives on a sugar beet farm near the Minnesota–North Dakota border — was one of the influencers Midwest Dairy tapped for its late-2024 “Cheesy Season” campaign, which generated 10.1 million impressions. Her cookbook Sweet Farm! is built around dairy-heavy recipes from her farm kitchen. The question this article asks: does that kind of reach show up on your milk check?
Those third parties are TikTok creators, Instagram food influencers, and names like Molly Yeh and Faith Enokian. DMI’s 2024 audited financials, filed by Ernst & Young on May 8, 2025, show the scale of the shift: $165.7 million in total expenses, $127.1 million directed toward domestic marketing programs, and $76.6 million specifically in promotional and professional services. Those figures come straight from the Ernst & Young audit — confirmed to the penny in DMI’s public filings at dairycheckoff.com.
The question isn’t whether these campaigns get eyeballs. They do. It’s whether those eyeballs translate into something you can measure at the farm gate.
Why Did DMI Abandon Billboards for TikTok?
You don’t blow up a marketing playbook that worked for decades unless you’re scared. And the fluid milk numbers were scary enough.
USDA’s Economic Research Service reported in June 2022 that U.S. per capita fluid milk consumption has been falling for over seven decades. But the 2010s accelerated the damage: daily per capita consumption dropped 20.7%, from 0.62 cups in 2010 to just 0.49 cups by 2019. Analysis of USDA data (August 2025), per capita milk sales fell 28% between 2011 and 2023, averaging a 2.2% decline annually — more than four times the pre-2010 rate.
USDA noted that plant-based milk alternatives explain “some, but not all” of that decline. The bigger problem was cultural: an entire generation grew up without dairy as a default part of their day. (For a deeper dive into the decade-long decline in fluid milk consumption, The Bullvine covered the trend and its implications last year.)
DMI and the regional checkoff organizations watched those trendlines and made a bet. And the economics of the shift made it easy to justify. A TikTok ad typically runs $6 to $10 CPM (cost per thousand impressions), according to DriftLead’s 2025 digital advertising analysis. Broadcast television primetime? Anywhere from $28 to $45 CPM, depending on network and daypart, per industry planning benchmarks.
Even at the conservative end of that range, every checkoff dollar buys roughly three to five times as many eyeballs on TikTok as it would have during a primetime “Got Milk?” spot — which means DMI’s $165.7 million stretches a lot further in the digital world than it ever could have on cable. The reach is real. Whether reach translates to revenue is a different question.
What Does $12,319 a Year Buy on TikTok?
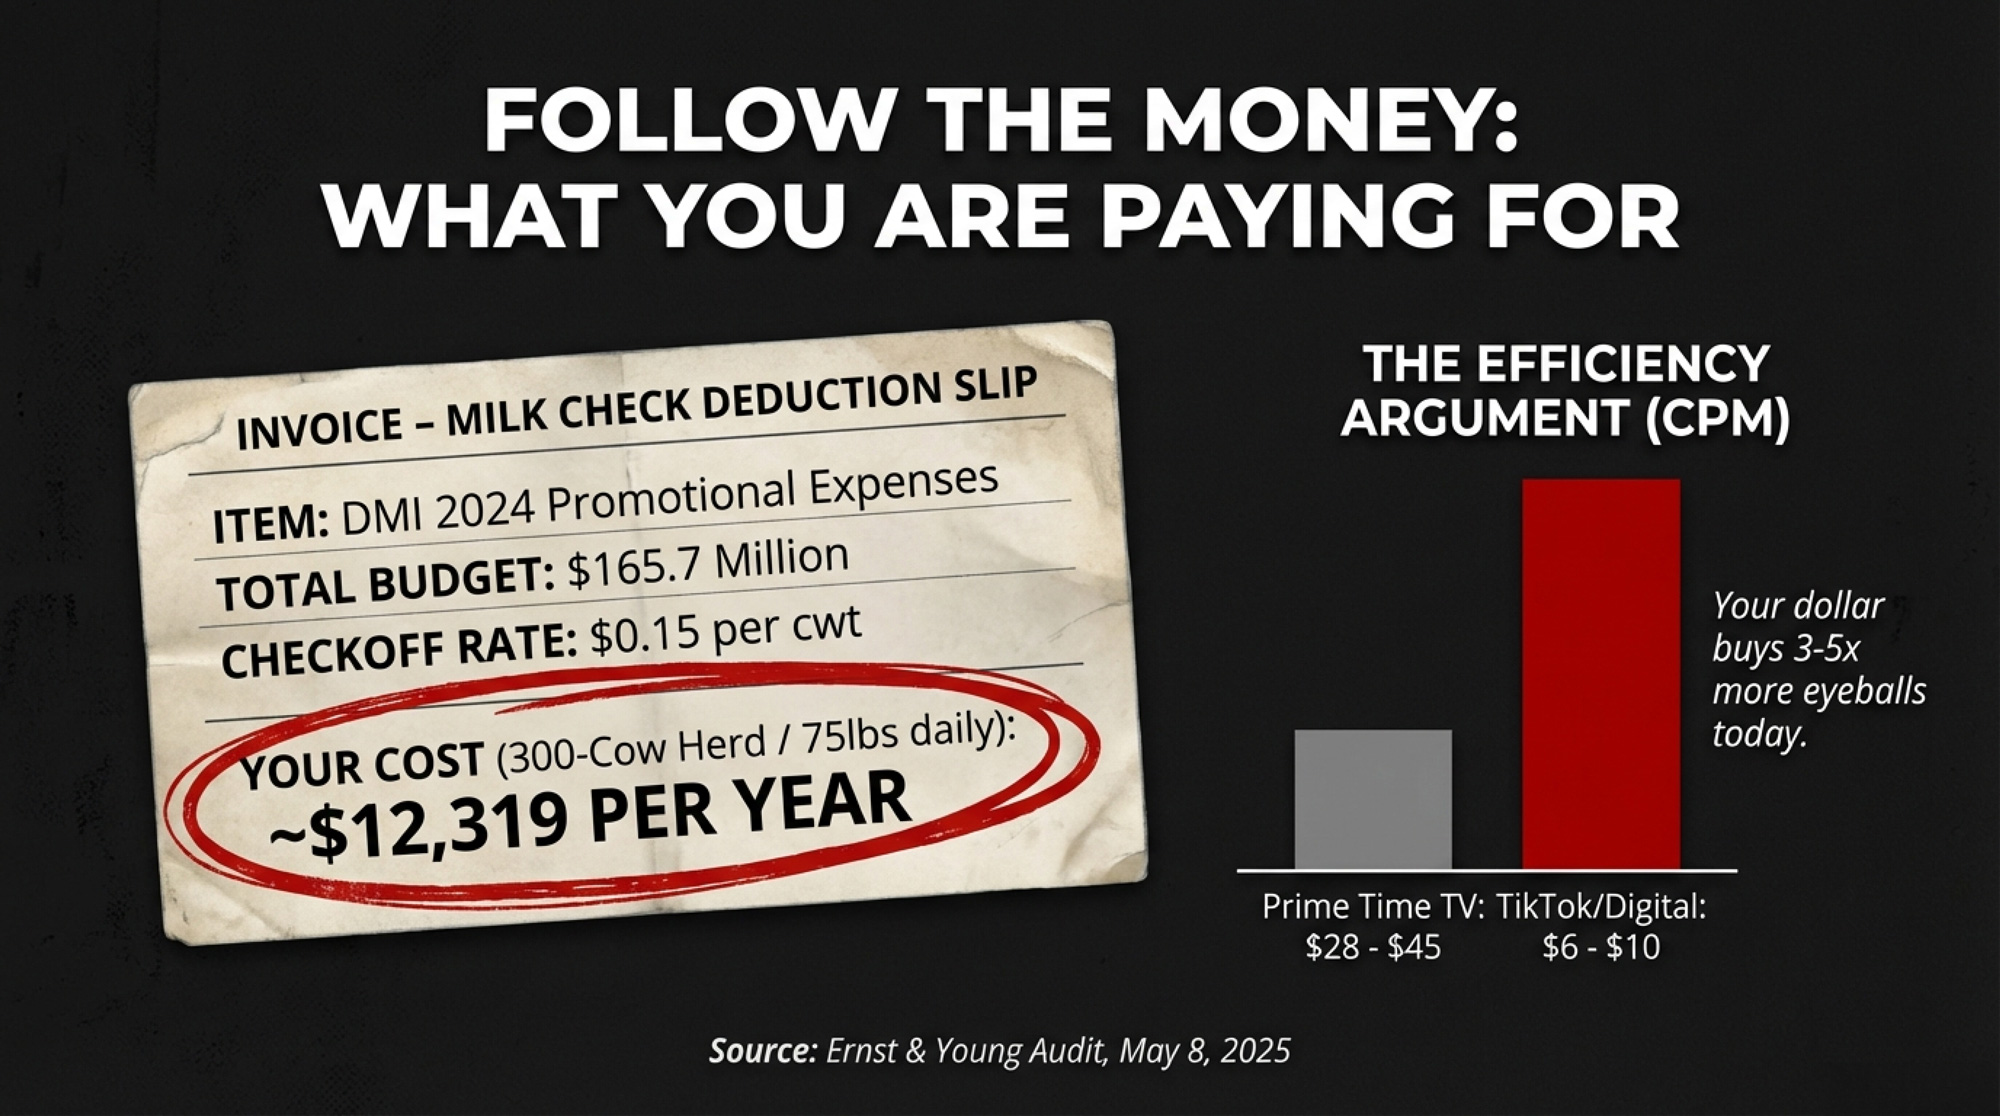
If you’re running a 300-cow herd shipping 75 lbs/day — roughly the Lenkaitis operation scaled up four times — your annual checkoff contribution at $0.15 per hundredweight works out to roughly $12,319 per year. Of that, about $0.05/cwt goes to the National Dairy Board, which funds DMI directly. The remaining $0.10/cwt can be directed to qualified state and regional programs, such as Midwest Dairy or the American Dairy Association North East. The money splits — but it all feeds the same promotional machine.
“If you think about it, some of our food service partners are spending billions of dollars,” O’Brien said on the same podcast. “But it’s a shift. We’re asking farmers to sort of take that shift with us.”
What does that machine produce? Midwest Dairy’s 2024 annual report reads less like a dairy promotion document and more like a social media agency’s pitch deck. In late 2024, the organization launched a holiday campaign it branded “Cheesy Season,” partnering with influencers Faith Enokian, Molly Yeh, and content creators Jay and Channing to produce cheese-forward recipe videos for Instagram and TikTok. The result: 10.1 million impressions, 2.3 million of them organic, and a 5.74% average organic engagement rate that Midwest Dairy says surpassed industry benchmarks.
That wasn’t their only play. Midwest Dairy also ran a broader TikTok push, collaborating with 34 influencers to create 39 videos about dairy farming, cow care, and sustainability. Those videos generated more than 5.2 million impressions, comfortably exceeding the original 4-million target. A brand-lift study found an 11-point increase in viewers’ perception that dairy animals are treated humanely and a 5-point increase in the view of dairy farmers as environmentally responsible.
DMI reported another metric from its annual meeting in October 2024: an e-commerce strategy conducted with 14 state and regional checkoff organizations — running campaigns on Instacart, Walmart, and Dollar General — delivered a return of $15.60 in retail dairy sales for every dollar invested by the checkoff. But here’s the translator’s note on that number: $15.60 in retail sales is not $15.60 back to you.
If most of that margin stays with Walmart and the processor — and right now, nobody’s publishing the downstream split — then the gap between that $15.60 and what actually reaches your bulk tank could be a lot wider than that number suggests. It’s the right metric to start with. It’s just not the metric that answers the question producers are actually asking.
Did a TikTok Dance Actually Sell $1.75 Billion in Cottage Cheese?
The cottage cheese story is the one that makes the whole strategy look like genius—or at least very good timing.
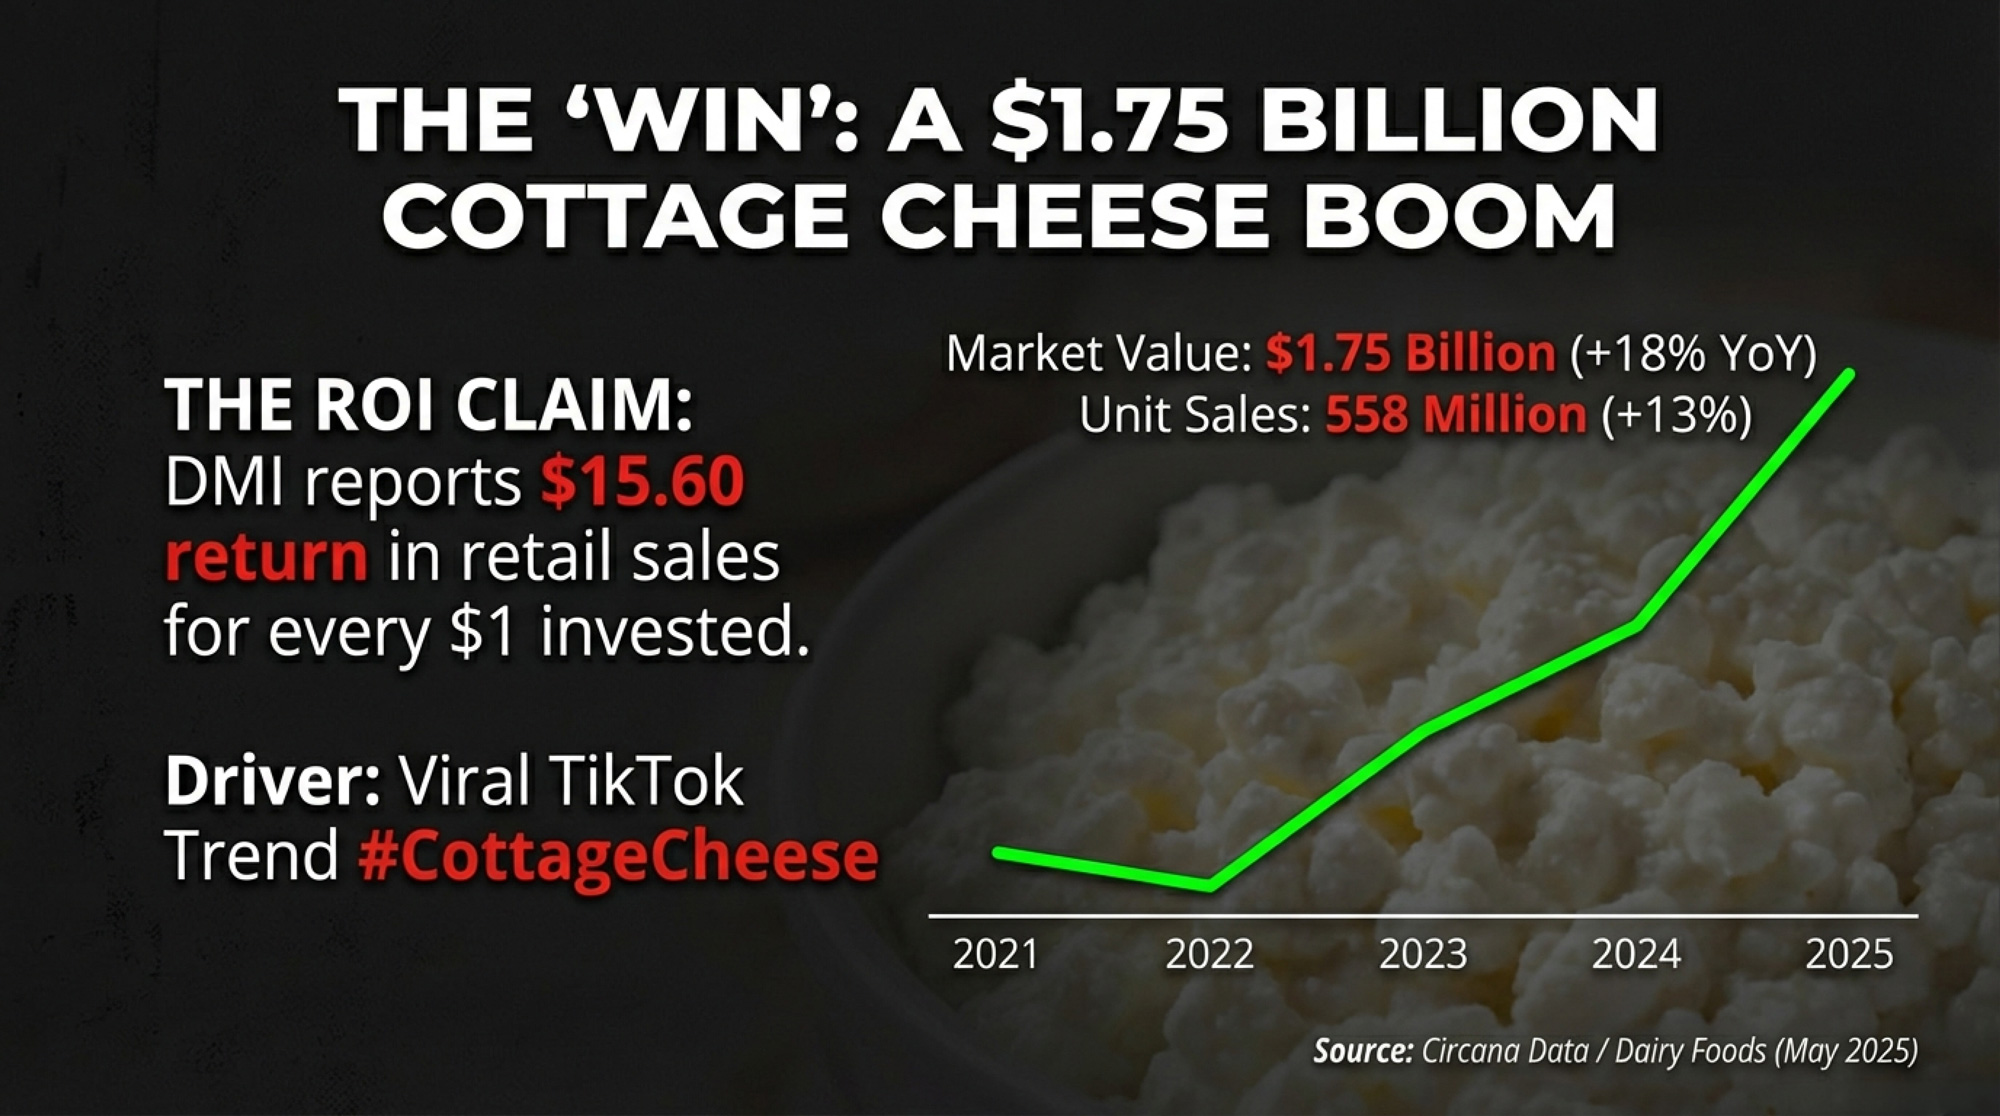
U.S. cottage cheese retail sales had actually declined in 2021, according to Circana data reported by CNN in July 2025. Then TikTok creators discovered it as a high-protein, low-effort substitute for everything from ice cream to pizza dough. The sales response was rapid and sustained: 11% growth in 2022, roughly 17% in both 2023 and 2024, and a 20% surge in the 52-week period ending June 15, 2025.
For the 52 weeks ending February 23, 2025, cottage cheese hit $1.75 billion in total U.S. dollar sales — an 18% year-over-year increase — with unit sales up 13% to 558 million, per Circana data reported by Dairy Foods (May 2025).
The growth wasn’t limited to one brand. Good Culture, the Irvine, California-based challenger brand co-founded by Jesse Merrill, saw dollar sales jump 75% to $187 million. Daisy Brand’s cottage cheese line surged 32% to $352 million. And private label led the way overall at $612 million, up 14% year-over-year.
The feedback loop that made it self-sustaining was simple: creators chased engagement with cottage cheese hacks → brands and checkoff-funded programs amplified the best-performing content → more viewers saw cottage cheese as the default protein ingredient → more creators made cottage cheese content. Storyful’s narrative analysis found cottage cheese content generating around 4 million engagements in just a few weeks, turning what they called a “boring” 1970s diet food into a global trend.
It looks organic. And some of it genuinely was. But DMI’s own strategy explicitly calls for leveraging third-party voices rather than running direct-to-consumer campaigns. The line between an authentic TikTok trend and a checkoff-amplified one is blurrier than you’d think.
What Does a Protein Latte in Seattle Mean for a Farmer in Wisconsin?
The cottage cheese story is about cultured dairy, but the fluid milk side of this equation matters just as much — maybe more, given those decades of declining consumption.
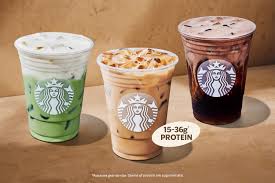
Starbucks launched its Protein Lattes and Protein Cold Foam nationwide on September 29, 2025, delivering 15 to 36 grams of protein per grande. Every cup is classified as Class I milk under federal orders — priced at $21.47/cwt in 2025, a $3.14 premium over the $18.33 Class II price on cottage cheese. For your blend price, every latte beats every yogurt cup.
In September 2025, Starbucks rolled out Protein Lattes and Protein Cold Foam drinks built on protein-enriched milk. A grande Protein Latte delivers 27-36 grams of protein. The protein cold foam alone adds 15 to 18 grams per beverage, depending on flavor, according to Starbucks’ own nutrition data. Customers can swap protein-boosted 2% milk into any hot or iced drink on the menu.
Here’s why that matters to your blend price. Standard milk in a latte — every grande, every venti, every carton in the grab-and-go cooler — is classified as Class I under the federal order system. In 2025, the Class I price averaged $21.47 per hundredweight across all federal orders, according to dairy market analyst William Pollock’s calculation from USDA advance pricing data. Class II — the category covering cottage cheese, yogurt, and other soft-manufactured products — averaged just $18.33/cwt for the full year, per USDA Agricultural Marketing Service data released February 4, 2026.
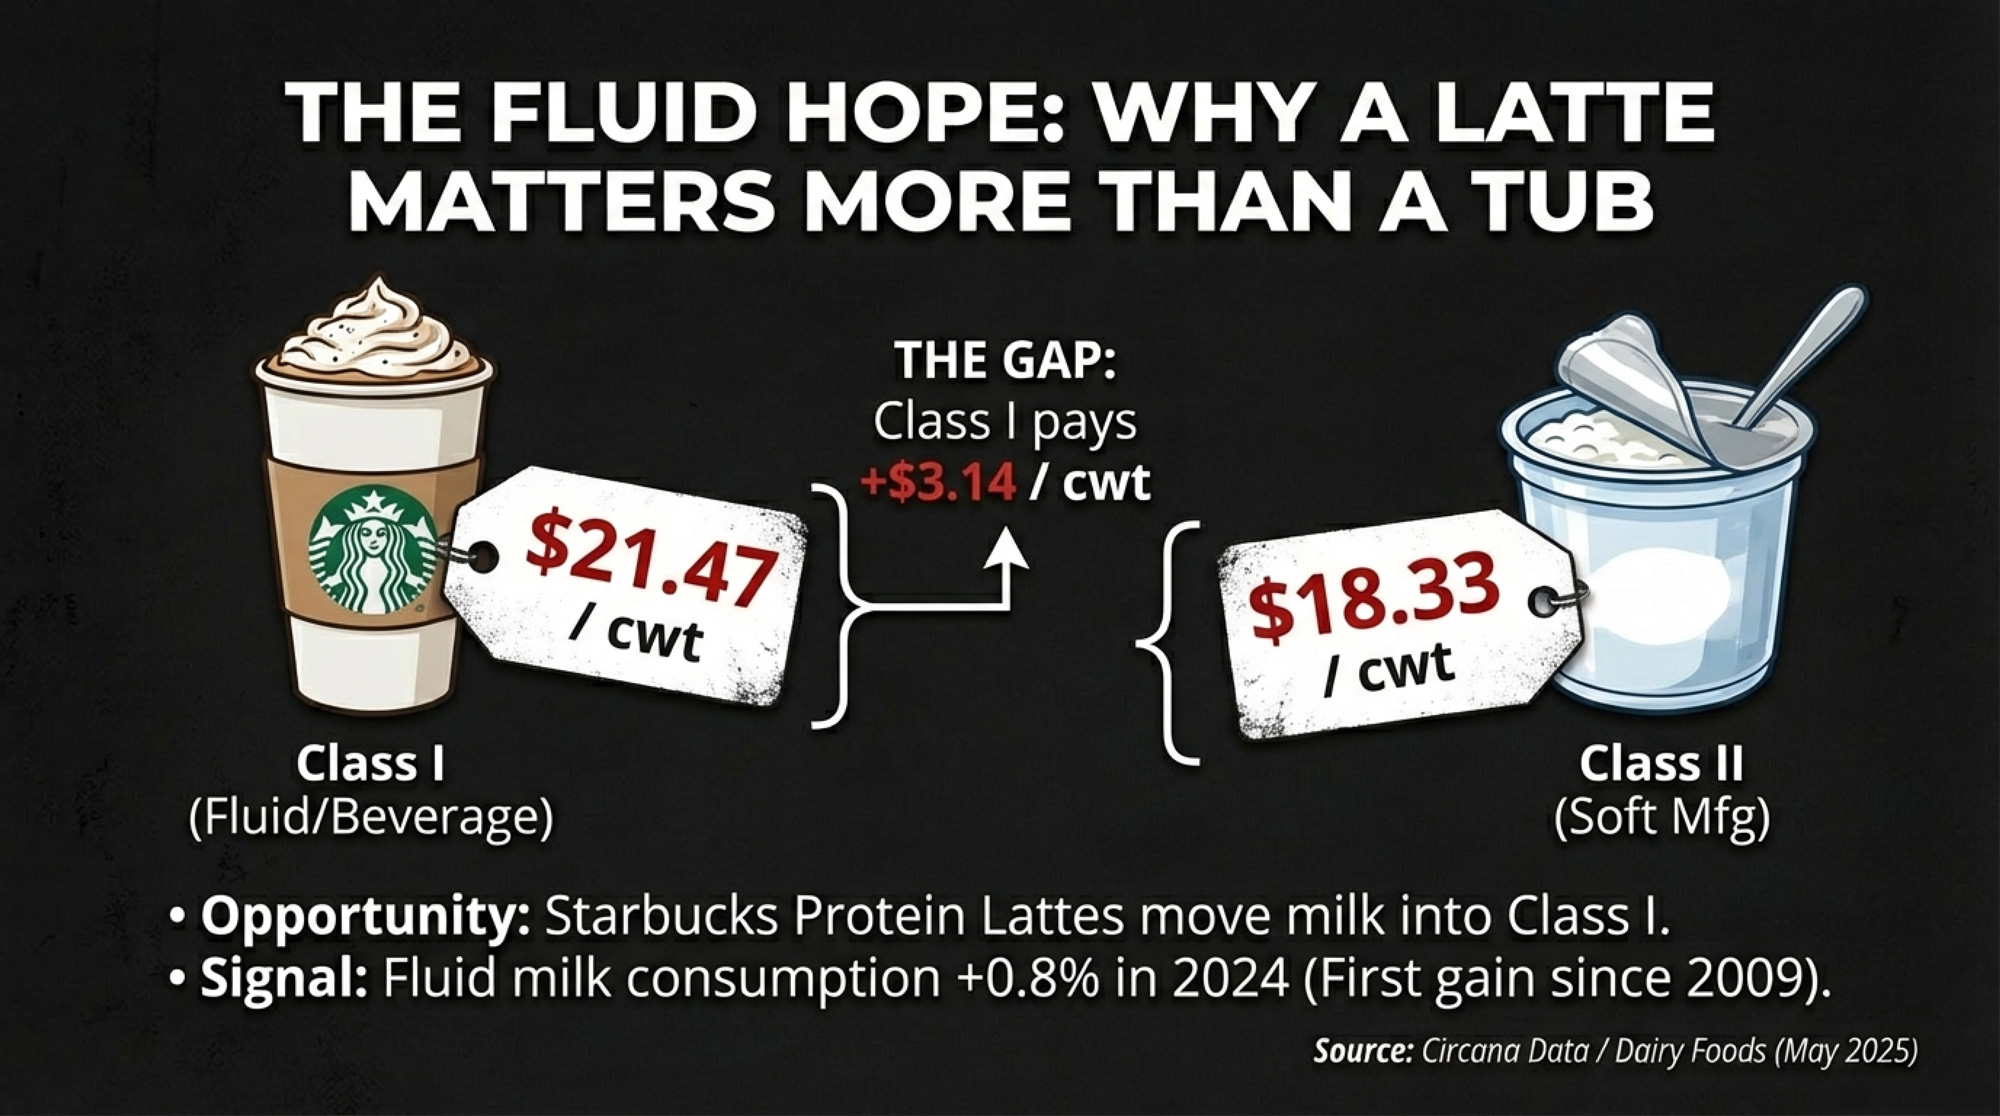
That’s a $3.14 gap per hundredweight. Every gallon of milk that flows across a Starbucks counter instead of into a cottage cheese vat is priced higher, pushing the blend price up for every producer pooled on that order. When the checkoff helps position dairy as a protein-forward performance beverage, it’s not just brand-building—it’s nudging milk toward the highest-value utilization class.
| Milk Utilization Class | 2025 Avg Price ($/cwt) | Premium vs. Class II |
| Class I (Fluid Milk) | $21.47 | +$3.14/cwt |
| Class II (Cottage Cheese, Yogurt, Ice Cream) | $18.33 | baseline |
| Class III (Cheese) | $19.68 | +$1.35/cwt |
| Class IV (Butter, Powder) | $19.21 | +$0.88/cwt |
And there’s reason to think the broader fluid momentum is real. USDA data show total U.S. fluid milk sales were up about 0.8% in 2024 from the year prior — the first year-over-year gain since 2009, ending a 14-year streak of annual declines, according to the National Milk Producers Federation. Midwest Dairy board chair Charles Krause confirmed the significance in the organization’s spring 2025 newsletter: “For the first time since 2009, fluid milk consumption has shown a slight increase.”
That’s a genuine milestone. But one year of 0.8% growth doesn’t erase seven decades of structural decline — and Starbucks’ protein lattes launched too recently to have influenced 2024 numbers. They’re a forward-looking bet, not a proven demand driver yet. If protein-forward dairy gains traction in café and quick-service channels, the 2024 uptick could strengthen. That’s a big “if.”
Is Any of This Actually Reaching the Bulk Tank?
Now for the uncomfortable part.
The demand signals are undeniably strong. Cottage cheese is a $1.75 billion category growing at 18% annually. Starbucks is building protein milk into its core menu. DMI’s 2024 annual report states that consumer spending and volume sales increased across all domestic dairy categories — cheese, milk, yogurt, ice cream, frozen novelties, and butter. Every single one.
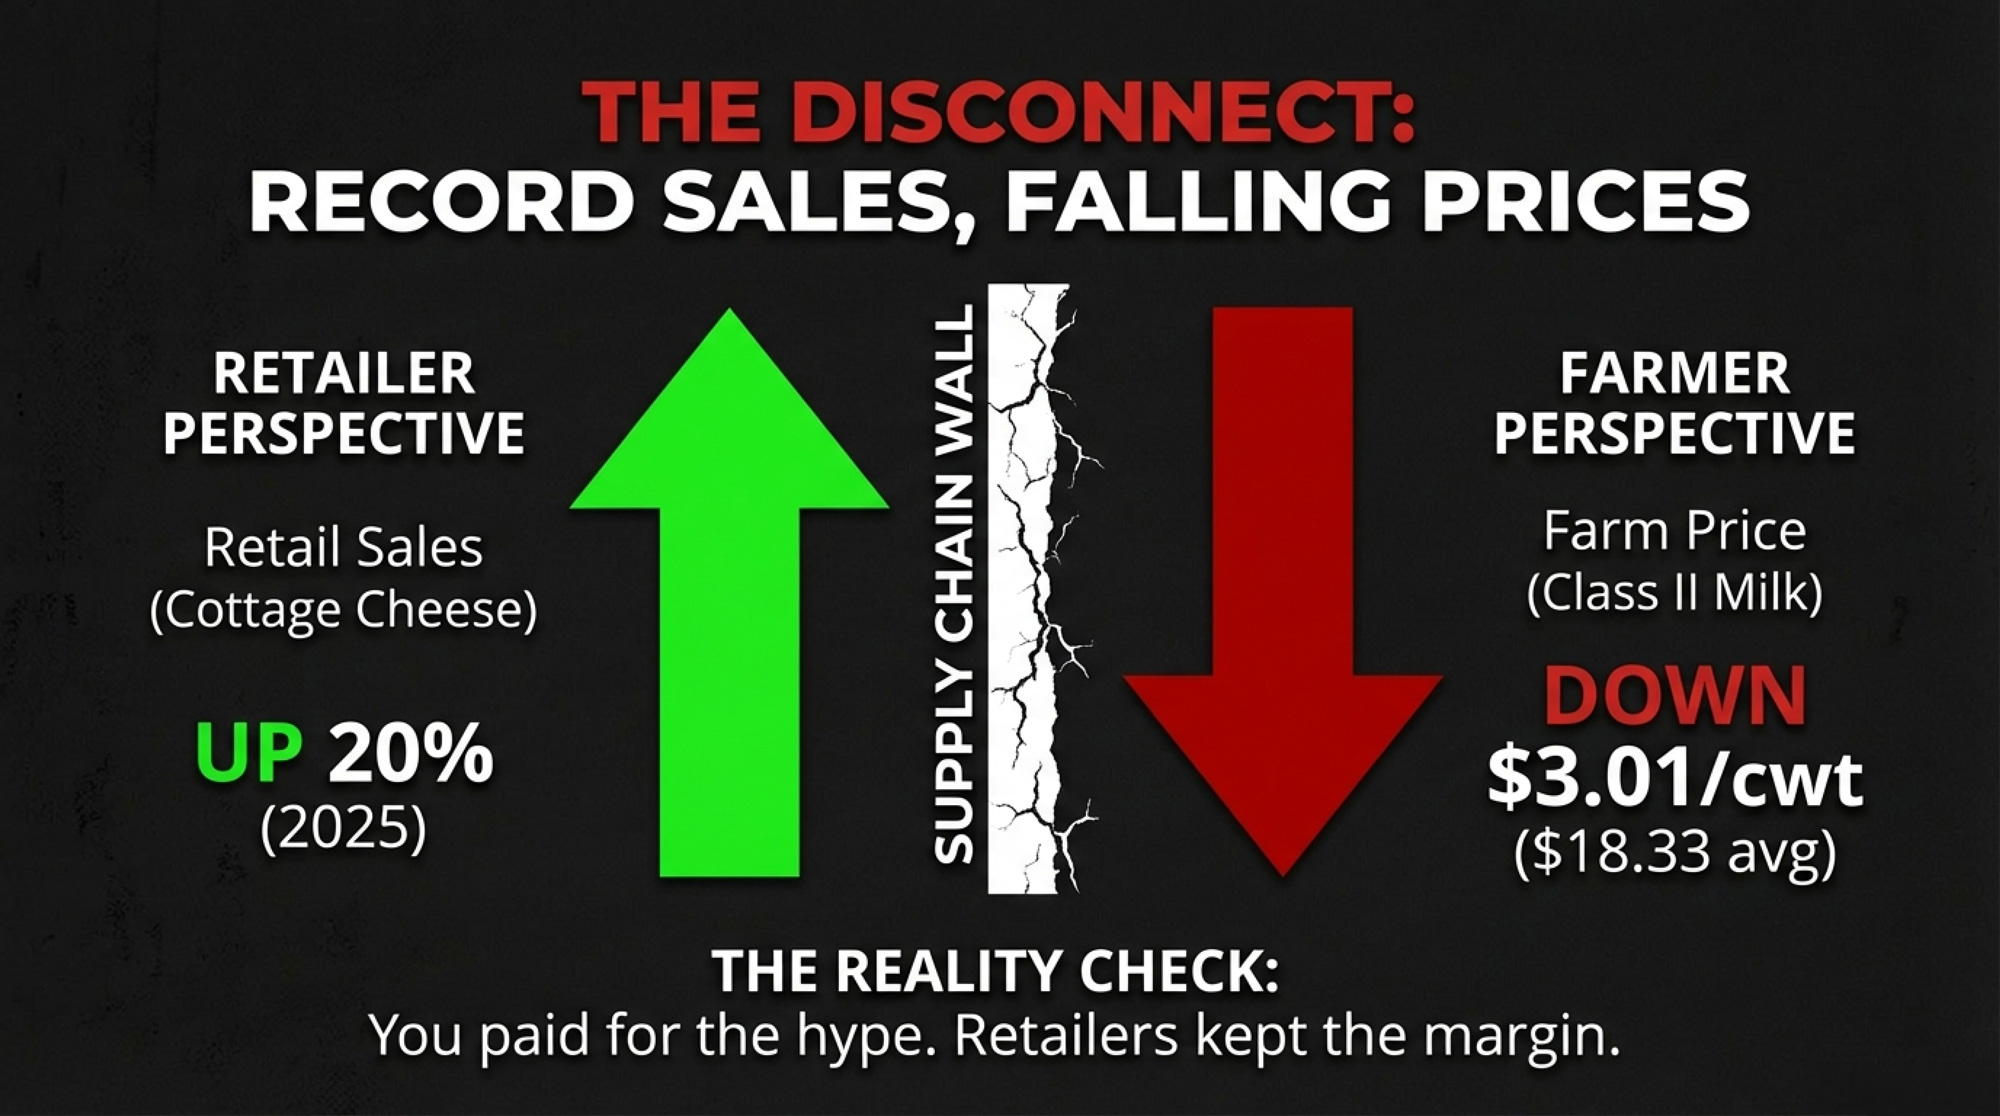
But look at this number. Cottage cheese is a Class II product under the Federal Milk Marketing Order system. And the average Class II price in 2024 was $21.34 per hundredweight, according to USDA’s Agricultural Marketing Service — a figure independently verified against Cheese Reporter’s monthly Class price data. In 2025 — while cottage cheese sales were surging 20% — the full-year average Class II price fell to $18.33 per hundredweight, per USDA AMS data released February 4, 2026. That’s a decline of $3.01/cwt during the single strongest cottage cheese growth year on record.
| Metric | 2024 | 2025 |
| Cottage Cheese Retail Sales | $1.48 billion | $1.75 billion |
| Year-Over-Year Retail Growth | +17% | +18% |
| Cottage Cheese Unit Sales | 477 million | 558 million |
| Average Class II Price ($/cwt) | $21.34 | $18.33 |
| Class II Price Change ($/cwt) | — | –$3.01 |
| DMI Marketing Expenses | $165.7 million | (not yet reported) |
Think about what that means for the Lenkaitis farm specifically. Andy Lenkaitis told the DuPage County Farm Bureau that their milk ships to a plant in Rockford, Illinois, “where it’s made into cottage cheese and sour cream.” That plant — formerly Dean Foods, now operated by Dairy Farmers of America after DFA acquired 44 Dean facilities for $433 million in May 2020 — is still certified for cottage cheese and sour cream production today.
The Lenkaitis family’s checkoff dollars helped fund the influencer visit to their own barn. The resulting content drove a quarter-million impressions, telling consumers to trust dairy and buy dairy. Consumers apparently listened — cottage cheese sales are up 20%. And the Class II price on the product made from their own milk went down three bucks.
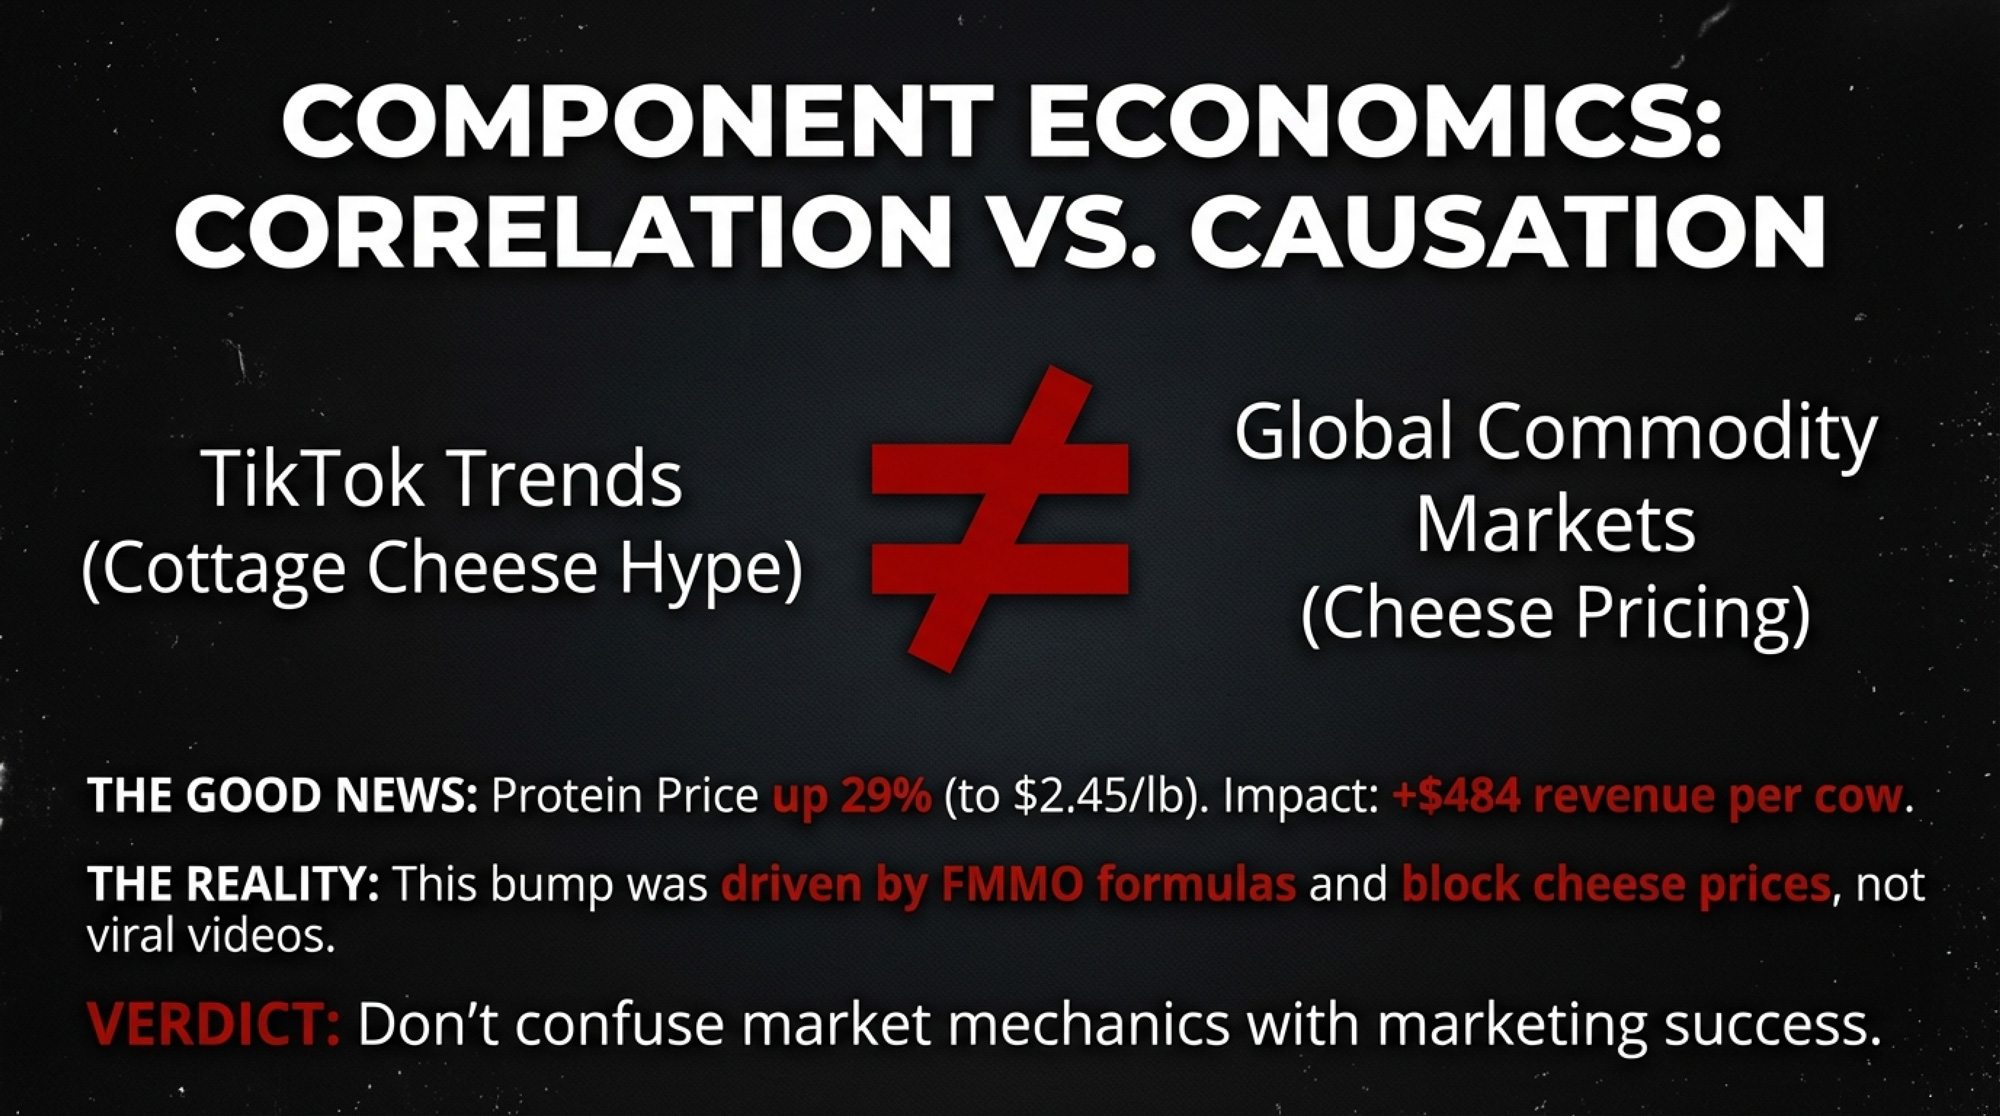
Run the quick math on protein, and the picture changes—but it’s still mixed. The federal order protein price averaged $1.8961 per pound in 2024 and rose to $2.4495 per pound for full-year 2025 — a 29% increase, per USDA AMS data. On a 300-cow herd shipping 75 lbs/day at 3.2% protein, that shift in protein price alone represents roughly $145,000 more in annual revenue, or about $484 per cow. But protein prices are driven by cheese commodity values and the FMMO pricing formulas, not directly by cottage cheese retail sales or TikTok impressions. (For a deep look at how FMMO component prices actually move your check, our March 2025 analysis breaks down the mechanics.)
| Month | Protein Price ($/lb) | Cottage Cheese Sales Growth (% YoY) |
|---|---|---|
| Jan 2024 | $1.85 | +12% |
| Apr 2024 | $1.92 | +14% |
| Jul 2024 | $1.98 | +16% |
| Oct 2024 | $2.12 | +17% |
| Jan 2025 | $2.28 | +18% |
| Apr 2025 | $2.41 | +19% |
| Jul 2025 | $2.47 | +20% |
| Oct 2025 | $2.52 | +19% |
| Dec 2025 | $2.49 | +18% |
The connection between a viral recipe and your component check runs through layers of commodity pricing, processor margins, and utilization formulas that can muffle, delay, or redirect the demand signal entirely. Consumer demand for dairy products is stronger than it’s been in years. Possibly decades. But the distance between a $7.99 tub of Good Culture cottage cheese and your mailbox price is long, and much of the margin lives somewhere in between.
Options and Trade-Offs for Producers
Know what your checkoff is buying — within the next 30 days. Pull up your regional checkoff’s annual report. Midwest Dairy publishes theirs online. So do most others. Look at how contributions are split between influencer marketing, foodservice partnerships, nutrition education, and export.
DMI’s 2024 audited financials are public at dairycheckoff.com — $76.6 million went to “promotional and professional services” alone. You’re paying into this system. You should know what it’s producing, and you have every right to ask your regional board for specific ROI metrics, not just impression counts. The $15.60-per-dollar return DMI reported on its e-commerce campaigns is the kind of number you want to see across every major initiative — and remember, that’s a retail-sales metric. Push for data on what happens between the cash register and your bulk tank.
Track whether consumer demand is showing up in your component premiums. Compare your protein and butterfat premiums over the next 90 days against the 12-month trailing average. The federal protein price jumped from a $1.90/lb average in 2024 to $2.45/lb in 2025 — but that’s largely a cheese-price story, not a cottage-cheese-TikTok story. If your premiums are tracking commodity markets but not reflecting the surge in retail demand, that’s a conversation worth having with your processor or co-op: who’s capturing the margin between $1.75 billion in retail sales and what’s flowing back to your farm?
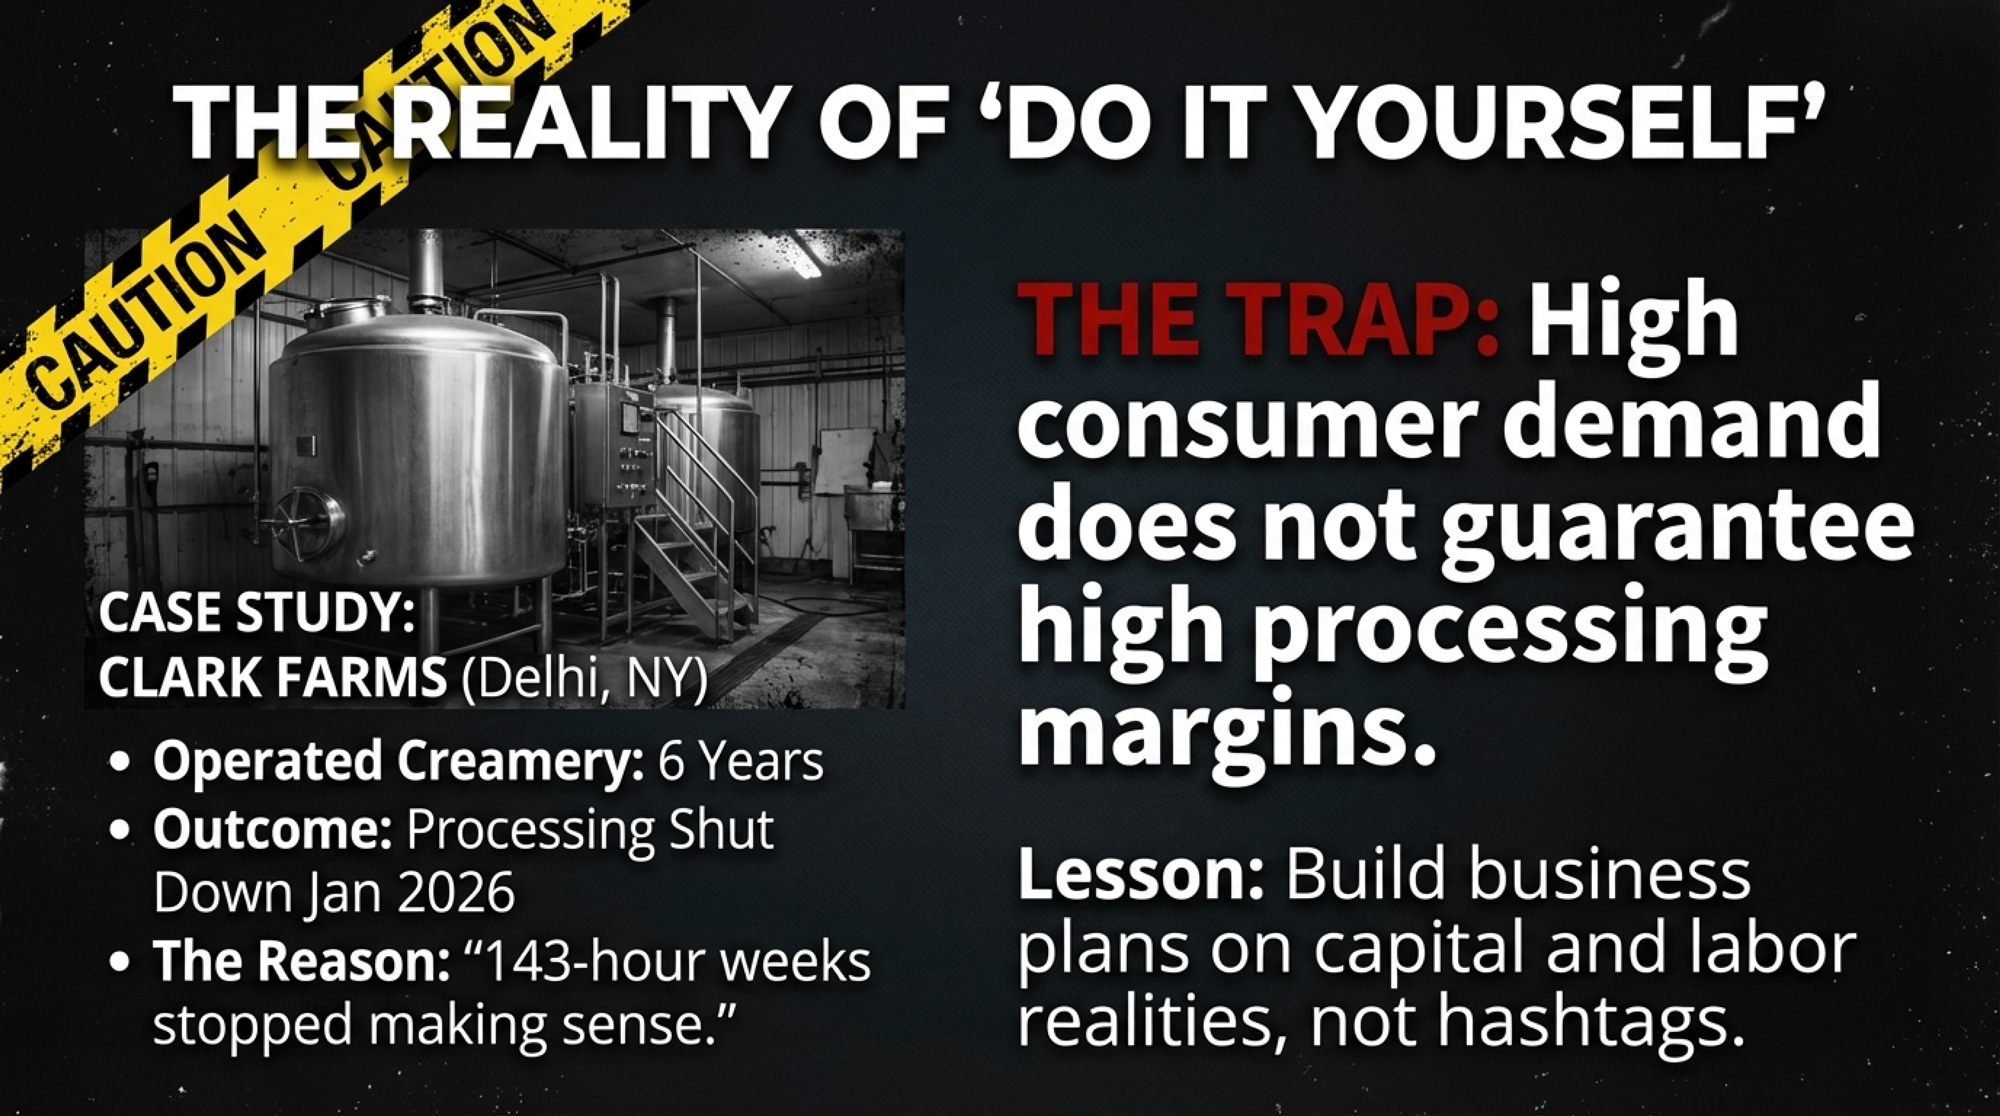
If you’re considering a direct-to-consumer approach, proceed with caution. Cottage cheese and artisan butter are the two cultured-dairy categories with the strongest consumer demand right now. If you’re within driving distance of a metro area and have the appetite for on-farm processing, the demand environment hasn’t been this favorable in years. But direct-to-consumer requires capital, permits, a completely different skill set, and patience.
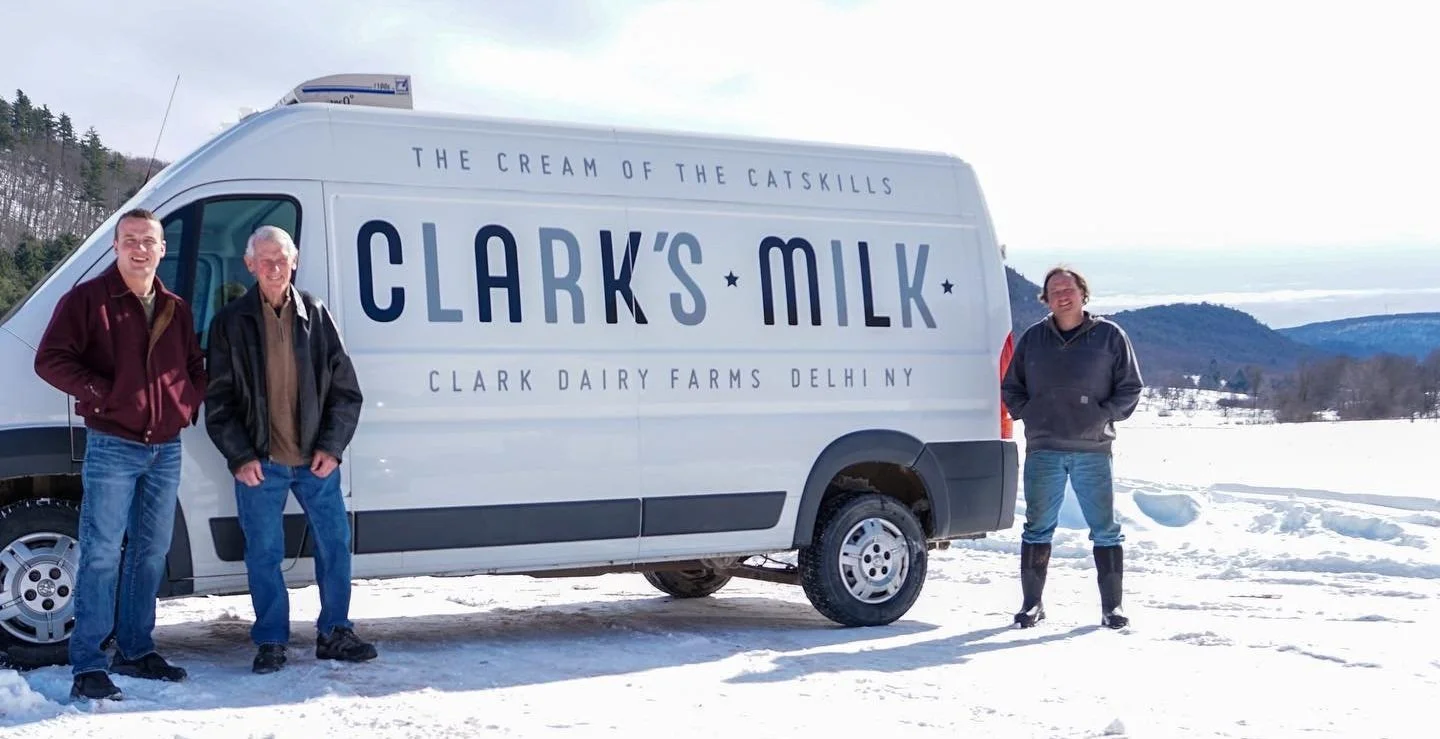
The Clark family — five generations on Elk Creek Road in Delhi, New York — beside the delivery van that carried “The Cream of the Catskills” to dozens of local accounts. On January 28, 2026, owner Kyle Clark shut the creamery down, citing 143-hour weeks and a staff of six doing the work of ten. The cows are still milking. Demand wasn’t the problem. Read More
Clark Farms in Delhi, New York, ran a creamery for six years with dozens of local accounts — then shut down the processing side in January 2026 while keeping the cows milking, because 143-hour weeks stopped making sense. Their story is a real-world case study in what on-farm processing actually costs and what it returns. Build your business plan around five-year demand projections, not this year’s trending hashtag.
Over the next 12 months, watch the fluid milk data closely if you’re in a heavy Class I order. Fluid milk sales grew 0.8% in 2024 — the first gain since 2009. And that $3.14/cwt gap between Class I and Class II in 2025 means every gallon that shifts from manufactured products back to fluid beverages carries real blend-price weight.
If the Starbucks protein-milk play gains traction across café and quick-service channels, it could nudge Class I utilization rates up in ways that haven’t been on the table since the fluid decline accelerated. Track the USDA monthly data. And if your FMMO is under review or reform discussion, factor these demand shifts into your analysis of pooling changes.
Key Takeaways
- If your regional checkoff can’t show you ROI data from their influencer campaigns — not just impressions, but traceable sales lift — ask why. Midwest Dairy publishes theirs. DMI’s audited financials are available at dairycheckoff.com. The $15.60 return on e-commerce dollars is a starting benchmark—but demand to know how much of that $15.60 actually reaches milk checks.
- If cottage cheese is growing at 18–20% annually while Class II prices dropped $3.01/cwt from $21.34 (2024) to $18.33 (2025), the margin is being captured between the retail shelf and your bulk tank. Find out where.
- If protein premiums are up 29% year-over-year ($1.90/lb to $2.45/lb), verify whether that’s reaching your check — or whether it’s a commodity-driven move unrelated to the consumer trends the checkoff is funding. On a 300-cow herd, that gap represents roughly $484 per cow per year.
- If fluid milk’s 0.8% uptick holds, the $3.14/cwt Class I premium over Class II means demand shifting back to beverages (think Starbucks protein lattes) carries real blend-price upside — especially in heavy Class I orders. Watch the monthly USDA data.
- If you’re evaluating on-farm processing, cottage cheese and butter have the demand. But Clark Farms proved that demand alone doesn’t make the business case. Run real capital, labor, and regulatory numbers before committing.
The Bottom Line
Fourteen years of fluid milk decline. Then 2024 broke the streak — barely, at 0.8%, but it broke it. And somewhere in Campton Hills, Illinois, Andy and Sarah Lenkaitis are still milking their Holsteins with robots, still giving tours, still shipping milk to a DFA plant in Rockford that turns it into cottage cheese — the same product TikTok creators turned into a $1.75 billion category. Their checkoff dollars helped fund the influencer visit that brought a quarter-million eyeballs to their barn. Consumer demand for dairy, measured in retail dollars, has never been stronger.
What hasn’t been answered — and what no annual report, brand-lift study, or TikTok impression count can settle — is whether $12,319 a year from a 300-cow herd is money well spent if the demand it helps create flows to processors and retailers instead of the bulk tank. Your checkoff, your question. Pull up the numbers and decide.
Complete references and supporting documentation are available upon request by contacting the editorial team at editor@thebullvine.com.
Learn More
- From -43% to +0.8%: The Genetic Shift Powering Dairy’s First Fluid Milk Growth Since 2009 – Arms youwith a 30-day genetic strategy to capture composition premiums. It reveals how shifting from volume to high-protein NM$ targets ensures you’re producing the exact milk today’s premium-focused processors actually value.
- More Milk, Fewer Farms, $250K at Risk: The 2026 Numbers Every Dairy Needs to Run – Exposes the brutal “more milk, fewer farms” math hitting the 2026 horizon. This deep-dive delivers the structural roadmap needed to navigate a predicted $250,000 margin gap, helping you position your operation to survive the next five years.
- Same Milk, Different Payday: How Your Processor’s Product Mix Shapes Your Future – Breaks down the high-protein revolution disrupting the traditional commodity model. It exposes how processor-led moves into cottage cheese and specialty ingredients change your payday, providing the insight needed to leverage your milk’s value in a changing market.
 Join the Revolution!
 Join the Revolution!
Join over 30,000 successful dairy professionals who rely on Bullvine Weekly for their competitive edge. Delivered directly to your inbox each week, our exclusive industry insights help you make smarter decisions while saving precious hours every week. Never miss critical updates on milk production trends, breakthrough technologies, and profit-boosting strategies that top producers are already implementing. Subscribe now to transform your dairy operation’s efficiency and profitability—your future success is just one click away.


