


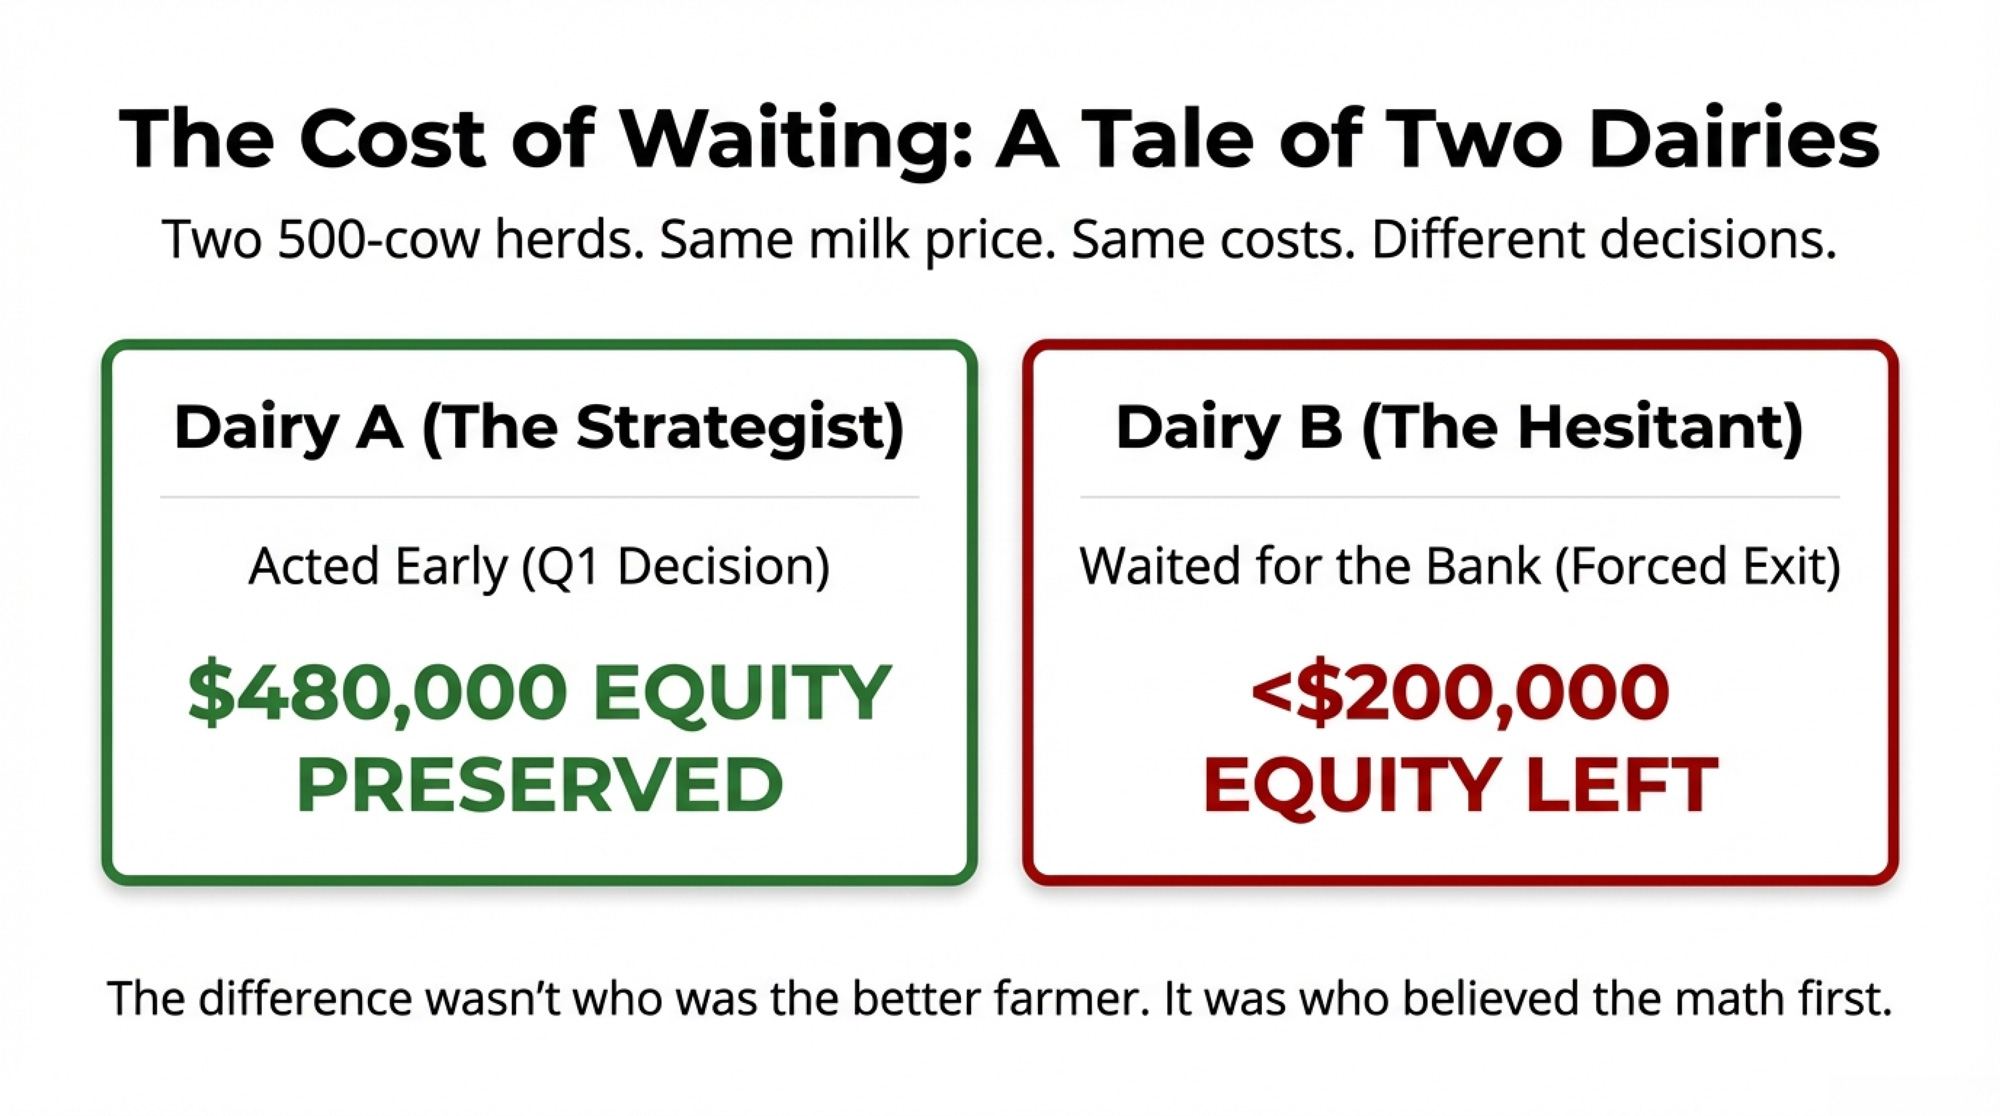
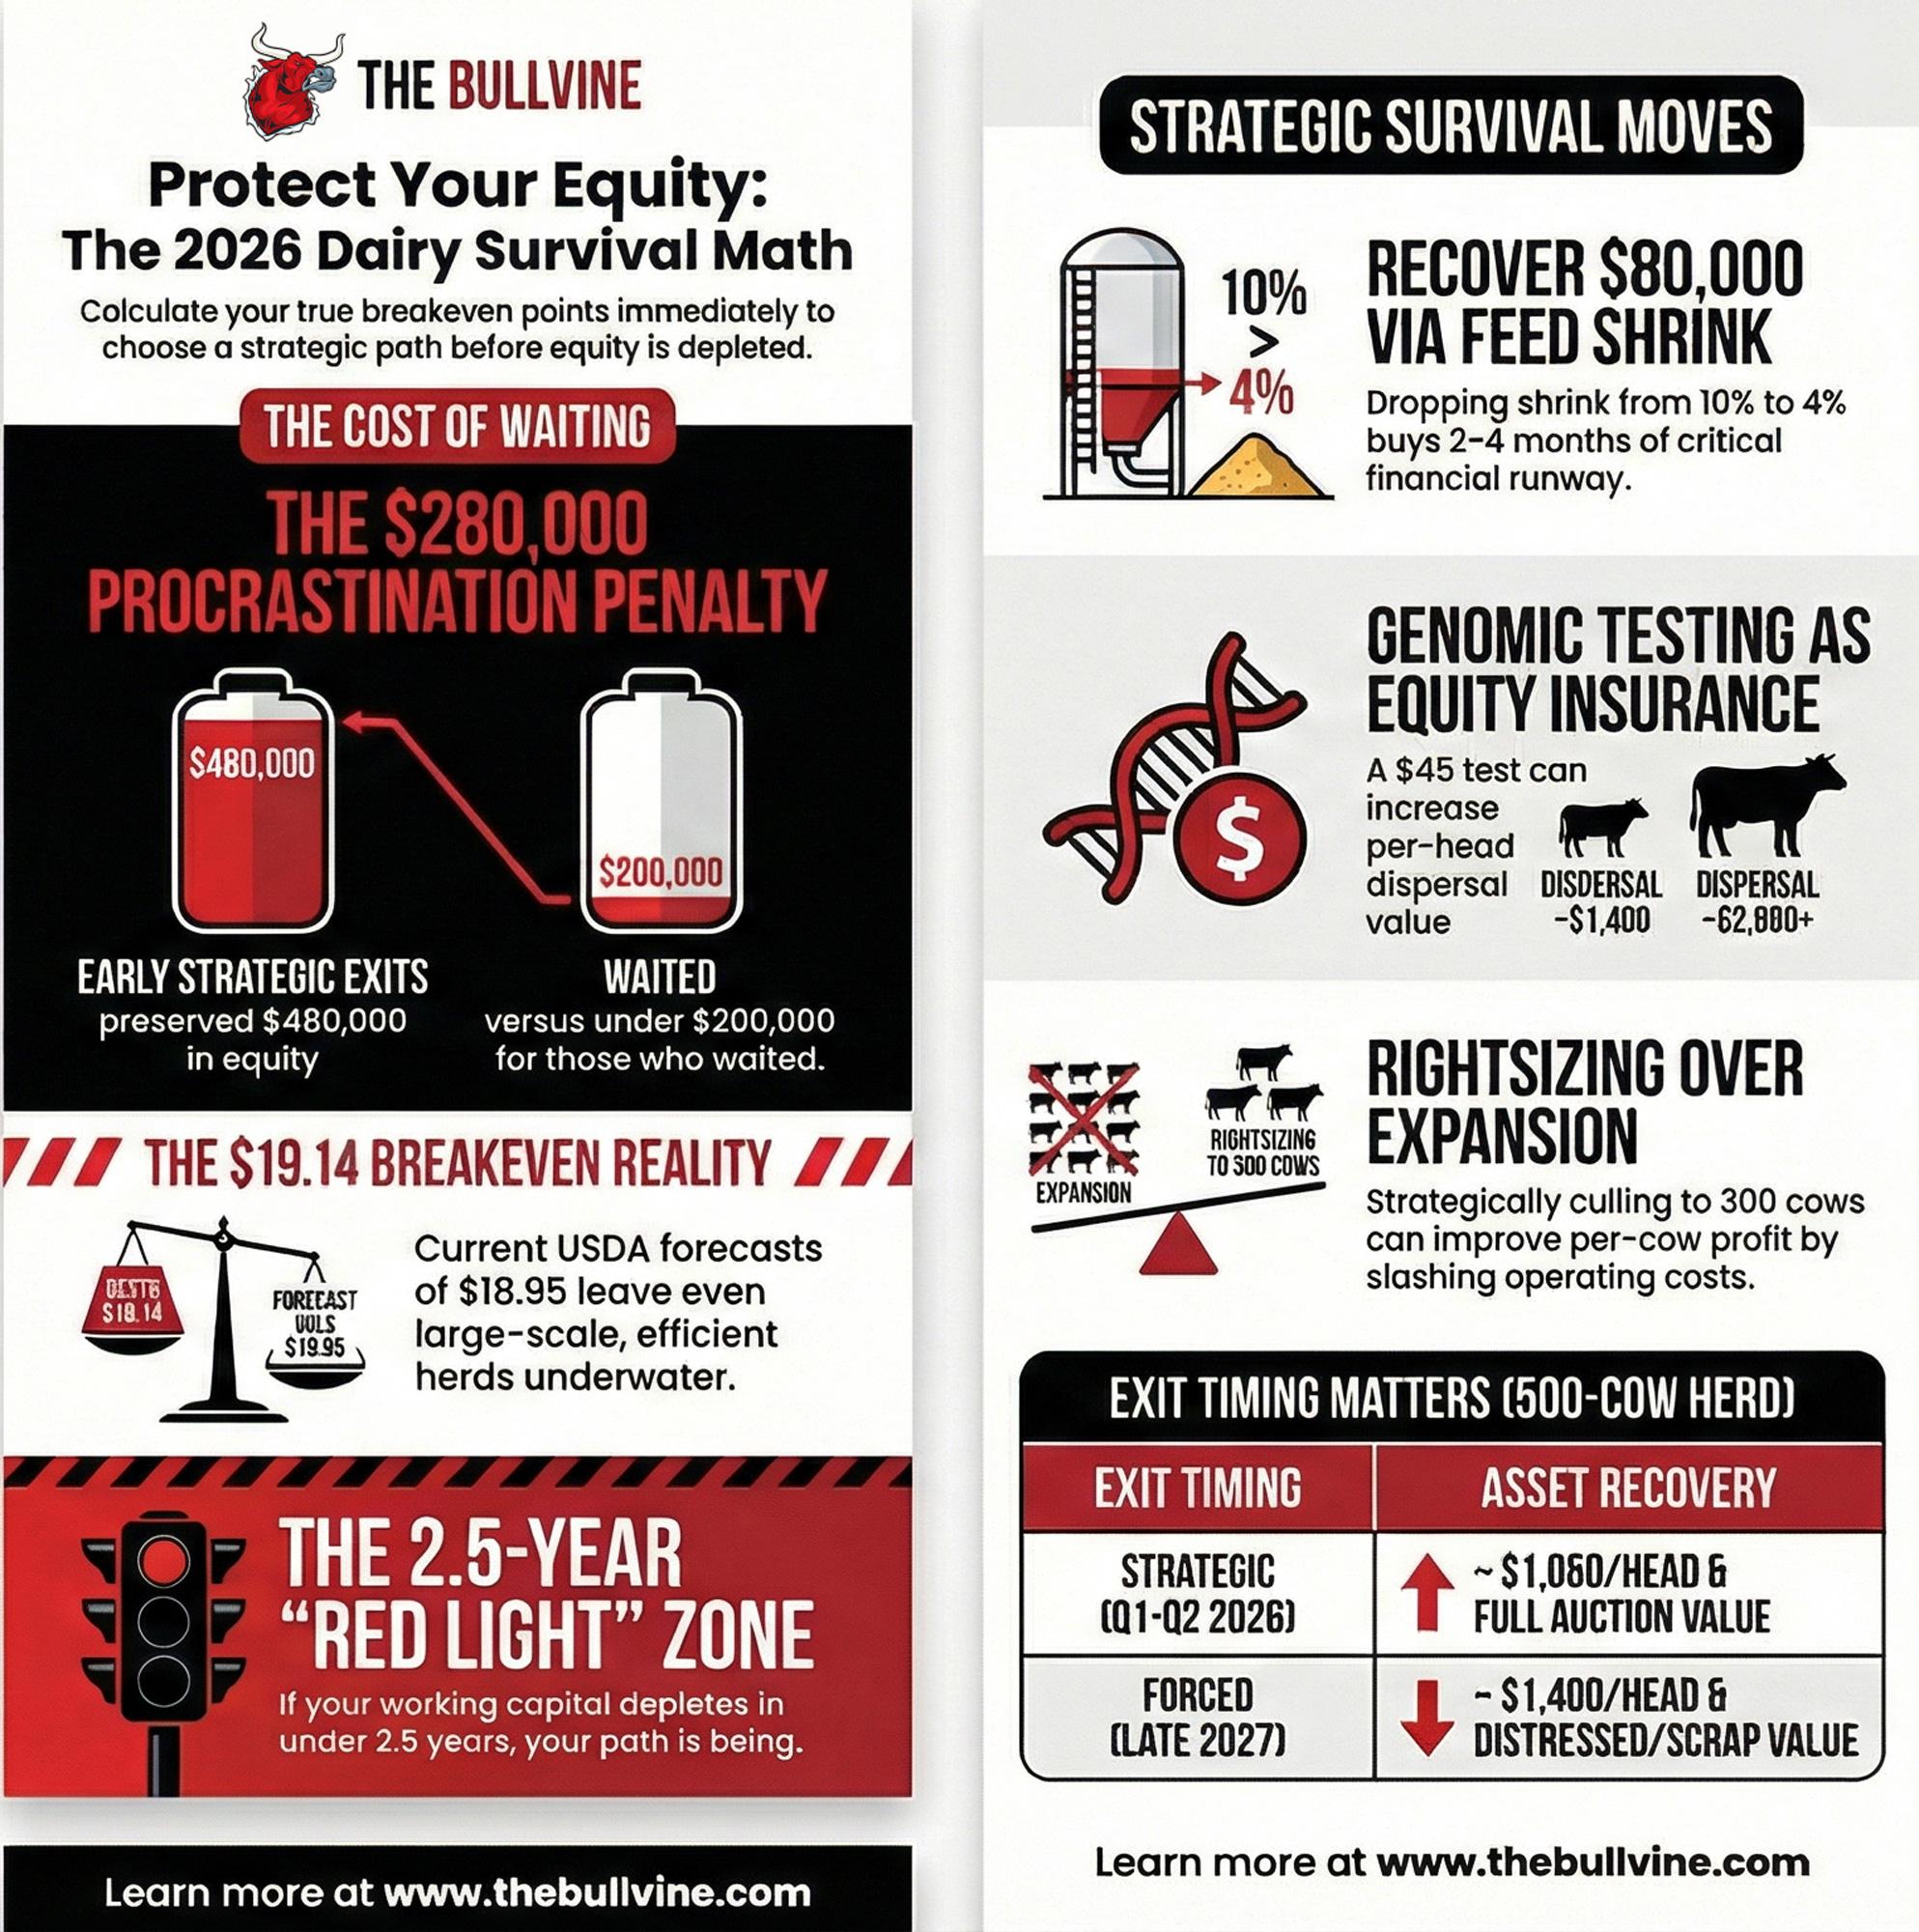
Same milk price. One 500-cow Wisconsin dairy kept $480,000 in equity; their neighbors walked away with under $200,000. The real difference was when they believed their breakeven point and acted on it.
Executive Summary: This feature breaks down the 2026 margin squeeze for 300–800 cow dairies, where January Class III at $14.59/cwt and USDA’s $18.95 all‑milk forecast run into ERS full economic costs of $19.14/cwt for large herds. For a 500‑cow operation at 23,000 lbs/cow, that means a $287,500 annual gap at $16.50 milk versus a $19 breakeven and only break-even at best if the forecast hits. One Wisconsin family believed in math early and preserved about $480,000 in equity through a planned exit, while neighbors on the same milk price ended up with under $200,000. The article shows how tightening feed shrink from 8–12% down toward 4% can recover $50,000–$80,000/year as a 90‑day bridge — enough runway to choose, not react. From there, it walks through four concrete paths for mid‑size herds (strategic exit, specialty pivot, downsizing with contract lock‑in, and internal heifer rebuild), with specific “when it fits/where it backfires” trade‑offs. A closing playbook gives 30/90/365‑day checks on burn rate, DMC coverage, contract timing, and heifer strategy so you can decide, with your own numbers, whether to fight through, right‑size, or sell while equity is still on the table.
A Wisconsin dairy family ran the same numbers every mid-size operator is running right now: March Class III futures closing at $16.42/cwt on February 26, while their all-in costs ran above $19. They made the call with 8–10 months of runway left. Preserved roughly $480,000 in family equity.
| Exit Scenario | Timing | Cow Value/Head | Equipment Recovery | Family Equity Preserved |
| Strategic Exit | Q1–Q2 2026 (8–10 months runway left) | $1,850 | Full auction value | $480,000 |
| Forced Liquidation | Late 2027 (lender-initiated) | $1,400 | Distressed/scrap pricing | Under $200,000 |
| Equity Destruction | 12–18 month delay | −$450/head | −40–60% | −$280,000 |
| Decision Driver | Proactive lender audit in March | Genomic testing ($45/head) before dispersal | Planned vs. distressed auction timing | Believing the math while assets hold value |
The family down the road, milking a similar herd, waited. By the time their lender initiated the conversation, the number was under $200,000.
That $280,000 gap isn’t about who’s a better farmer. It’s about who ran the real numbers first — and believed what they showed.
What Does $14.59 Class III Actually Mean for Your Herd?
January’s Class III came in at $14.59/cwt. December was $15.86. USDA’s February WASDE raised the 2026 all-milk forecast to $18.95/cwt — still $2.22 below the revised 2025 average of $21.17.
For a 300-cow herd shipping 69,000 cwt/year, that’s a $153,000 drop in gross milk revenue year over year.
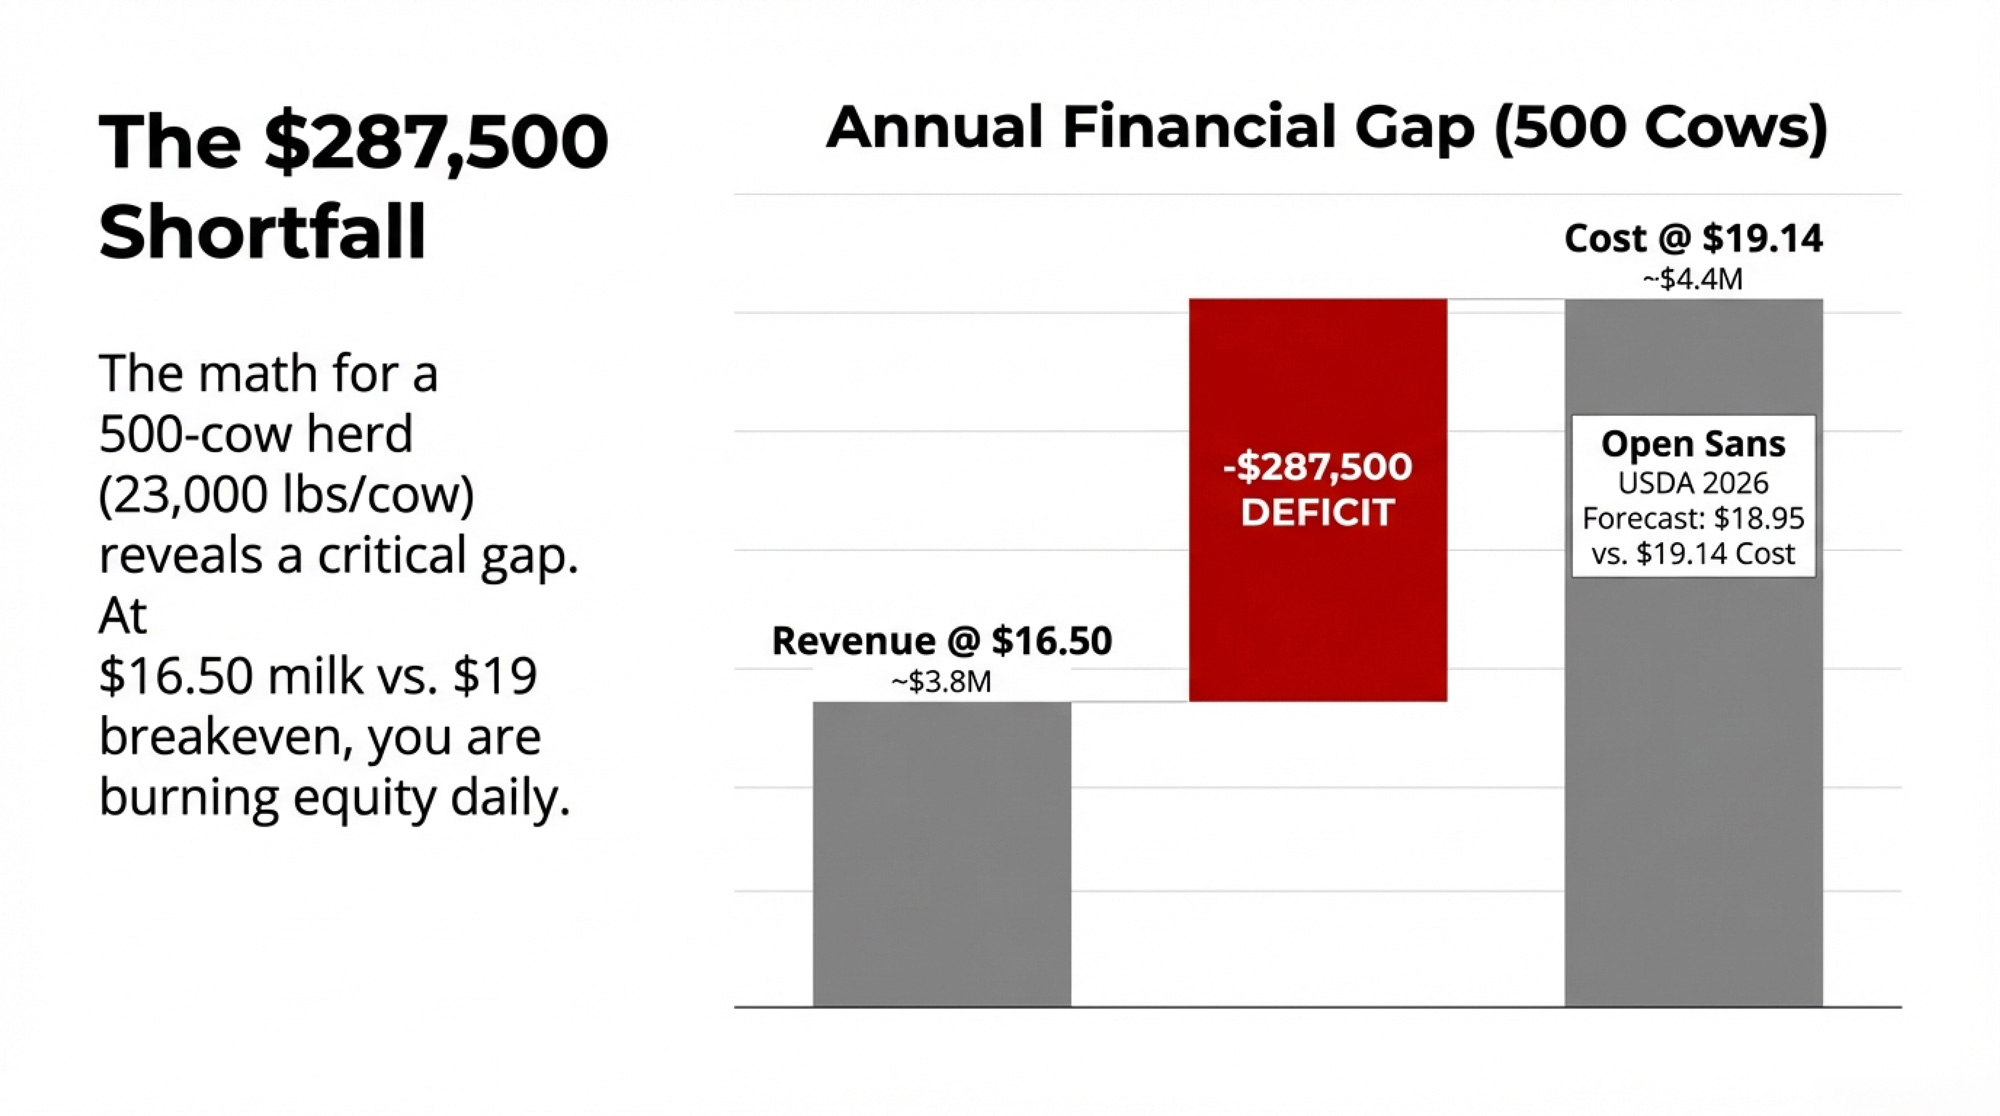
Here’s the walk-through for a 500-cow operation producing 23,000 lbs/cow — that’s 115,000 cwt/year:
- At $16.50 milk vs. $19 breakeven: $2.50/cwt × 115,000 cwt = $287,500 annual shortfall
- At $16.50 milk vs. $21 breakeven: $4.50/cwt × 115,000 cwt = $517,500 annual shortfall
- At $18.95 (USDA forecast) vs. $19 breakeven: Still underwater by $5,750/year — and that’s the optimistic case
Where does your breakeven point sit? Plug it in: (your all-in cost/cwt − milk price/cwt) × annual cwt shipped = your annual shortfall.
Lucas Sjostrom, executive director of Minnesota Milk, framed the oversupply problem driving these prices in a January 2026 interview with the Red River Farm Network: “Although milk is milk, it’s the components that we sell, and we’ve got all sorts of components on the market.” Milk-fat tests averaged 4.32% in 2025, up from 4.24% in 2024, while skim-solids hit 9.12%. More components per pound of milk means more product per pound of milk — and right now the market has more than it can absorb.
One critical distinction: USDA’s ERS puts the full economic cost for the largest operations (2,000+ cows) at $19.14/cwt. That figure includes imputed family labor at market wages and opportunity cost on owned land. Your cash-cost breakeven is typically $3–6/cwt lower, but the ERS number captures the real drain on family wealth, which is what matters when you’re asking whether to stay or go.
The Assumption That’s Breaking Down
For 40 years, “get big or get out” has been dairy’s operating principle. Scale solves margin problems. That was the thesis.
But when ERS data shows the most scaled herds in the country starting 2026 at $19.14/cwt against $18.95 milk, scale alone clearly isn’t solving it.
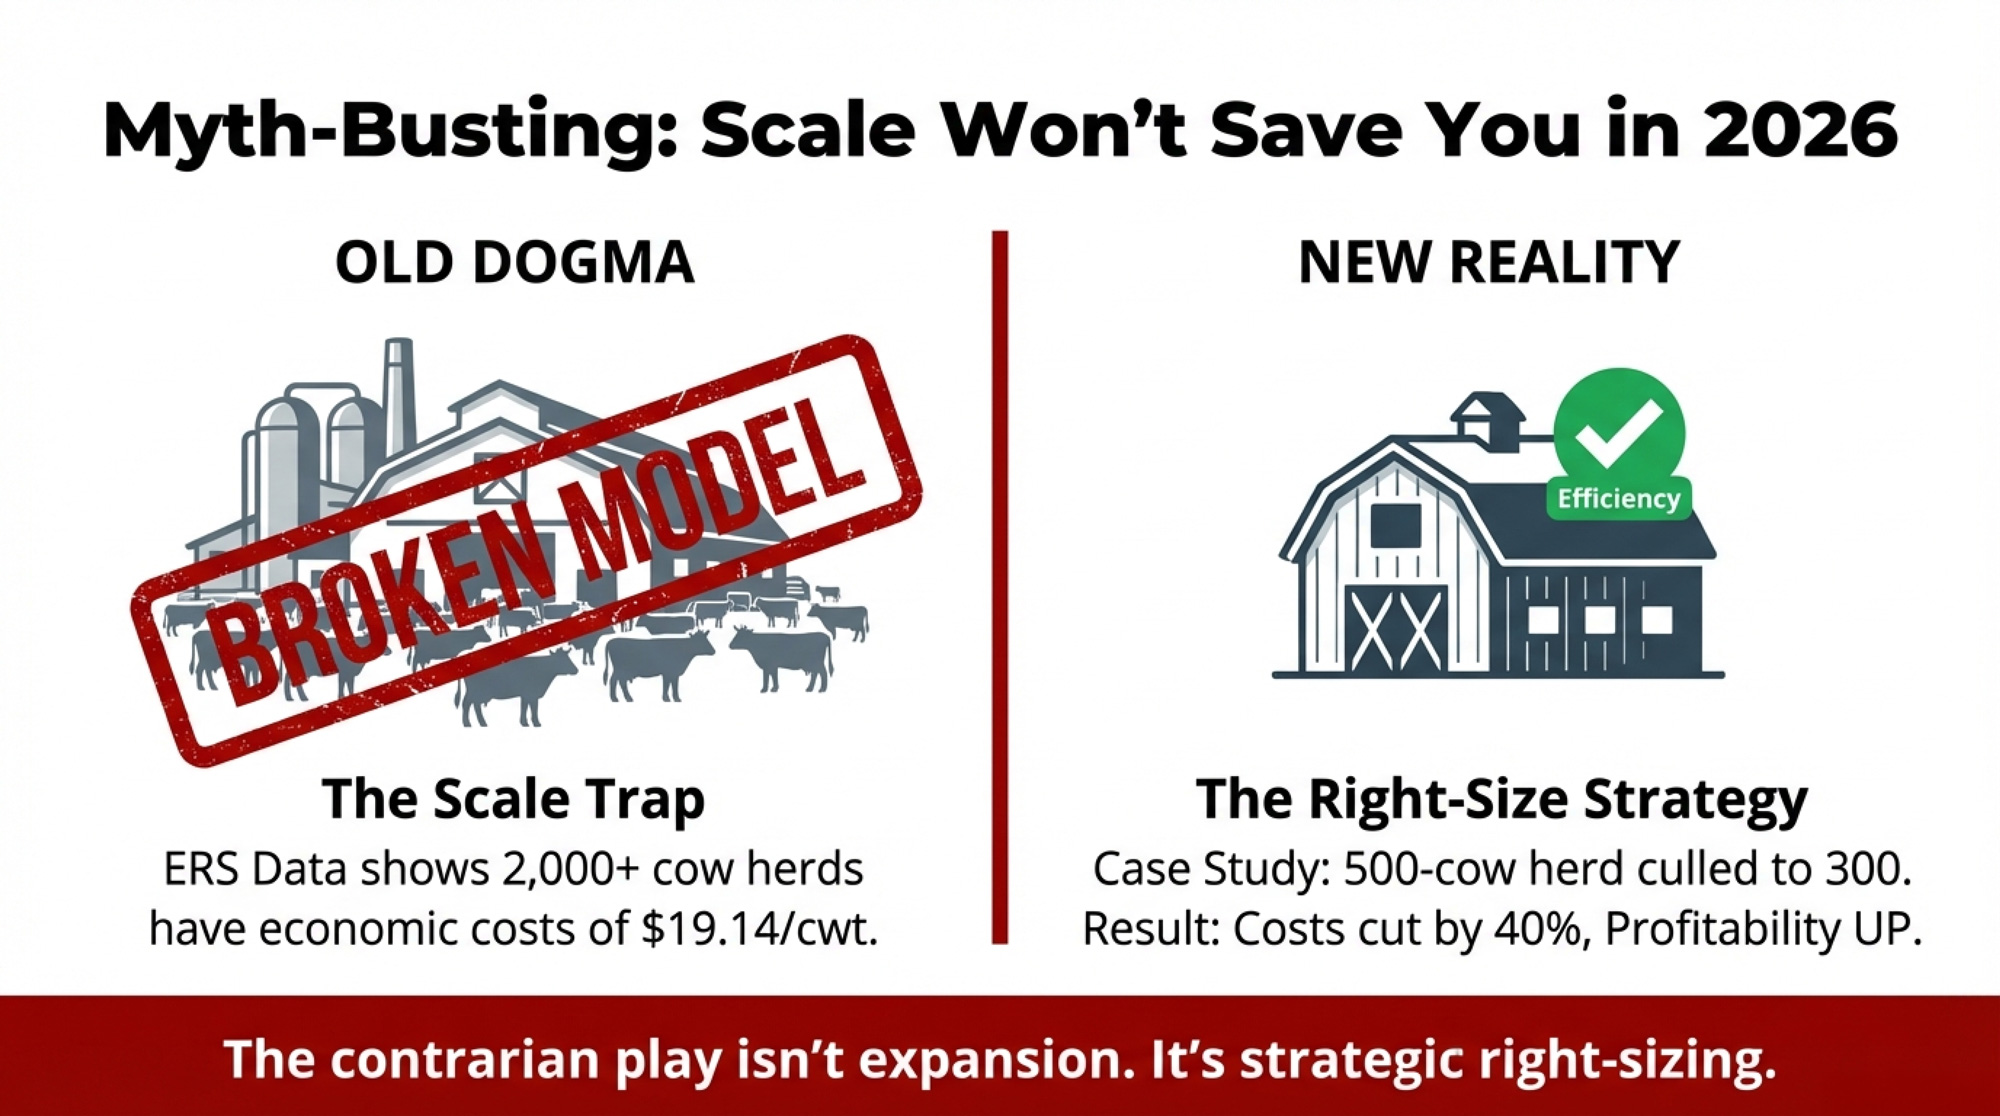
And some operations read that data and do the opposite of what conventional wisdom prescribes. A 500-cow herd strategically culled to 300 cows, captured strong cull revenue at historically high beef prices, slashed operating costs by 40%, and improved per-cow profitability by tightening management and focusing on its best genetics.
The ERS data also explains why the herd keeps expanding even as margins compress. In 2025, dairy farmers culled fewer cows and expanded the productive herd as new processing capacity came online — 2.81 million fresh cow additions against 2.64 million slaughtered. December’s dairy cow inventory hit 9.567 million head, up 212,000 from a year earlier.
More cows, more components per cow, more total milk — hitting a market already drowning in solids. The contrarian play in 2026 isn’t expansion. It’s strategic right-sizing paired with contract lock-in and cost discipline.
The $584/Cow Bridge to Q4
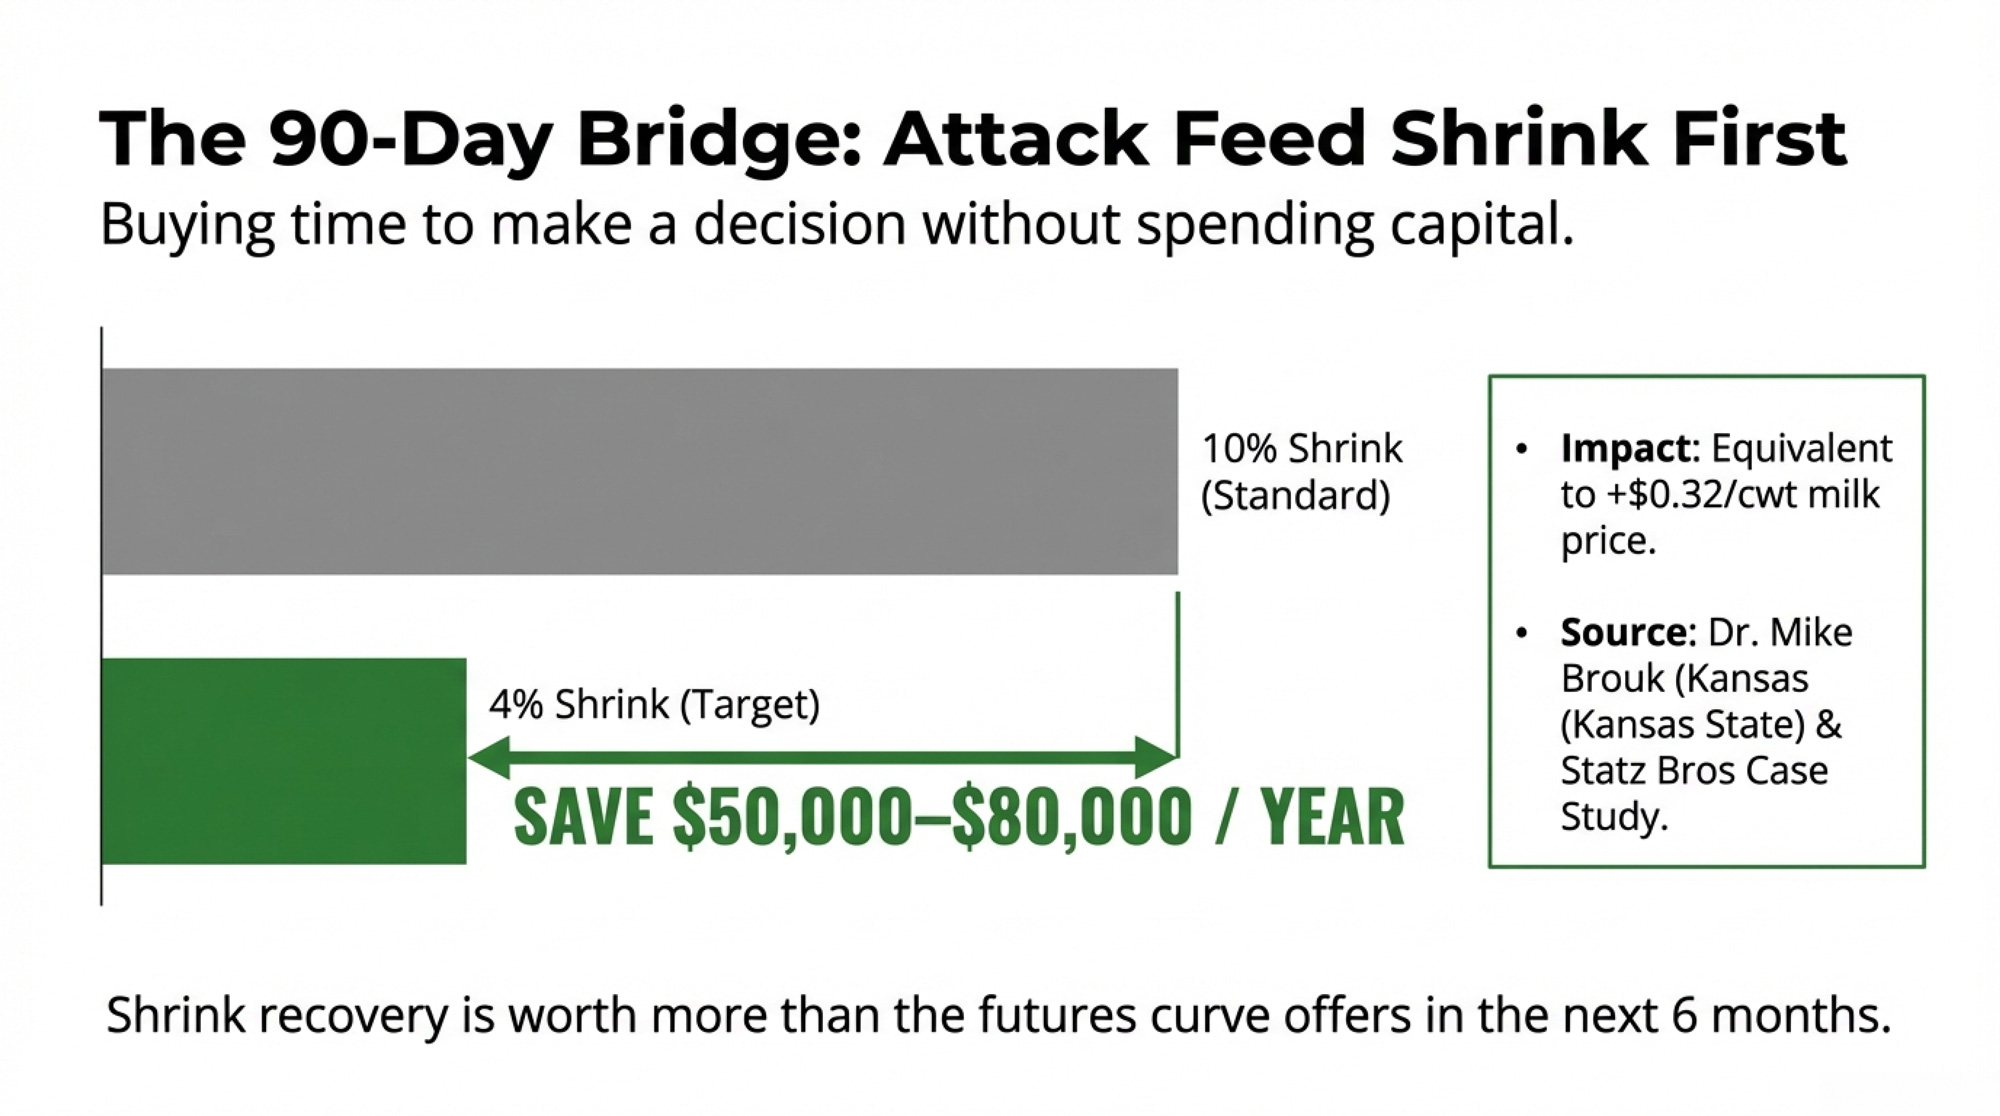
Before choosing a path — exit, downsize, pivot, or rebuild — you need time to consider it. And the fastest way to buy time without touching herd size, production, or capital is attacking feed shrink.
Dr. Mike Brouk at Kansas State laid it out at the Vita Plus Dairy Summit, and the math still holds: a 500-cow dairy running $7.50/cow/day in feed costs can capture $50,000 or more per year by reducing shrink just 4 percentage points. “Or we can reduce our feed shrink to gain $50,000,” Brouk said. “Comparatively speaking, capturing $50,000 from milk price alone for a 500-cow herd would require an additional 32 cents per cwt for the year.”
That 32-cents-per-cwt equivalent is the number that should stop you. It means shrink recovery at current margins is worth more than most of us will get from the futures curve over the next 6 months.
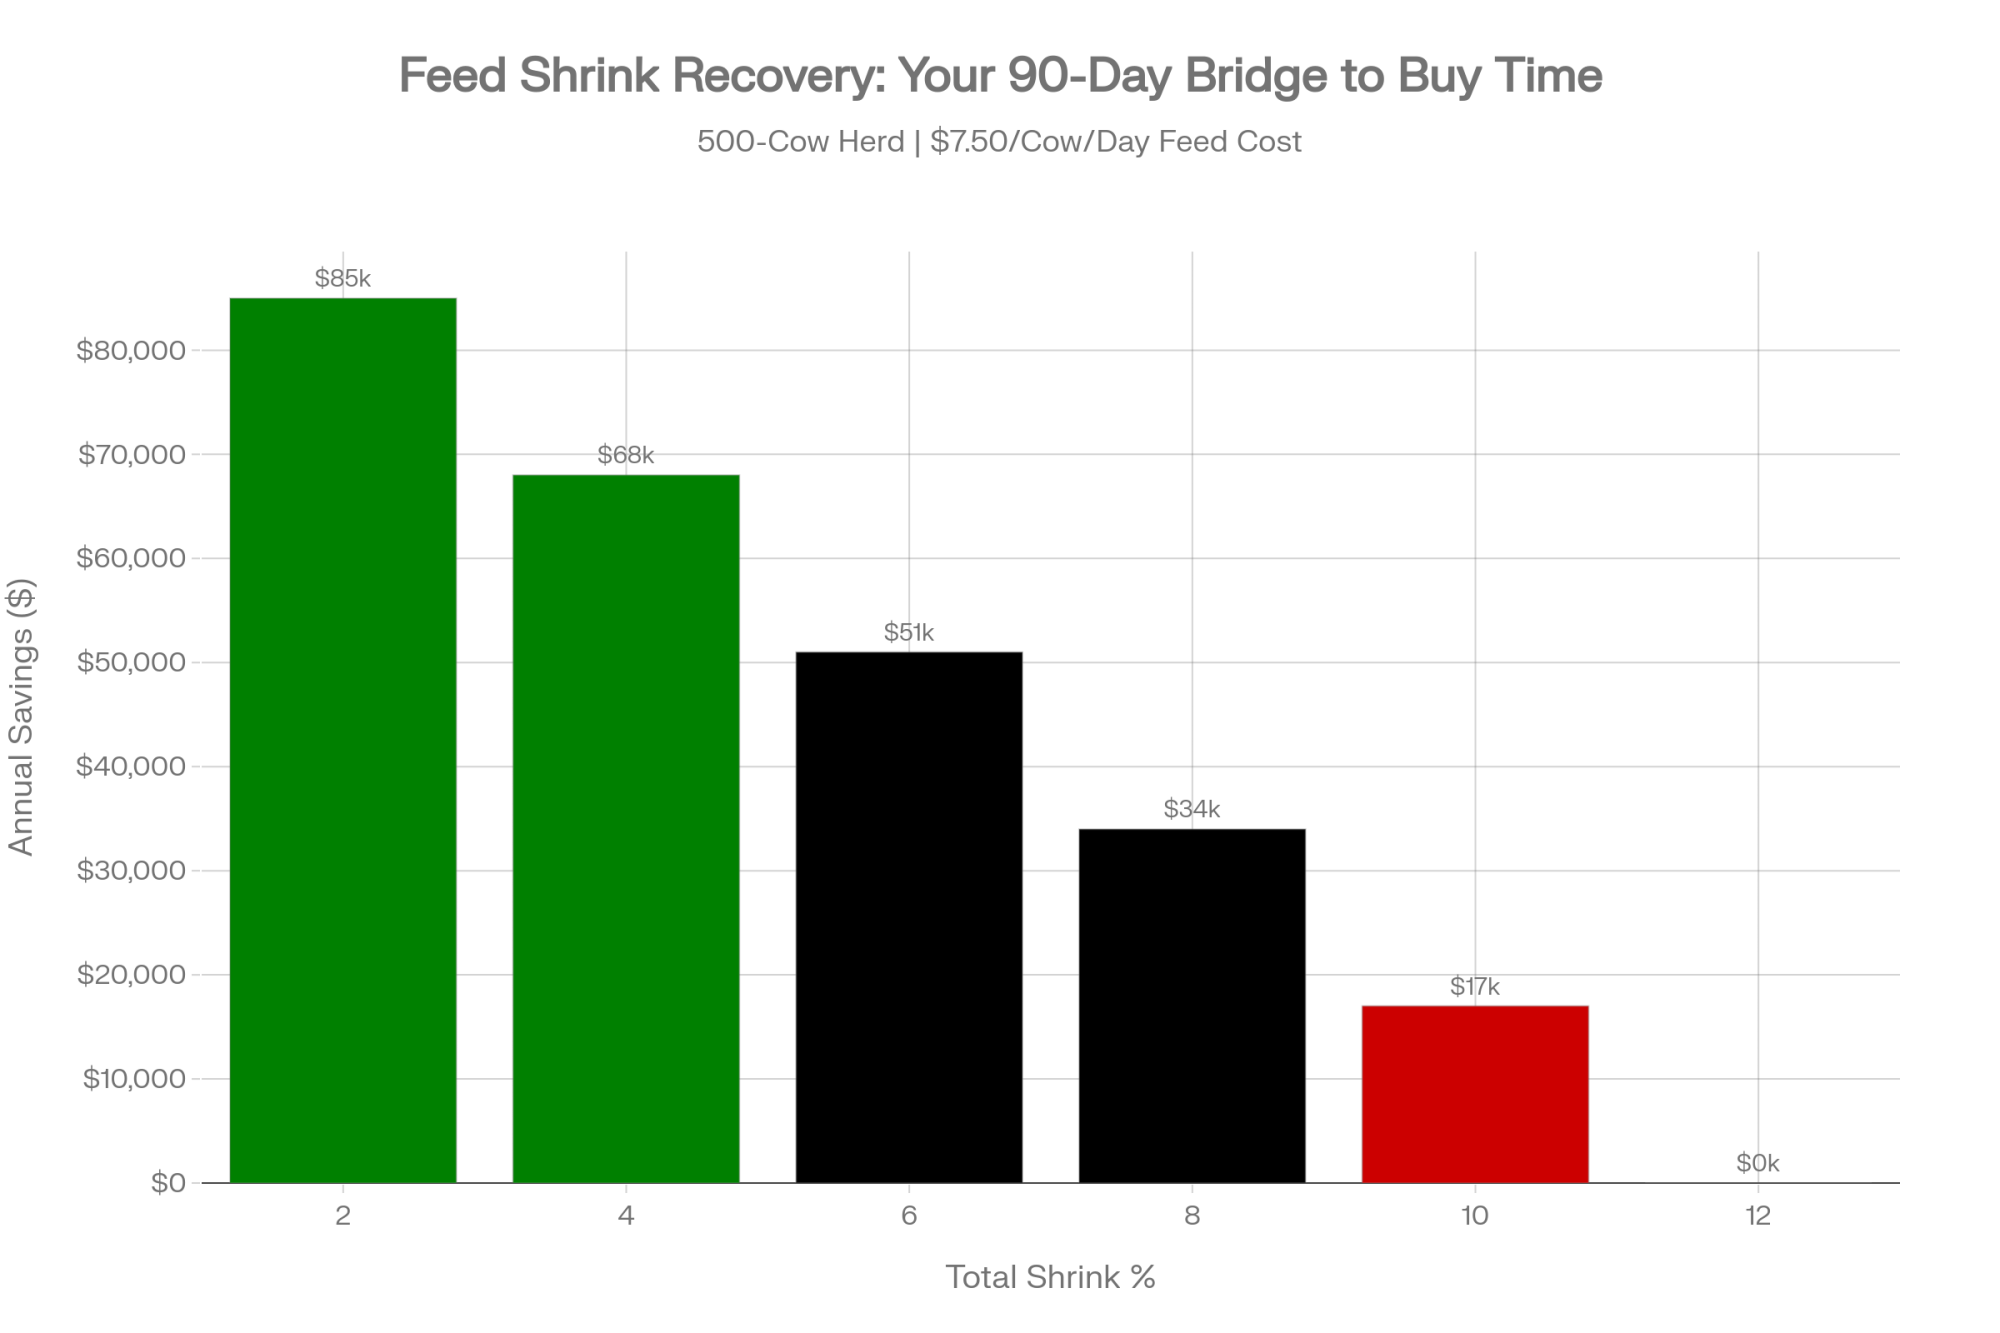
University of Minnesota Extension’s Jim Salfer documented even larger returns: a 100-cow dairy saves $58,400 annually when moving from high to low shrink—that’s $584/cow. Scale that to 500 cows, and you’re looking at $50,000–$80,000 in recoverable margin, depending on ration cost and starting shrink level.
Most operations run 8–12% total ration shrink. Well-managed herds hit 4% or less. Penn State’s Dr. Lisa Holden describes how the gap opens: procedural drift “creeps in like a fog and bad habits really take root like weeds.” On a 1,000-cow dairy running $8/cow/day ration cost, 8% shrink costs $233,600 annually — cutting it to 4% recovers half of that.
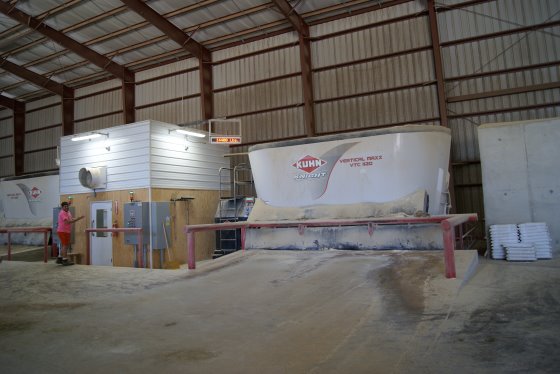
Joe Statz and his brothers showed what’s possible at scale. Their 4,400-cow operation near Marshall, Wisconsin, built a dedicated feed center — a 60,000-square-foot commodity barn with drive-through bays and a centralized mixing system — and dropped shrink from 10% to 2–3%, according to a 2018 Dairy Global report. The documented savings: over $500,000 per year in recovered feed value. Their nutritionist, Todd Follendorf from Cornerstone Dairy Nutrition in Waunakee, put it this way: “Shrink control has been the main reason why we built the whole facility.”
You don’t need Statz-level infrastructure. As The Bullvine reported in November, five targeted improvements — face management, scale calibration, ingredient tracking, right-sized bunkers, and refusal optimization — can recover $100,000+ annually on a large operation for an investment under $20,000.
Here’s why this matters for the survival math: $50,000–$80,000/year in recovered margin is the funding mechanism for whichever path you choose. It doesn’t fix a $287,500 shortfall. But it buys 2–4 months of additional runway — and in a year where the difference between strategic and forced exit is $280,000 in family equity, that extra runway is worth more than anything else you can do in the next 30 days without writing a check.
If you don’t have weighed shrink data from the past 90 days, that’s action item number one this week.
How Bad Is the Survival Math?
David Kohl, professor emeritus of agricultural economics at Virginia Tech, has been warning about the pressure this cycle is putting on lenders. Speaking at the Professional Dairy Producers of Wisconsin annual business conference: “Lenders will be under tremendous scrutiny from regulators this year.”
That scrutiny flows downhill. If your debt-service coverage ratio drops below 1.0, it can trigger technical default — even when payments are current.
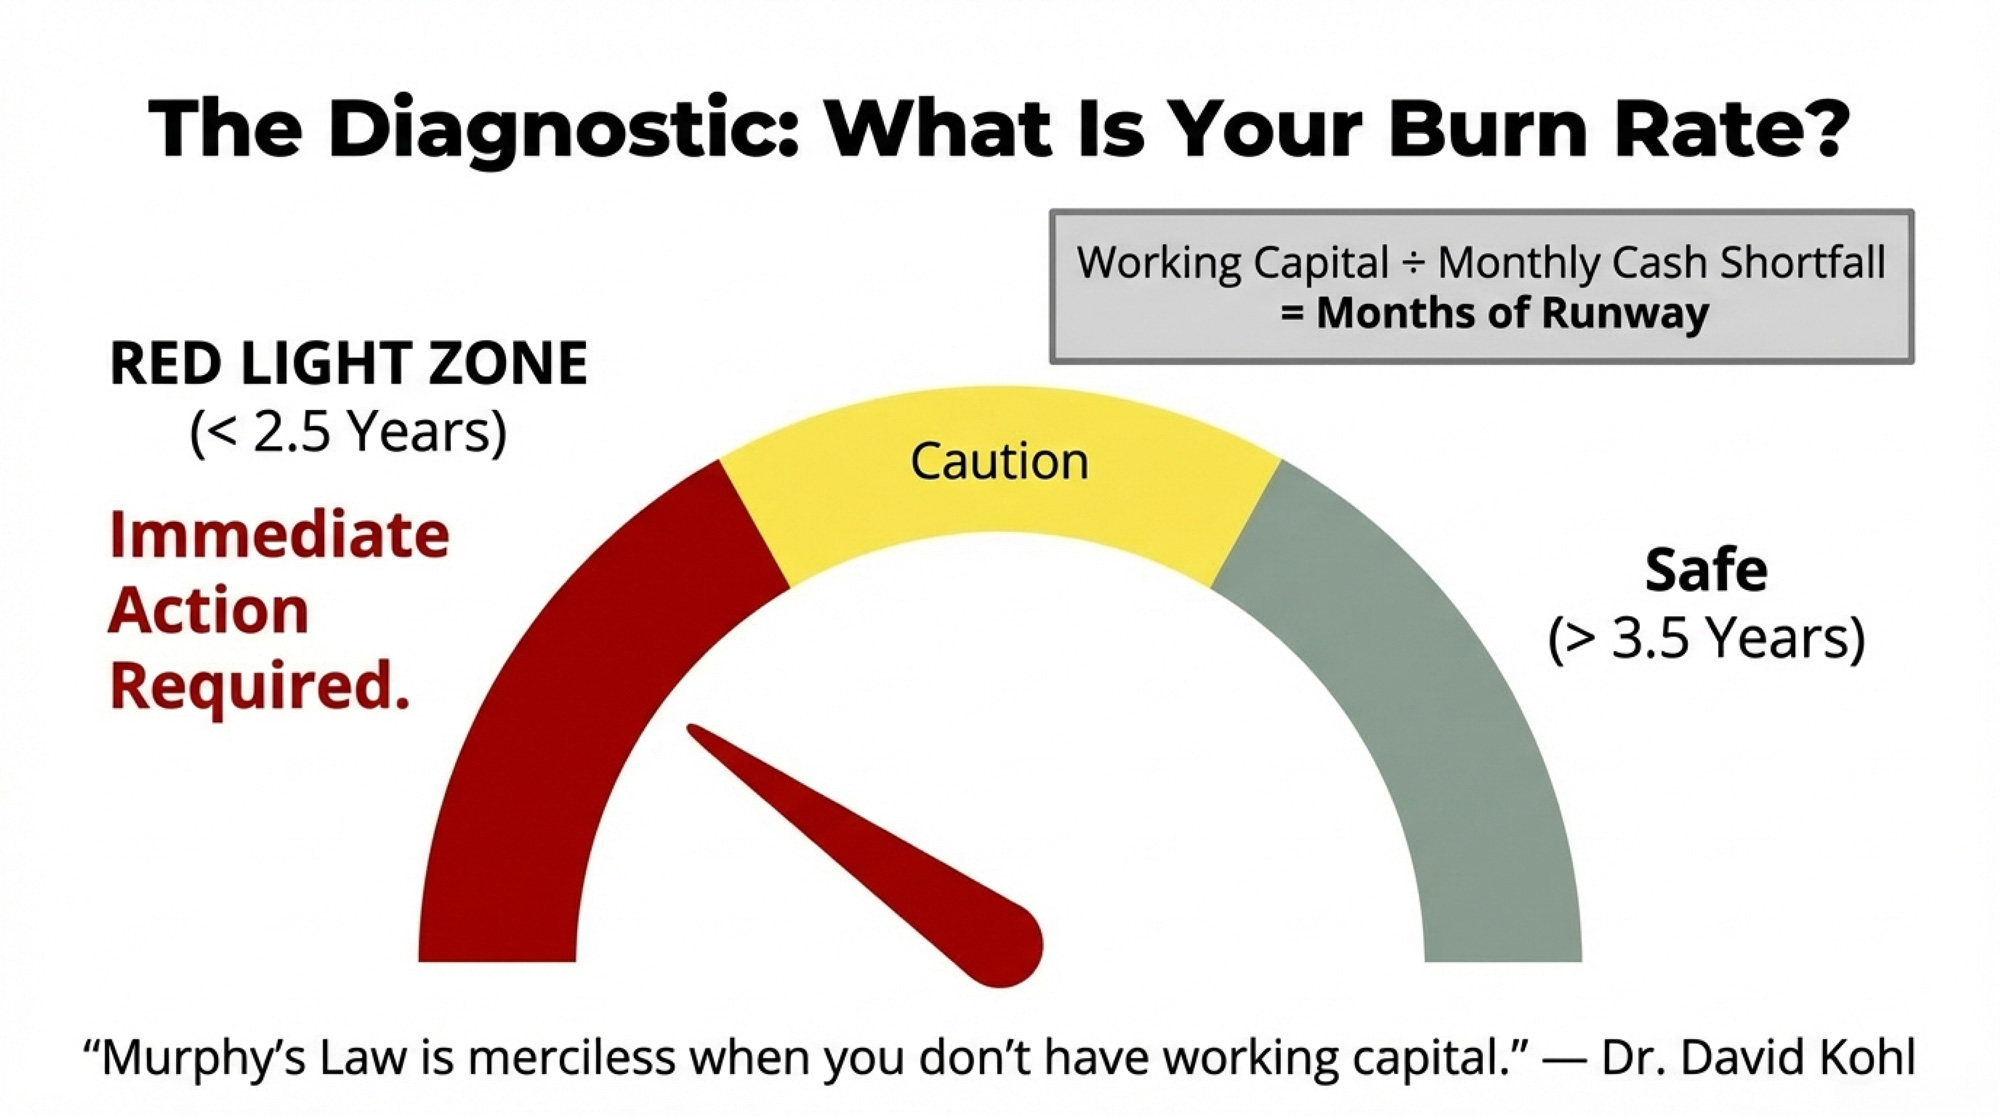
Kohl’s metric for self-assessment: calculate your burn rate — how quickly working capital depletes. “You’d like to have a burn rate of 3½ years or more,” he says. “Determining your burn rate gives you some boundaries as to when you have to make some tough decisions. Murphy’s Law is merciless when you don’t have working capital.”
Below 2½ years? That’s what Kohl calls the red-light zone.
Here’s what exit timing looks like for a representative 500-cow operation carrying $2.5–3M in total assets against $1–1.5M in debt:
| Exit Timing | Cow Value | Equipment Recovery | Key Action Requirement |
| Strategic (Q1–Q2 2026) | ~$1,850/head | Full auction value | Proactive lender audit by March |
| Forced (Late 2027) | ~$1,400/head | Distressed/scrap | Waiting for a call from the bank |
These are illustrative scenarios for editorial purposes only. Actual values depend on herd genetics, health status, registration, market timing, and regional demand. Assumes Upper Midwest region, mixed owned/rented land, mid-life equipment. Consult your lender, accountant, or ag attorney for operation-specific analysis.
That $1,850/head figure depends heavily on what you’re selling. USDA’s October 2025 Agricultural Prices report showed the price received for milk cows hit a record $3,110 per head nationally. At Premier Livestock & Auctions in Pennsylvania, top-quality springing heifers fetched $2,850–$4,050 at the February 18 sale, with top-quality fresh cows bringing $3,000–$3,800. At their January 27 special heifer auction, open heifers in the 700–850 lb range hit $1,550–$3,000 per head.
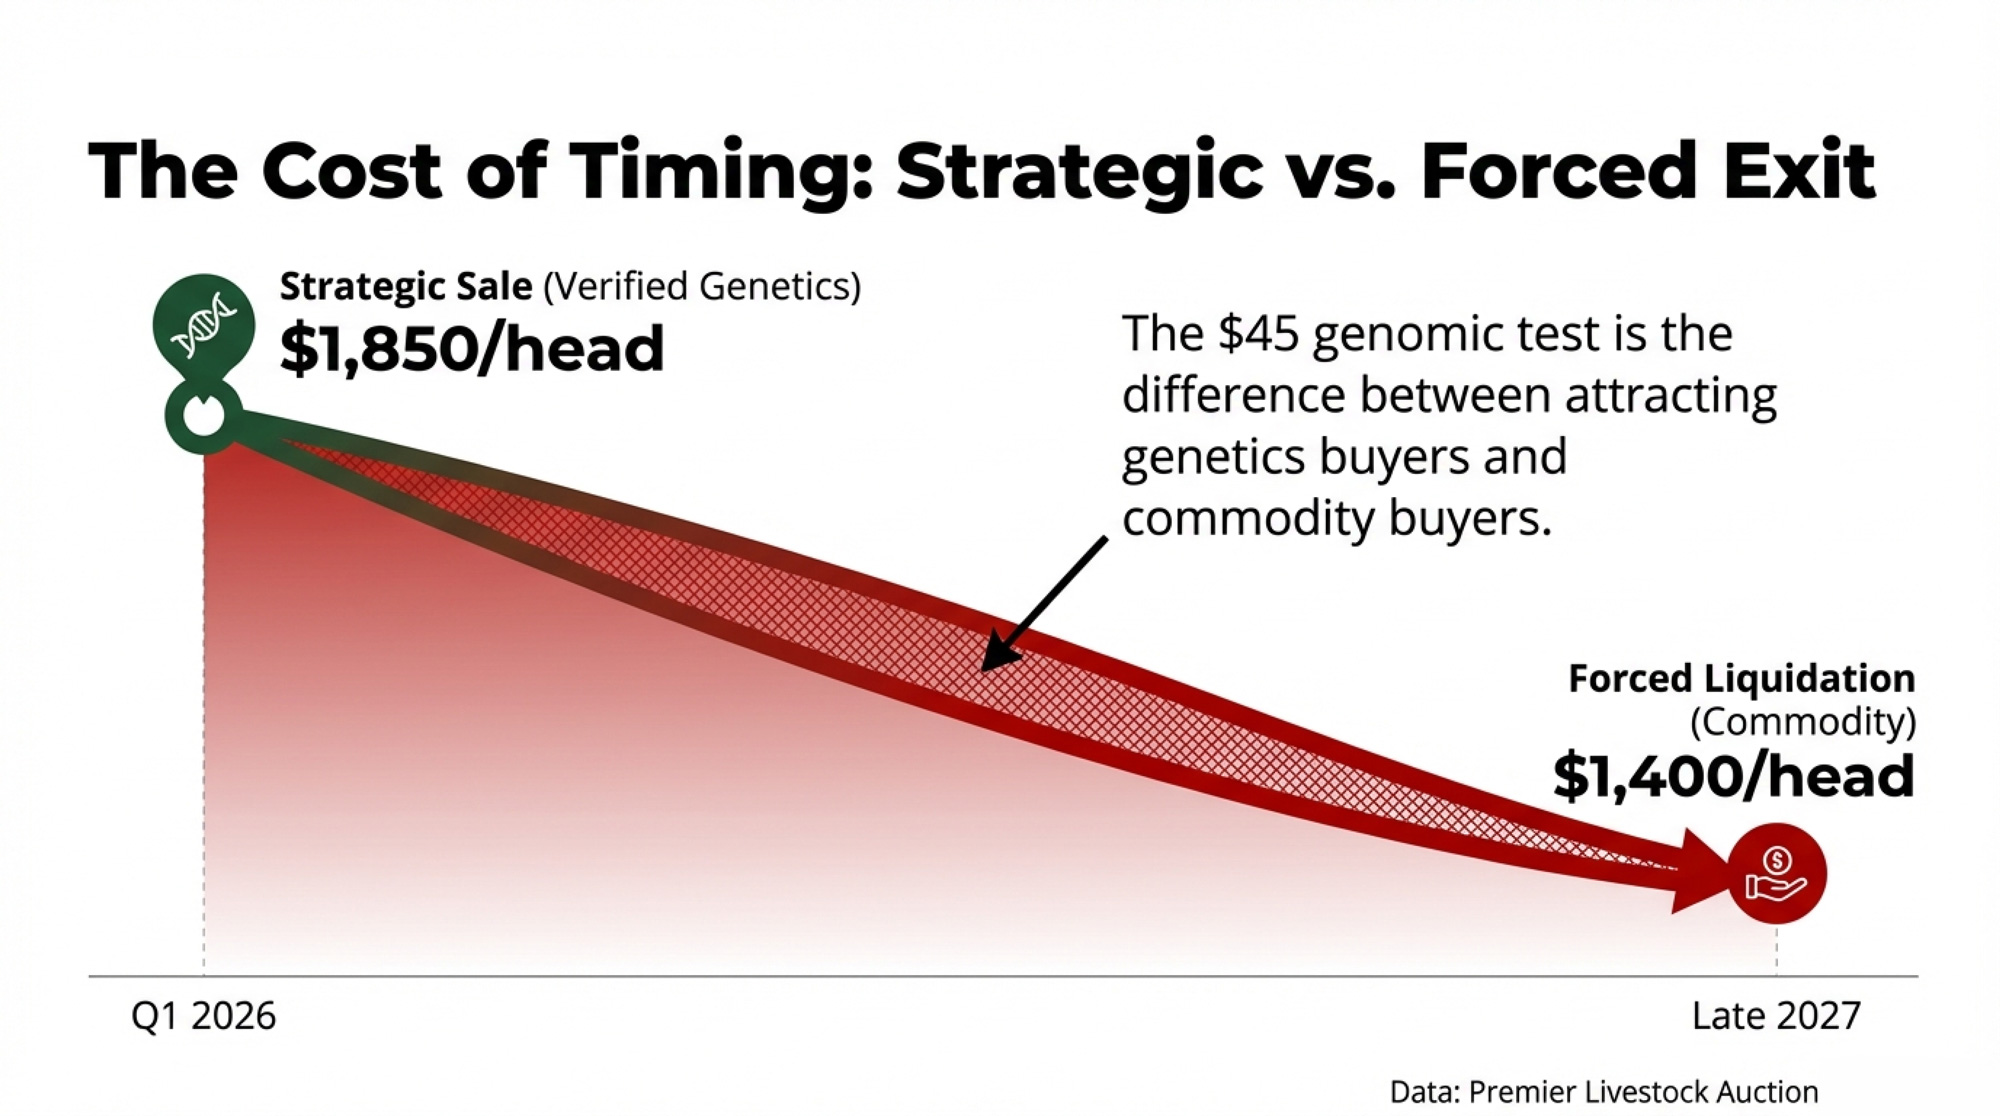
But those prices went to cattle with verified quality. Commodity Holsteins with no papers and no genomic data sell at commodity prices. Genomic testing runs roughly $45 per calf and generates about $34 in additional profit per cow per year through better culling and selection decisions. In an exit scenario, that $45 test becomes the difference between your dispersal attracting genetics buyers at $2,850+ per head versus commodity buyers bidding $1,400.
Four Paths — and What Each One Costs
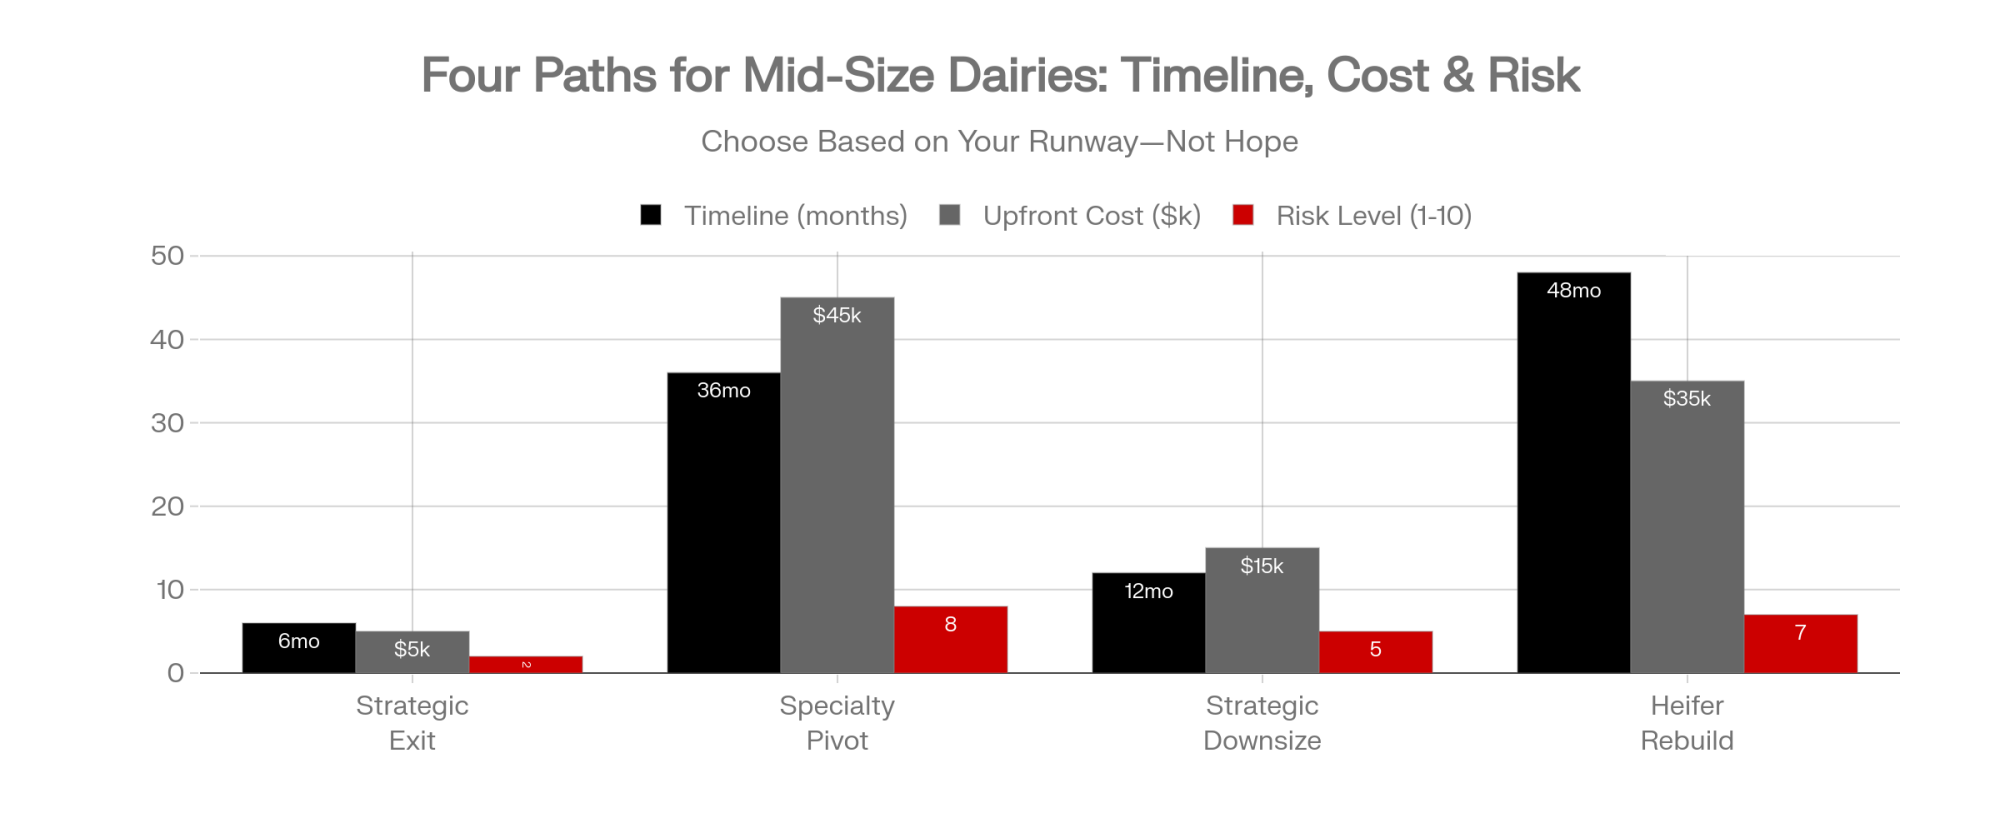
Path 1: Strategic Exit While Asset Values Hold
- When it fits: DSCR trending below 1.0, burn rate under 2½ years, debt-to-asset above 50%, no succession plan
- What it requires: Decision by Q2 2026, proactive lender conversation, 6–12 months for proper real estate and cattle marketing, and genomic testing of the herd before the dispersal
- Where it backfires: Waiting until forced sale can destroy $200,000+ in recoverable equity — and that spread widens when auction markets get crowded
- Tax angle: Chapter 12 bankruptcy provisions can allow qualifying family farm operations to restructure certain capital gains tax obligations as unsecured debt — consult an ag attorney for specifics
The Wisconsin family we opened with? They chose this path — and started genomic testing the same week they called their lender.
Path 2: Pivot to Specialty/Premium Markets
- When it fits: Strong component genetics, willingness to reduce herd size, regional processor relationships
- What it requires: Organic certification (3-year transition), A2 genetic testing (~$40/cow), identity-preserved handling
- Where it backfires: Premium markets have capacity limits — not everyone can pivot simultaneously.
Path 3: Strategic Downsizing with Contract Lock-In
One Northeast producer interviewed by The Bullvine reduced herd size by roughly 20% in late 2025 and saw per-cow profitability improve as labor costs dropped faster than revenue. Tighter management of fewer, better animals made the difference.
- When it fits: Labor costs consuming disproportionate margin, cull values historically elevated, processor relationships strong
- What it requires: Multi-year component premium contracts negotiated before mid-2026
- Where it backfires: If processor contracts don’t materialize, you’ve shrunk without securing the premium position.
- Why the window exists: Billions in new processing capacity needs committed milk, but replacement heifer inventories dropped to just 3.905 million head as of January 1, 2026 — that’s 40.8% of productive cows, down from 41.7% a year earlier. CoBank projects this won’t rebound before 2027. That mismatch gives producers unusual contract leverage — for now.
Path 4: Internal Heifer Rebuild
- When it fits: Currently heavy on beef-on-dairy, strong genetic base, 3–5 year time horizon
- What it requires: Cutting beef-on-dairy to the bottom 10–15% of the herd, sexed dairy semen on top genetics, accepting 3–4 years of reduced beef-calf revenue
- The replacement math: Internal rearing costs sit around $2,034/head for Pennsylvania farms and $1,709/headin the Midwest, per Penn State Extension data updated December 2025 (range: $1,411–$2,301). Compare that to $2,850–$4,050 for purchased springers at Premier Livestock’s sale on February 18. The per-head advantage is significant — but raising your own takes 24–26 months to show up in the milking string. The Bullvine’s February analysis of the national heifer paradox — 9.57 million cows, just 3.91 million replacements — shows why the external market isn’t getting easier anytime soon.
Signals That Tell You Which Way This Goes
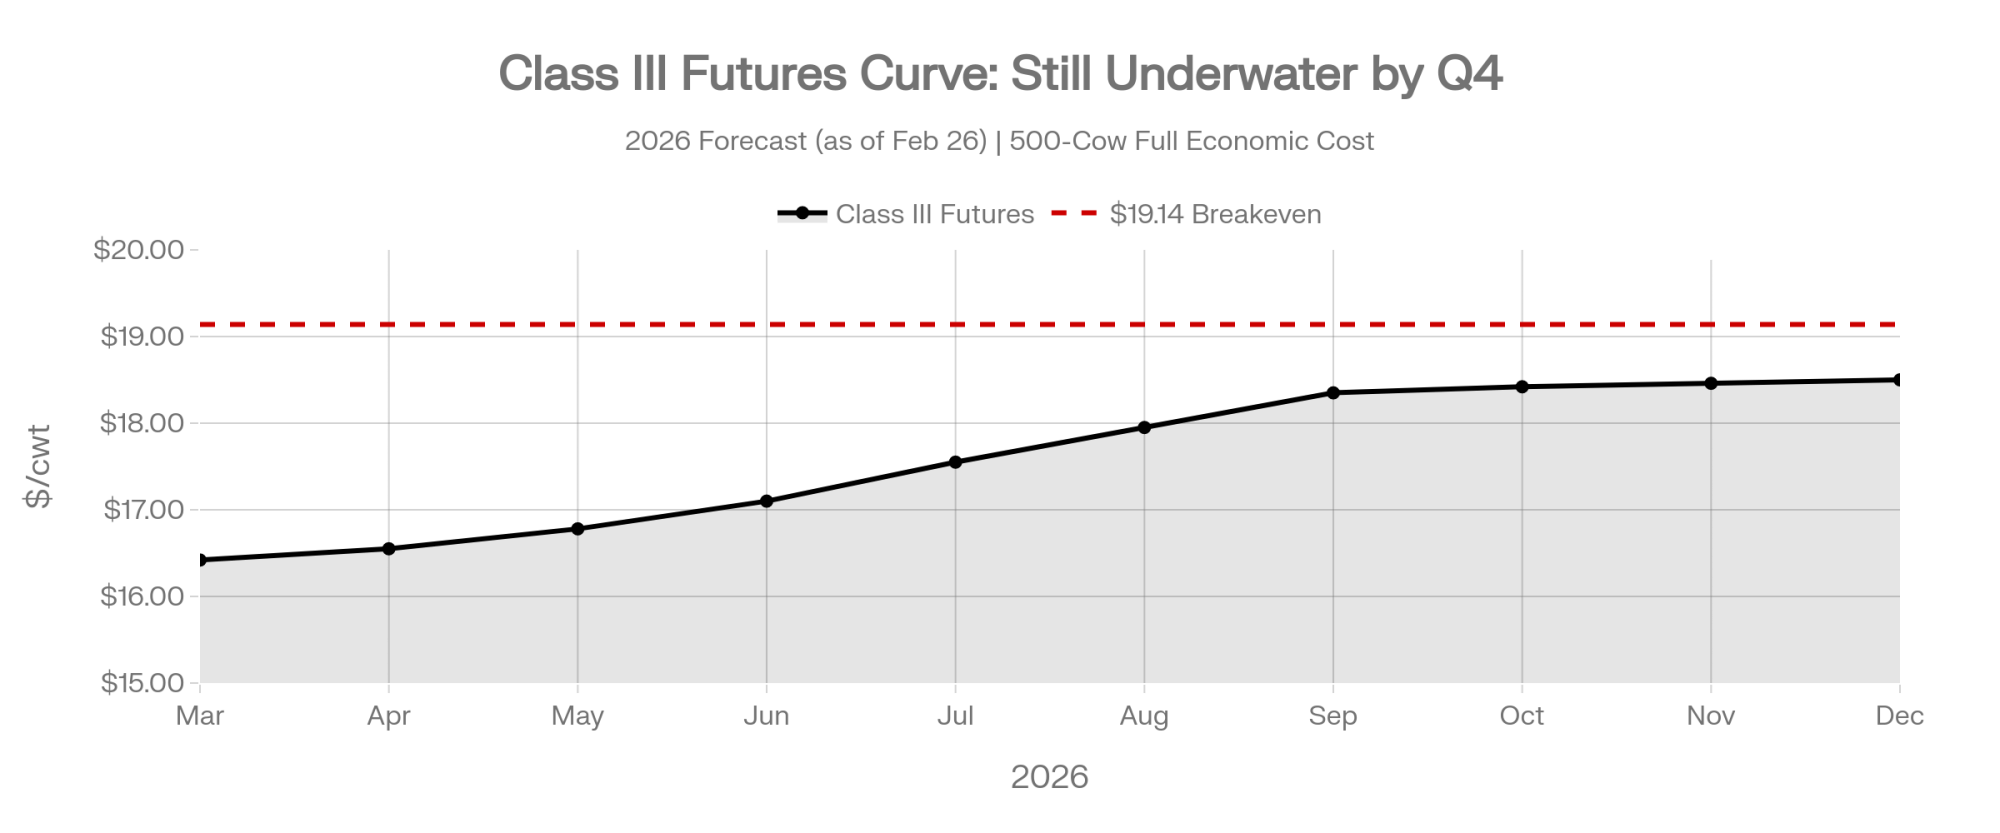
Class III futures for fall 2026. March Class III closed at $16.42 on February 26. USDA’s annual Class III forecast sits at $16.65 — just 23 cents above where the front month settled. The back half has to do most of the heavy lifting to deliver even that modest average. If September–December contracts move above $18.50 by mid-year, the survival math loosens. They’re currently near the $18.35–$18.46 range — right at the edge, not safely above it.
Culling pace. ERS reports dairy cow slaughter is running above year-ago levels in the first four weeks of 2026, even though the herd is 212,000 head larger. Farmers retained older cows through 2025 to sustain output — now they’re culling them. If culling accelerates, the herd will shrink faster than expected, and milk prices could firm in H2.
Your shrink audit results. If the 90-day measurement comes back at 10%+ and your ration runs $7–8/cow/day, you’re sitting on $50,000–$80,000 in recoverable margin. The Statz Brothers documented it. Brouk at Kansas State calculated it. You can capture it before Q3 — and it funds whichever path you choose.
DMC enrollment. The 2026 Dairy Margin Coverage program, reauthorized through 2031 under the One Big Beautiful Bill Act, closed enrollment on February 26. Tier I coverage now extends to 6 million pounds. December 2025’s margin fell to $9.42/cwt — below the $9.50 trigger — producing the only indemnity payment of the year.
DMC isn’t free money — premiums eat into the payout, and if you’re already locked into forward contracts or carry strong component premiums, the incremental protection may be thin. But for operations running on straight Class III with no hedge, it’s a floor worth having at these margin levels.
What $18.95 Milk Means for Your 500-Cow Operation
| Timeline | Action Item | Why It Matters | Success Metric |
| This Week | Calculate burn rate: Working capital ÷ monthly shortfall | Kohl says minimum 3.5 years; below 2.5 years = red-light zone | Know exact months of runway |
| This Week | Start measuring feed shrink with actual weights | Difference between 10% and 4% = $50k–$80k/year on 500 cows | Baseline shrink % documented |
| This Week | Confirm DMC enrollment status (closed Feb 26) | December 2025 already triggered $9.42 indemnity—early 2026 could repeat | Coverage locked or opted-out decision made |
| By March 31 | Stress-test cash flow at $16.50 milk (H1) and $17.50 (H2) | January came in at $14.59; March futures at $16.42—if you assumed $19+, you’re wrong | Updated 2026 projections with real futures data |
| By March 31 | If considering exit within 18 months: Order genomic testing now | $45/head test = difference between $2,850+ genetics buyers vs. $1,400 commodity bidders | Herd genomically profiled before dispersal |
| By March 31 | Schedule proactive lender audit | Wisconsin family who exited strategically preserved $480k; neighbors who waited: under $200k | Meeting scheduled—on your timeline, not theirs |
| By June 30 | Pull full economic cost of production (include market-rate family labor, depreciation, interest) | Lender cares about cash cost; family wealth depends on full economic figure—know both | Both numbers calculated and validated |
| By June 30 | Commit to a path: Lock contracts if fighting through, finalize marketing timeline if exiting | Heifer shortage window won’t stay open indefinitely—processor leverage exists now | Contract signed OR exit timeline finalized |
| By Dec 31 | Evaluate whether H2 delivered | If Sept–Dec Class III average < $18, your 2027 plan needs to start now—not in January | Decision: continue, pivot, or exit |
This week:
- Calculate your burn rate. Working capital ÷ monthly cash shortfall = months of runway. Kohl says you want a minimum of 3½ years. Below 2½ years, you’re in the red-light zone. That single number determines whether you’re choosing your path — or having it chosen for you.
- Start measuring feed shrink — with actual weights. The difference between 10% and 4% represents $50,000–$80,000 annually on a 500-cow operation. Fastest path to bought time.
- Confirm your DMC enrollment status. December 2025 already triggered an indemnity at $9.42 — early 2026 could do the same.
By the end of March:
- Stress-test your cash flow at $16.50 milk through June, $17.50 through December. January came in at $14.59. March futures closed at $16.42. If your projections assumed $19+ milk, they’re wrong. Redo them.
- If you’re considering an exit within 18 months, order genomic testing now. At $45/head, it’s cheap equity insurance. Schedule the lender audit for March — before they call you.
By June:
- Pull your full economic cost of production. Include market-rate family labor, depreciation, and interest at current rates. Your lender cares about cash cost; your family’s long-term wealth depends on the full economic figure. Know both numbers.
- Commit to a path. Lock in processor contracts if you’re fighting through. Finalize your marketing timeline if you’re exiting. The producer leverage window created by the heifer shortage won’t stay open indefinitely.
By December:
- Evaluate whether H2 was delivered. If the September–December Class III average is below $18, your 2027 plan needs to start now—not in January.
Key Takeaways
- If your full economic breakeven sits above $19/cwt, USDA’s $18.95 all-milk forecast doesn’t save you.March Class III closed at $16.42 on February 26. The futures curve says H1 2026 is significantly worse than the annual average implies.
- Decision timing determines equity preservation. The gap between a Q1 strategic exit and a late-2027 forced liquidation can exceed $200,000 in a representative 500-cow scenario. Verified genetics pushes the strategic number toward the top of the range.
- Feed shrink is your 90-day bridge — not your solution. Kansas State puts recoverable savings at $50,000+ for a 500-cow herd. The Statz Brothers captured over $500,000 annually on 4,400 cows. That buys runway. Use it to fund a path choice, not to delay one.
- “Get big or get out” is becoming gospel. One Northeast producer improved per-cow profitability by reducing herd size roughly 20%. Another went from 500 to 300 and saw the same pattern. The math worked because the downsizing was strategic — paired with cost discipline and a focus on the best genetics in the herd.
The Bottom Line
That Wisconsin family didn’t have better genetics or cheaper feed than their neighbors. They had a timeline, a spreadsheet, and the willingness to believe what the numbers showed.
Where does your real breakeven sit against $18.95 milk? And how many months does Kohl’s formula say you’ve got?
This article is intended for informational purposes only and does not constitute financial, legal, or tax advice. Data, projections, and scenarios are based on publicly available information as of February 26, 2026, and should not be relied upon as the sole basis for business decisions. Consult qualified professional advisors for guidance specific to your operation.
Complete references and supporting documentation are available upon request by contacting the editorial team at editor@thebullvine.com.
Learn More
- Feed Inventory Reality Check: Top Dairies Discover $200,000 They Didn’t Know Was Missing – Arms you with five low-cost tactical shifts to recover $100,000+ in annual feed value. This operational roadmap transforms “invisible shrink” into immediate working capital, requiring minimal investment to plug your most frequent cash leaks.
- Decide or Decline: 2025 and the Future of Mid-Size Dairies – Provides the strategic five-year framework needed to protect family equity from the silent drain of indecision. You will gain the regional benchmarks and financial clarity to ensure your operation lands on the winning side of consolidation.
- McCarty’s $40 Genomic Test Exposed a 28% Error – and a $104,750 Leak on a 500-Cow Dairy – Proves how a disciplined $40 genomic test uncovers massive profit leaks hidden by parentage errors. This case study provides the data-driven precision you need to stop breeding mistakes and maximize your herd’s true market value.
 The Sunday Read Dairy Professionals Don’t Skip.
 The Sunday Read Dairy Professionals Don’t Skip.
Every week, thousands of producers, breeders, and industry insiders open Bullvine Weekly for genetics insights, market shifts, and profit strategies they won’t find anywhere else. One email. Five minutes. Smarter decisions all week.


