


We predicted it. Lost $4.3B fighting it. 11,000 farms died waiting. Whole milk’s finally back—but the industry that won isn’t the one that warned.
EXECUTIVE SUMMARY: Whole milk returns to schools after a 13-year ban that cost dairy $4.3 billion and killed 11,000 farms—but the survivors who’ll benefit aren’t the ones who warned Congress this would happen. University of Toronto research confirmed what producers always knew: whole milk reduces childhood obesity by 40% compared to skim milk, completely debunking the policy’s premise. However, consolidation during the fight means only mega-dairies (1,500+ cows) can access school contracts worth $40-80K annually, while 97% of remaining farms are effectively locked out. The window for action is narrow: producers must contact their cooperatives NOW to position for RFPs releasing January 2026, with contracts locking by July. Small operations should forget institutional milk and leverage whole milk’s vindication for premium direct sales, while mid-sized farms face a brutal choice between fighting for scraps or pivoting to specialty markets. The lesson is unforgiving: in agricultural policy, being right means nothing if you don’t survive long enough to collect.

You know, looking at what happened in the Senate last Tuesday—unanimous passage of the Whole Milk for Healthy Kids Act—you’d think we’d all be celebrating. And yeah, it’s definitely a victory. After watching kids dump skim milk down cafeteria drains for 13 years while our neighbors went under, whole milk’s finally coming back to schools.
But here’s what’s been keeping me up at night, and I’ve been hearing the same thing from producers all over. The dairy industry that gets to capture this opportunity? It looks nothing like the industry that warned Congress this would happen back in 2012. We’ve lost 11,000 farms during this fight. The survivors are entirely different breeds—either massive operations with 2,500-plus cows or specialty producers who found their niche. That 300-cow family dairy that needed this policy most? Most of ’em are gone.
| Herd Size | 2012 Farms | 2025 Farms | Change % | Milk Share 2025 % |
|---|---|---|---|---|
| Under 100 cows | 28141 | 16334 | -42 | 7 |
| 100-499 cows | 8868 | 5889 | -34 | 15 |
| 500-999 cows | 1580 | 1025 | -35 | 10 |
| 1,000-2,499 cows | 1000 | 900 | -10 | 22 |
| 2,500+ cows | 714 | 834 | 17 | 46 |
What I’m finding as I talk to folks trying to figure out what this means for their operations is that winning the policy battle doesn’t reverse the structural war we’ve already lost. So let me walk you through what actually happened, what it cost us, and—here’s the important part—what you can actually do about it in the next six months.
The Scale of What We Lost: More Than Just Milk Sales

| Year | Per Capita (lbs/year) | School Policy Phase | Annual Decline Rate % |
|---|---|---|---|
| 2009 | 190 | Pre-Ban | 0.75 |
| 2012 | 185 | Ban Implemented | 2.6 |
| 2015 | 172 | Ban Effect | 2.6 |
| 2018 | 155 | Accelerated Decline | 2.6 |
| 2021 | 141 | Continued Fall | 2.6 |
| 2023 | 130 | Record Low | 1.5 |
| 2025 | 128 | First Increase Signal | -0.8 |
I’ve been going through the numbers with economists at Cornell and Wisconsin, and it’s worse than most of us realize. When the National Milk Producers Federation testified to the USDA back in April 2011 that restricting schools to skim and 1% milk would hurt consumption, they actually underestimated what would happen. You can look it up in their comments if you’re curious—docket USDA-FNS-2011-0019.
School milk represents about 7 to 8 percent of total U.S. fluid milk demand, according to the USDA’s Economic Research Service—we’re talking roughly a billion dollars annually. Sounds manageable, right? But here’s what nobody calculated: when you tell 30 million kids for 13 years that whole milk is unhealthy, you don’t just lose school sales. You lose a generation.
Before 2012’s restrictions kicked in, fluid milk consumption was declining at about 3/4 of 1 percent per year—concerning but manageable, according to the International Dairy Foods Association’s market reports. After? That rate exploded to 2.6 percent annually. That’s not evolution; that’s acceleration.
A Wisconsin producer I know who runs about 450 cows put it best: “We watched our school contracts evaporate overnight. But worse was watching those kids grow up thinking milk was bad for them. Now they’re adults buying oat milk.”
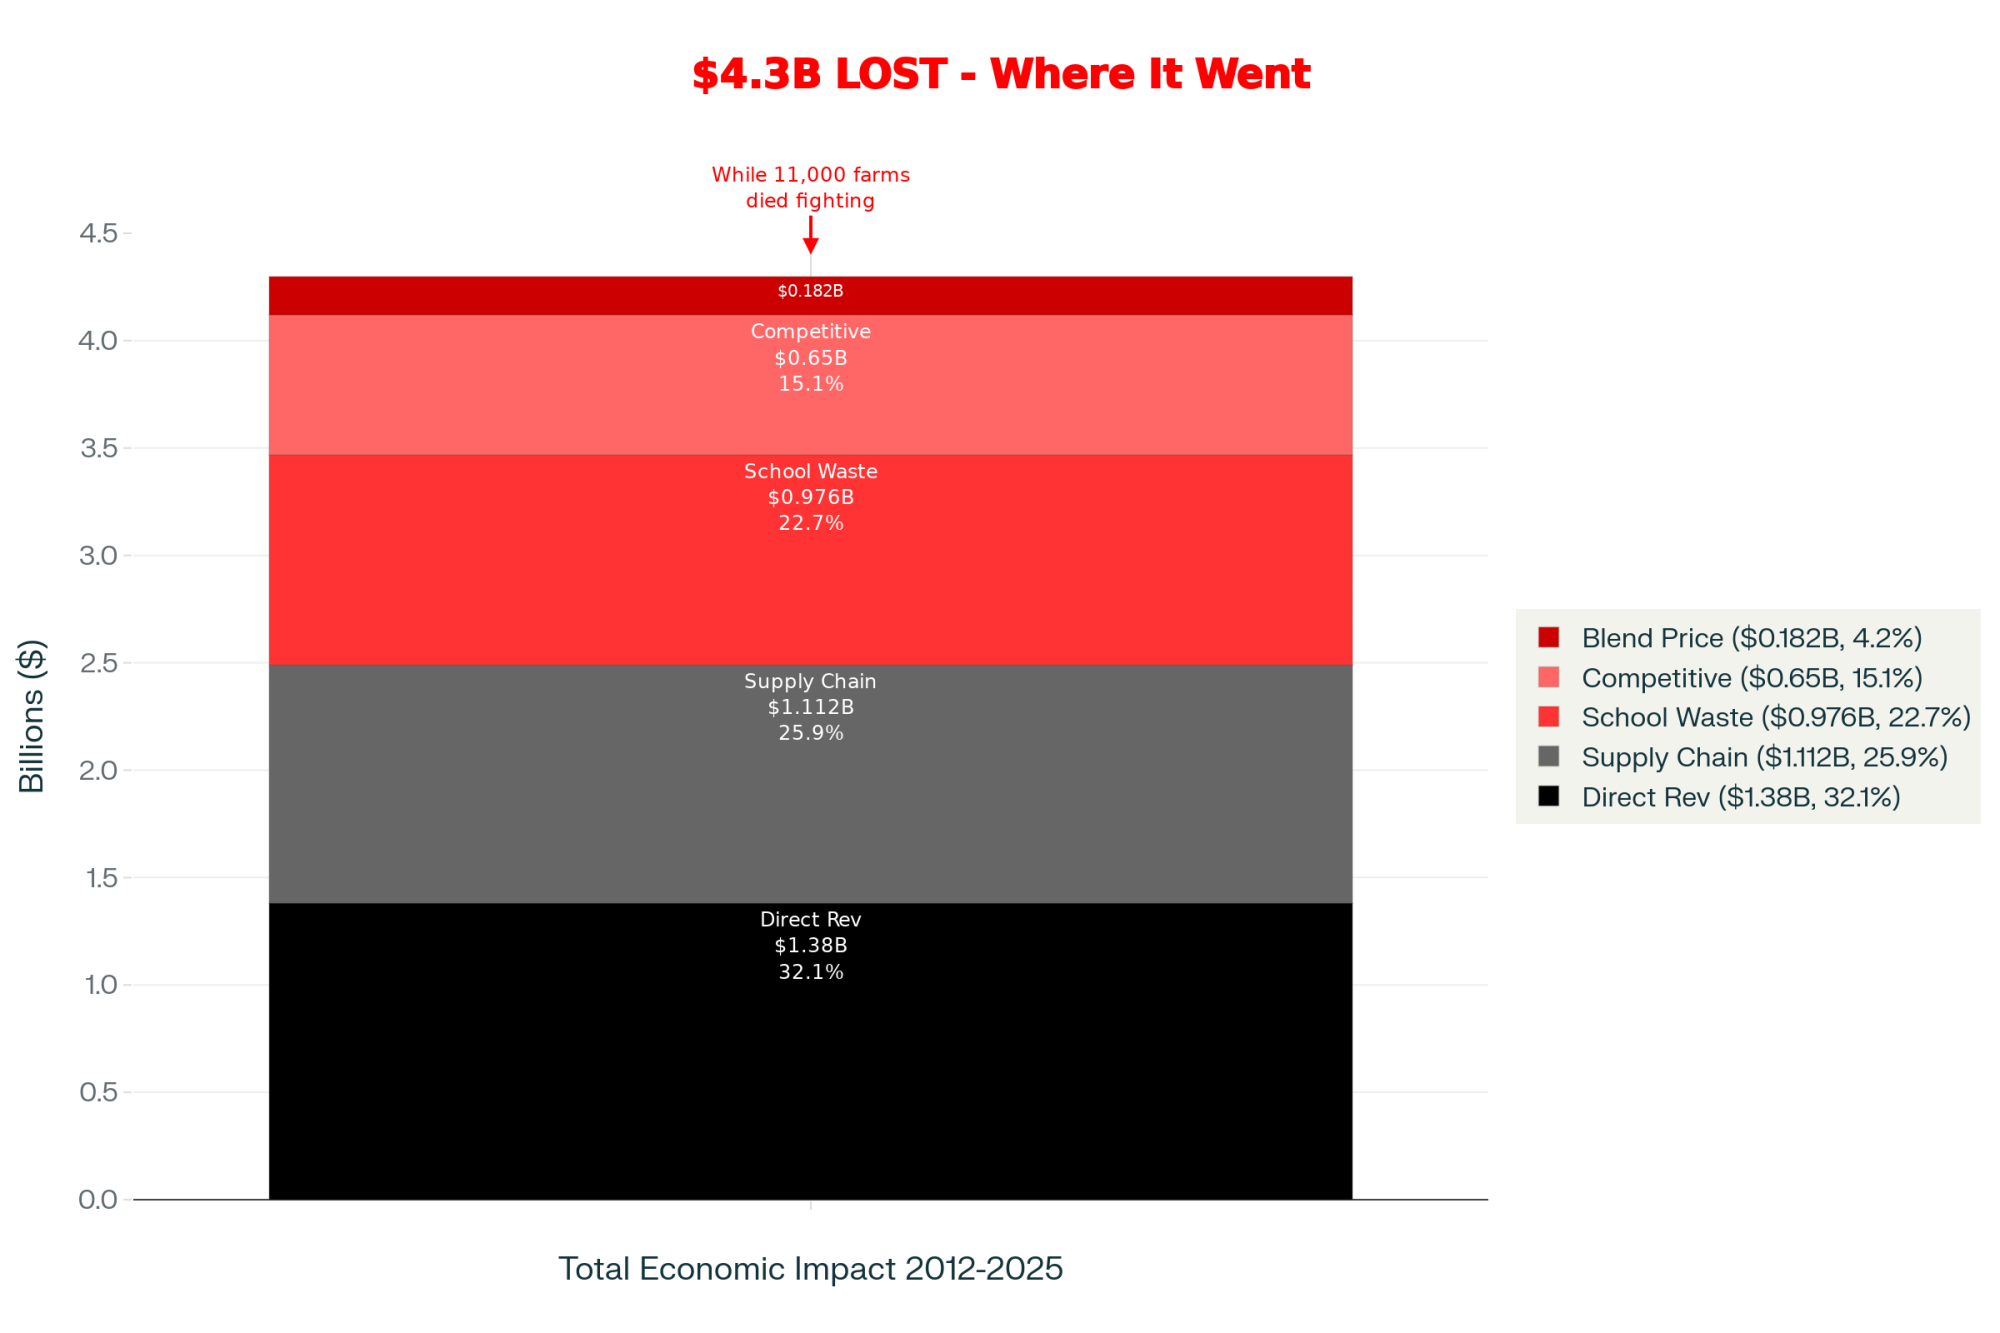
The direct hit to producer revenue over 13 years? Based on Federal Milk Marketing Order pricing data, it’s about $1.38 billion. But that’s just the beginning. When Class I utilization drops in the federal orders, it drags down the blend price every producer receives—University of Missouri’s policy research folks calculated another $182 million spread across all farms.
Then you’ve got the supply chain multiplier effect. USDA’s Economic Research Service uses standard agricultural multipliers of around 1.8 times for dairy. So that lost producer revenue of $1.38 billion means a total supply chain impact of around $2.49 billion. Haulers, feed suppliers, equipment dealers—everybody took a hit.
Add in competitive losses to plant-based alternatives—Euromonitor International’s dairy alternatives tracking pegged it at about $650 million in institutional market share—plus the waste. And the waste is mind-boggling. The Center for Science in the Public Interest estimates that about 45 million gallons annually that kids refused to drink, worth nearly a billion dollars at Class I pricing.
| Category | Amount ($ Billions) | Percentage |
|---|---|---|
| Direct Producer Revenue Loss | 1.38 | 32.1 |
| Blend Price Impact (All Farms) | 0.182 | 4.2 |
| Supply Chain Multiplier Effect | 1.112 | 25.9 |
| Competitive Losses to Alternatives | 0.65 | 15.1 |
| School Milk Waste | 0.976 | 22.7 |
When you combine all these factors—the direct losses, blend price impacts, supply chain effects using those standard multipliers, competitive losses, and waste values—you’re looking at a total economic impact approaching $4.3 billion. Though I should note that nobody’s done a comprehensive study pulling all these pieces together. We’re aggregating from multiple sources here.
“That’s not just a policy mistake, folks. That’s a generational disaster.”
What Science Now Shows: We Had It Backwards All Along
| Metric | Whole Milk | Skim/Low-Fat Milk |
|---|---|---|
| Childhood Obesity Odds | 40% LOWER | Baseline |
| Overweight Risk Reduction | 40% lower odds | No reduction found |
| Added Sugar Content | 0g (natural) | 8-12g (added) |
| Satiety Factor | High (natural fats) | Lower |
| Fat-Soluble Vitamin Delivery | Superior (vitamins A,D,E,K) | Reduced effectiveness |
| Studies Supporting | 18 of 28 studies | 0 of 28 studies |
This is the part that really gets me—and I’m hearing the same frustration everywhere I go. The whole scientific foundation for banning whole milk? It’s completely collapsed.
Dr. Jonathon Maguire, up at the University of Toronto, published this meta-analysis in the American Journal of Clinical Nutrition back in December 2020—looked at 28 studies with 21,000 children. The finding? Kids drinking whole milk had 40 percent lower odds of being overweight or obese compared to those drinking reduced-fat milk. Not one study—not a single one—showed skim milk reducing obesity risk.
As Maguire wrote in the journal, children who followed the current recommendation to switch to reduced-fat milk at age two weren’t any leaner than those who consumed whole milk.
What’s interesting here—and this is what really burns me—is what schools actually did to make fat-free milk palatable. They added sugar. Lots of it. The Center for Science in the Public Interest did an analysis showing that fat-free chocolate milk in schools contains up to 12 grams of added sugar per carton. That’s nearly half what the American Academy of Pediatrics says kids should have in a whole day, based on their 2019 policy statement.
Think about that for a minute. We removed natural milk fat, which provides satiety and fat-soluble vitamins, and replaced it with processed sugar. A dietitian I know at Penn State Extension—she’s been doing this for 30 years—called it the most backwards nutritional policy she’d ever seen.
How Dairy Finally Won: The Coalition Nobody Expected
I’ve been covering dairy politics for two decades, and what happened this year was unlike anything I’ve seen. After failed attempts in 2016, 2019, and that unanimous consent block by Senator Stabenow last December, how’d we suddenly get unanimous passage?
The breakthrough came from the most unlikely place: the Physicians Committee for Responsible Medicine. Now, this group has historically opposed dairy consumption, right? But Senator Welch’s team made a strategic calculation—they added language guaranteeing schools could serve, and I quote, “nutritionally equivalent nondairy beverages that meet USDA standards.”
A Senate Agriculture Committee staffer familiar with the negotiations told me, “We realized we couldn’t win by fighting everyone. So we found ways to give opposition groups something they wanted while still achieving our core goal.”
The senator pairing was brilliant, too. Peter Welch from Vermont brought the economic urgency—his state’s lost more than 500 dairy farms since 2012, according to the Vermont Agency of Agriculture’s latest data through 2024, a crushing 55 percent decline. Roger Marshall from Kansas, an OB-GYN with 25 years of practice before Congress, provided medical credibility that transcended typical ag lobbying. When you’ve got a physician-senator arguing for whole milk’s nutritional benefits, it carries a different weight than dairy executives making the same case.
But the real game-changer came from school food service directors testifying about operational reality. One Pennsylvania director told legislators that the amount of waste they were throwing away each day was disheartening—kids just wouldn’t drink the skim milk.
That operational reality, from public sector administrators rather than industry advocates, changed the conversation entirely.
And then there’s the RFK Jr. factor. When the incoming HHS Secretary calls whole milk restrictions “nutrition guidance based on dogma, not evidence” in public statements, dairy’s position suddenly aligns with a broader health reform movement. FDA Commissioner nominee Dr. Martin Makary went even further at his confirmation hearing, saying we’re ending the 50-year war on natural saturated fat.
The Harsh Reality: Small Farms Can’t Access This Opportunity
Now here’s where I need to level with you about what this actually means for different operations. I’ve been talking to procurement specialists at DFA, Land O’Lakes, and regional cooperatives across the midwest, and the reality’s tough for smaller farms.
For Large Operations (1,500+ cows)
If you’re milking 1,500-plus head, this is a genuine opportunity. Based on current Class I differentials from the November federal order announcement and institutional pricing models, you could see $40,000 to $80,000 in additional annual revenue. These operations typically have what schools need—cooperative relationships for procurement access, daily volume to meet district minimums (usually 2,000-plus pounds), and standardized equipment to hit that 3.25 percent butterfat spec.
A large-herd operator in Wisconsin told me that his co-op has been preparing bid packages since October. “We’ve got the volume, the testing protocols, everything schools require,” he said.
For Mid-Size Operations (500-1,000 cows)
The opportunity exists, but it’s complicated. You might see $15,000 to $30,000 annually—helpful but not transformational. The challenge? You’re competing with larger operations for cooperative priority.
One Central Valley producer milking 650 told me, “I could supply our local district easily. But our co-op prioritizes the 5,000-cow operations because the logistics are simpler. One truck stop instead of eight.”
Down in Texas, the situation’s even tougher. A producer with 725 Holsteins outside Stephenville explained they’re 45 minutes from the nearest processor. “School contracts require daily delivery. The math just doesn’t work unless you’re right next to a bottling plant or have 2,000-plus cows to justify dedicated hauling.”
In Nebraska—right in Senator Marshall’s backyard—the consolidation’s been particularly stark. A producer near Grand Island, milking 550 cows, explained that their cooperative had merged with two others in the past five years. “We used to have direct say in school milk contracts. Now we’re competing with operations five times our size for the same procurement slots.”
For Small Operations (Under 300 cows)
I hate to say this, but institutional whole milk offers almost no direct opportunity for operations under 300 cows. School procurement requires minimums you can’t meet independently—typically 500 gallons per day, based on what I’ve seen in Michigan and Iowa district RFPs.
The path forward is different. A Vermont producer milking 180 Jerseys told me they’re focusing on farmers markets and local retail. “Whole milk’s vindication helps our direct marketing—we can tell customers the government was wrong, and they believe us now.”
In Georgia, small producers are finding similar alternatives. One producer with 220 cows near Quitman explained they can’t compete for Atlanta school contracts. “But we’re selling to three local private schools at $4.50 a gallon. They want local, and whole milk’s return legitimizes premium pricing.”
| Farm Size | Annual Revenue Potential | Market Access | Number of Farms | Access Probability % |
|---|---|---|---|---|
| 2,500+ cows | $60-80K | Direct/Priority | 834 | 95 |
| 1,500-2,499 cows | $40-60K | Direct/Competitive | 900 | 75 |
| 500-999 cows | $15-30K | Limited/Co-op Only | 1025 | 30 |
| 300-499 cows | $5-10K | Minimal | 3200 | 5 |
| Under 300 cows | $0-2K | None | 18109 | 2 |
The Seven-Month Sprint: Your Action Timeline
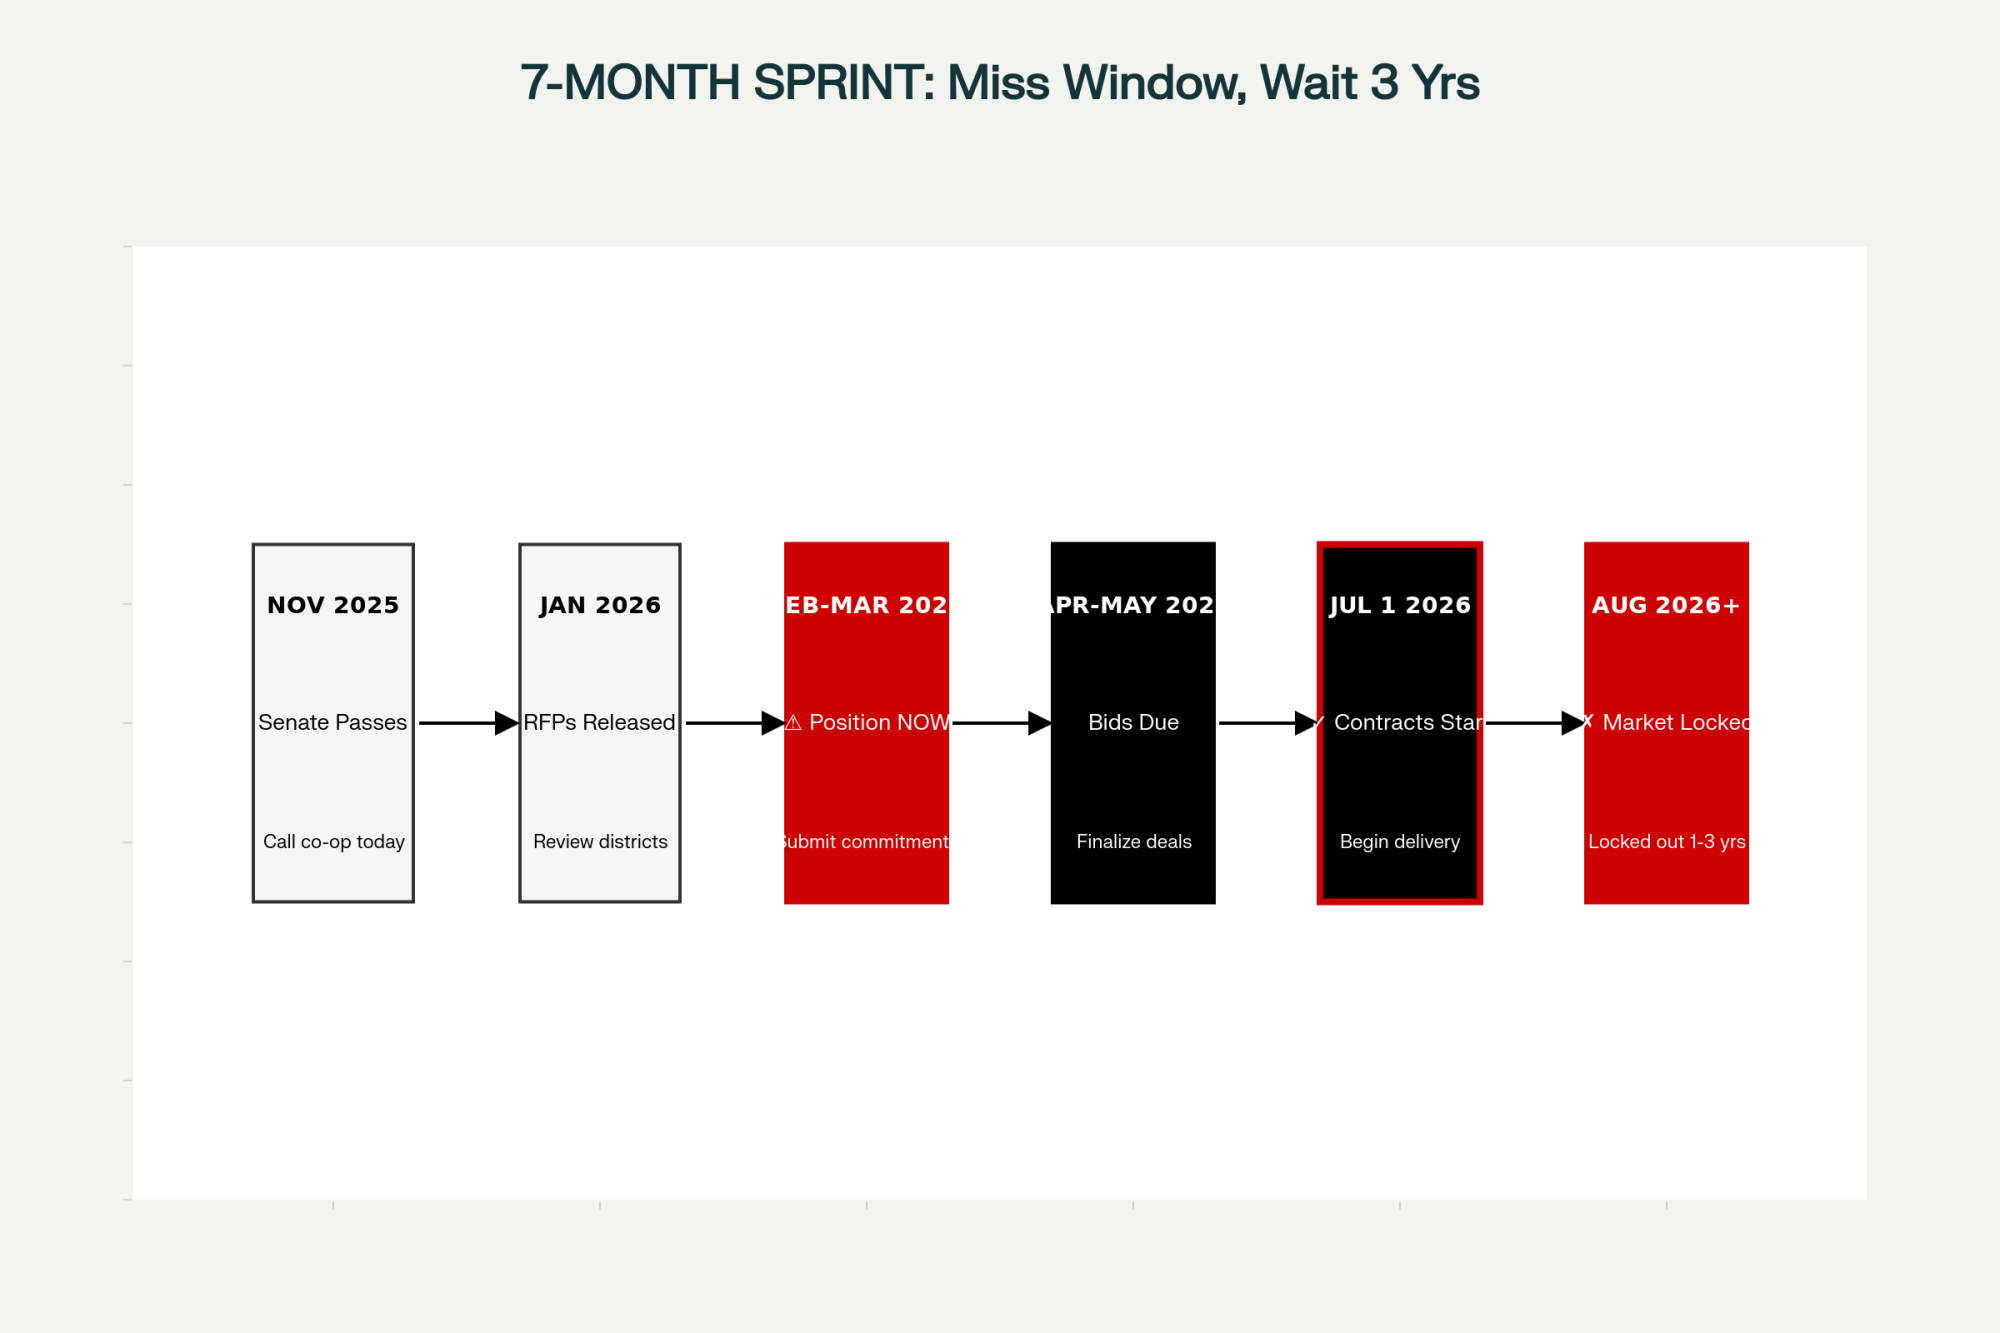
| Date | Action | Producer Action | Critical Level |
|---|---|---|---|
| Nov 2025 | Senate passes bill unanimously | Contact co-op NOW | HIGH |
| Jan 2026 | School RFPs released | Review district opportunities | HIGH |
| Feb-Mar 2026 | Producer positioning window | Submit commitments | CRITICAL |
| Apr-May 2026 | Bids due to districts | Finalize agreements | FINAL DEADLINE |
| Jul 1 2026 | New contracts begin | Begin deliveries | GO-LIVE |
| Aug 2026+ | Market locked (incumbents only) | Wait 1-3 years for next cycle | LOCKED OUT |
What’s catching producers off-guard is how fast this moves. We’re operating on school procurement timelines, not legislative calendars.
📅 The Critical Dates You Can’t Miss:
➤ January–March 2026: School districts release RFPs
➤ April–May 2026: Bids are due (If you aren’t positioned, you’re out)
➤ July 1, 2026: New contracts begin
After July 2026, breaking into the school supply means displacing an incumbent. Good luck with that—I’ve seen it happen maybe twice in 20 years covering dairy markets.
☎️ Your Homework: Call Your Milk Handler TODAY
Don’t wait until next week. Pick up the phone and ask these exact questions:
1. “Are you bidding on school whole milk contracts for 2026-27?”
2. “What commitments do you need from member farms?”
3. “What’s our current butterfat running?” (National average hit 4.23% in October per USDA)
4. “Can you standardize our 4.2% fat down to 3.25%?”
5. “What’s the premium for institutional Class I vs. our current blend?”
6. “Which school districts can we realistically reach?”
A procurement director at one of the midwest regional cooperatives told me they’re getting 50 calls a day about this. The producers who commit early get priority when bid packages go out.
The Genetics Question: Don’t Panic About Your Breeding Program
I’m getting panicked calls from producers worried their genetics are wrong for whole milk. Here’s what Dr. Kent Weigel, who chairs dairy science at UW-Madison, explains: You don’t need to change your genetics. You need standardization capability.
Current U.S. herds are averaging 4.23 percent butterfat according to USDA’s October milk production reports—a record high driven by cheese market premiums. School whole milk needs exactly 3.25 percent. That seems like a problem, but it’s actually an opportunity.
Patricia Stroup, who’s COO at Horizon Organic, explained to me that they standardize all their institutional milk. “Higher butterfat means more cream to separate and sell at premium prices. It’s additional revenue, not a problem.”
Your 4.2 percent milk becomes 3.25 percent whole milk. The separated cream? That’s going into premium butter—CME spot prices have been running around $3.20 a pound lately. You’re not losing value; you’re creating two revenue streams.
Butterfat has a heritability of 0.40 to 0.50 according to USDA’s genetic evaluation summaries—high enough to adjust if truly needed. But genetic changes take 3 to 5 years, depending on generation intervals. This opportunity window might shift again before your genetics catch up.
Dr. Chad Dechow, who does dairy cattle genetics at Penn State, advises keeping your breeding focused on components. “The cheese market isn’t going away, and standardization solves the institutional specifications,” he told me.
Market Outlook: What Economists See Coming
[CHART: Fluid milk consumption trends 2010-2025 with projections]
Looking beyond just the school opportunity, the broader market dynamics matter for positioning. Dr. Marin Bozic, the dairy economist at the University of Minnesota, sees structural shifts ahead.
“We’re entering a period where fluid milk might stabilize at 140 to 150 pounds per capita,” Bozic explained when we talked. “That’s not growth, but it ends the bleeding. For producers, predictable Class I demand at 22 to 23 percent of total utilization beats continued decline to 18 to 20 percent.”
The generational damage is real, though. Kids who drank skim milk in schools from 2012 through 2025 are adults now. They’re not suddenly switching to whole milk because policy changed. But their kids might—if whole milk’s available when they enter school.
IDFA reported in their August 2025 dairy market update that producers sold 0.8 percent more fluid milk than in 2023—the first increase since 2009. Whole milk specifically showed real strength. Conventional whole milk’s up 1.3 percent year-over-year according to IRI’s retail tracking data. Organic whole milk’s up 6.2 percent based on SPINS organic market reports. Flavored whole milk’s up 20 percent in peak months per Nielsen beverage category data.
Whole milk now represents 42 percent of retail sales—the highest since 2001.
The Consolidation Truth: Understanding Today’s Industry

This is the hardest conversation I have had with producers, but we need to face reality. Between 2012 and 2025, based on the USDA’s Census of Agriculture data and structural analyses, the changes are stark.
Farms under 100 cows are down 42 percent, from 28,141 to 16,334. The 100 to 499 cow operations dropped 34 percent. Mid-sized farms with 500 to 999 cows fell 35 percent. But farms with 2,500-plus cows? They’re up 17 percent.
The only category growing is mega-dairies. They now produce 46 percent of U.S. milk while representing just 3 percent of farms, according to USDA-NASS farm structure data.
A former Ohio dairyman who sold 350 cows during the 2015 price crash told me, “The whole milk policy would’ve saved our farm in 2015. But it’s too late now. We’re out, and the neighbor who bought our cows is milking 3,000.”
Wisconsin’s story is particularly telling. They’ve been losing 8 to 10 dairy farms per week from 2014 to 2024, according to data from the Wisconsin Agricultural Statistics Service. The survivors? Either massive operations with economies of scale or boutique producers selling $8 a gallon milk at farmers markets.
Vermont’s even starker. Of their remaining 480 farms—down from 973 in 2012, per the Vermont Agency of Agriculture—73 percent have fewer than 200 cows, accounting for 30 percent of production. Meanwhile, 9 percent are over 700 cows, producing 40 percent of milk.
The mid-sized farms that whole milk could’ve helped? They’re mostly gone.

What This Victory Actually Means
Let me be straight with you about what this moment represents, because false hope doesn’t help anybody make good decisions.
Yes, the science vindicated us—whole milk is better for kids than skim. The University of Toronto research is bulletproof. Yes, we built a coalition that achieved unanimous Senate passage. That’s remarkable in today’s politics. And yes, there’s real money here for farms positioned to capture it.
But let’s acknowledge what this victory can’t do. It can’t bring back the 11,000 farms we lost. It can’t reverse the consolidation that accelerated while we fought this policy. And it can’t transform the fundamental economics pushing dairy toward fewer, larger operations.
A Wisconsin farmer who sold his 450-cow operation in 2018 reflected, “This would’ve been transformational in 2012. Now it’s a nice win for the big guys who survived.”
What strikes me most is the gap between being right and having it matter. The dairy industry accurately predicted everything—consumption collapse, waste, and pressure to consolidate. NMPF’s 2011 testimony to USDA reads like prophecy now. But being right didn’t change the timeline.
“Policy moves on political schedules, not farm survival schedules.”
Your Strategic Choices for the Next Six Months
Based on conversations with successful operators across different scales, here’s what’s actually working.
If You’re Large (1,500+ cows)
Move aggressively on institutional contracts. You’ve got the scale schools need. Lock in that volume before competitors organize. One 5,000-cow operator in Idaho told me they’re dedicating a full-time person just to manage school RFPs through spring 2026.
If You’re Mid-Sized (500-1,000 cows)
You’re in the squeeze zone. Evaluate carefully whether institutional margins justify participation rather than premium-market opportunities. A 750-cow producer in Michigan shared their analysis: “School milk at $22 a hundredweight beats our current blend by $1.50. That’s $40,000 annually—worth pursuing but not transformational.”
Don’t sacrifice premium positioning for commodity institutional volume. If you’re already selling to local cheese plants at premiums, keep that relationship.
If You’re Small (Under 300 cows)
Institutional whole milk isn’t your play. But use the narrative shift. “Whole milk is healthy again” is powerful marketing for farmstead products. One 200-cow Vermont farm just raised its farm-store milk price by 50 cents per gallon, explicitly citing the Senate vote in its newsletter.
Focus on what you can control: direct sales, agritourism, and value-added products. Let the big operations fight over school contracts while you capture consumers wanting “real milk from local farms.”
Looking Forward: The Next Policy Battle
What worries me—and what should worry every producer—is how this pattern might repeat. Some policies constrain the industry; farms adjust or die. Then the policy reverses after structural damage.
The next fight’s already visible: methane regulations, water usage restrictions, carbon credit requirements. Each sounds reasonable in isolation. But we’ve learned what happens when agriculture loses narrative control to health or environmental advocates.
Dr. Kathleen Merrigan, who was USDA Deputy Secretary from 2009 to 2013 and now runs the Swette Center at Arizona State, advises starting to build coalitions now, before you need them. “Dairy can’t win these fights alone anymore,” she told me.
The producers surviving another decade won’t just be efficient operators. They’ll be politically savvy, coalition-aware, and positioned for multiple market channels. School whole milk is one opportunity, but it’s not salvation.
The Essential Reality
After covering this industry through 2009’s depression, 2014’s price spike, the 2015-16 collapse, and COVID’s chaos, here’s what I know: The farms still standing have survived things that should’ve killed them. They’re tougher, smarter, and more adaptable than any generation before.
Whole milk returning to schools is vindication that we were right all along. But it’s arriving to an industry that’s fundamentally restructured from the one that needed it most. The 300-cow farms that testified in 2012 about survival needs? Most are gone. The 3,000-cow operations capturing school contracts in 2026? They would’ve survived anyway.
Understanding that gap—between policy victory and structural reality—that’s what helps you make clear-eyed decisions about your operation’s future. Position for opportunities that match your scale. Build coalitions before you desperately need them. And remember that being right about policy doesn’t guarantee policy changes in time to matter.
The next six months determine who captures the institutional whole milk opportunity. But the next six years determine who’s still farming when the next policy crisis hits.
Plan accordingly, folks.
KEY TAKEAWAYS
- Action TODAY: Call your milk handler immediately with six specific questions (provided in article)—cooperatives report 50 calls/day with early callers getting priority for $40-80K contracts
- Size determines strategy: 1,500+ cows = pursue schools aggressively | 500-1,000 cows = evaluate if $1.50/cwt premium justifies effort | <300 cows = forget institutions, leverage whole milk vindication for premium direct sales
- Critical 6-month window: School RFPs release January 2026 → Bids due April → Contracts lock July 1. After July, breaking in requires displacing incumbents (nearly impossible)
- Harsh economics: The same consolidation that killed 11,000 farms now blocks 97% of survivors from accessing institutional opportunities—whole milk’s return helps those who survived despite the policy, not because of it
Complete references and supporting documentation are available upon request by contacting the editorial team at editor@thebullvine.com.
Learn More:
- Seizing the Moment: Maximizing Milk Solids Output Through Strategic Nutrition and Genetics – Reveals specific ration adjustments and breeding protocols to maximize component yield, allowing producers to capitalize on the “cream stripping” revenue opportunity inherent in new 3.25% school milk contracts.
- Will Your Dairy Farm Survive the Next Decade? The Brutal Math of Consolidation – Delivers a stark financial analysis of the “1,000-cow or niche” divide, providing specific cost-of-production benchmarks that small and mid-sized operations must hit to remain viable during the current market shakeout.
- The 82% Problem: Why America’s Butterfat Isn’t Raising Your Milk Check – Exposes the critical processing bottlenecks devaluing high-component milk, explaining why your 4.2% test might not be paying out and how to align production with processor capacity to protect your premiums.
 The Sunday Read Dairy Professionals Don’t Skip.
 The Sunday Read Dairy Professionals Don’t Skip.
Every week, thousands of producers, breeders, and industry insiders open Bullvine Weekly for genetics insights, market shifts, and profit strategies they won’t find anywhere else. One email. Five minutes. Smarter decisions all week.


