


Trump’s $12B went to grain farmers. Dairy’s much-needed big relief check isn’t coming. Your lender’s review is. You’ve got 30 days to get ahead.
Executive Summary: Trump just handed farmers $12 billion. Dairy didn’t make the cut. The Farmer Bridge Assistance Program announced on December 8 sends $11 billion to row crops—corn, soybeans, wheat—while dairy gets shuffled into a vague $1 billion reserve with no timeline and no check in the mail. After two years of Class III prices swinging $9 per hundredweight, that’s not the relief dairy families needed. With lender portfolio reviews hitting in February, producers have 30 days to get clear on their real numbers: true break-even, actual debt-service coverage, and competitive position. Three paths forward exist—expand, restructure, or exit strategically—and the farms still milking in 2030 won’t be the ones waiting for Washington to save them.

December 8 came and went. Row crop farmers got a $12 billion lifeline. Dairy farmers got a press release mentioning a billion-dollar reserve “for other commodities”—no details, no timeline, no checks. Most producers will receive some bridge payments—often $70,000 to $90,000 for a 300-cow operation. But after this week’s announcement, we now know that this fall’s check is likely the last one you’ll see for a long time. That changes the math. You didn’t just get a bonus; you got a severance package. The question is: What are you doing with it?
Some folks deposited the check, caught up on the feed bill, and went back to managing their transition cows and monitoring bulk tank components. Others paused. They asked a harder question: What am I actually going to do differently with this breathing room?
| Use of Funds | Short-Term Relief (0-3 months) | Long-Term Impact (12+ months) | Best For (DSCR) | Result |
|---|---|---|---|---|
| Pay down feed bill/operating debt | High – immediate pressure reduced | Low – resets cycle but doesn’t change trajectory | Above 1.25 (temporary squeeze) | Buys time, doesn’t change math |
| Catch up equipment payments | High – stops late fees, preserves credit | Low – unless part of turnaround plan | Above 1.5 (isolated issue) | Fine if part of bigger strategy |
| Invest in diagnostic analysis ($2-5K) | Low – feels like spending during crisis | Very High – clarity drives right decisions | ALL levels (knowledge is power) | BEST investment – $5K buys $450K saved |
| Bank it (emergency fund) | Medium – no immediate benefit | Medium – cushion for next volatility | 1.0-1.5 (need flexibility) | Smart for uncertainty, boring but wise |
| Down payment on expansion | Low – commits to larger expense | High or Catastrophic (depends on execution) | Above 1.75 only | Only if you already had financing lined up |
| Premium market certification (organic transition) | Low – costs continue during transition | High if markets materialize, costs recovered | 1.25+ with 3-year horizon | Requires sustained commitment, not desperate pivot |
| Labor improvements (housing, wages) | Medium – retention benefits take time | High – turnover reduction = $155K savings | 1.25+ with retention crisis | Retention pays dividends, but takes 12-18 months |
A fourth-generation Wisconsin dairyman put it simply: “That check bought me time. But time for what? That’s the part I hadn’t really thought through.”
Mark Stephenson at the University of Wisconsin–Madison, who has served as Director of Dairy Policy Analysis and Director of the Center for Dairy Profitability, has been tracking these financial dynamics for years. What the data consistently shows is sobering but won’t surprise most of us. For operations running tight margins, that kind of payment might cover a few months of cash-flow pressure—but it doesn’t fundamentally change the long-term trajectory.
The difference between how farmers use that breathing room may well determine which operations are still shipping milk in 2030.

The Financial Reality We’re Living With
You probably know this already, but it bears repeating: U.S. dairy has been facing structural profitability challenges since at least 2015. This isn’t just bad luck or one tough year strung after another.
USDA Economic Research Service cost-and-return data and farm business summaries from land-grant universities tell a consistent story. Many commercial dairies have operated with thin margins over the past decade—often leaving only a small cushion after covering operating expenses and debt service. Ag lenders generally consider a debt-service coverage ratio above 1.25 “adequate” and above 1.75 “strong,” according to Farm Credit lending materials. Many operations haven’t seen those stronger numbers consistently in years.
Why does this matter so much right now? Volatility.

USDA Agricultural Marketing Service Class III price data clearly tells the story. In 2023, prices ranged from a low of $13.77 in July to $19.43 later in the year. Then, in 2024, it swung even wider—from $15.17 to $23.34 in September. That’s the kind of $4-plus per hundredweight annual swing that’s become almost routine.

For a 300-cow herd shipping around 65,000 pounds monthly, a $4 swing represents roughly $30,000 in annual revenue. That’s the difference between upgrading your cooling system and wondering how you’ll make the equipment payment.

You can’t plan around that kind of volatility. You can only build systems—financial and operational—that survive it.
What Lenders Actually See

When your lender reviews your file, they’re looking at a handful of key ratios. Here’s what those numbers mean from their perspective, based on Farm Credit and Compeer Financial lending benchmarks:
Current Ratio (current assets ÷ current liabilities)
- Above 2.0: Breathing room. You can handle surprises.
- 1.2 to 1.5: Functional but vulnerable. One bulk tank rejection, one compressor failure, one key employee quitting—and you’re scrambling.
- Below 1.0: Crisis. You can’t cover short-term bills without new borrowing.
Debt-to-Asset Ratio
- Under 50-60%: Comfortable. You have options.
- 60-70%: Refinancing gets harder. Lenders watch you closer.
- Above 70%: Difficult territory. Conversations change.
Debt-Service Coverage Ratio (net income available ÷ total debt payments)
- Above 1.25: Adequate coverage with cushion for bad months.
- 1.0 to 1.15: Making payments, but zero margin for error.
- Below 1.0: Farm income can’t cover debt. Something has to change.
When margins run this tight, a price drop or feed cost spike doesn’t just reduce profits. It triggers cascading stress that takes years to recover from. I’ve seen operations that looked solid on paper in January find themselves in workout discussions by August because one thing went sideways and there was no cushion.
Government support programs address immediate pressure. They don’t change the underlying cost structures or market dynamics that created the margin compression.
Getting Honest About Your Numbers
This is where things get practical—and where most farm families haven’t done the math as precisely as they probably should.
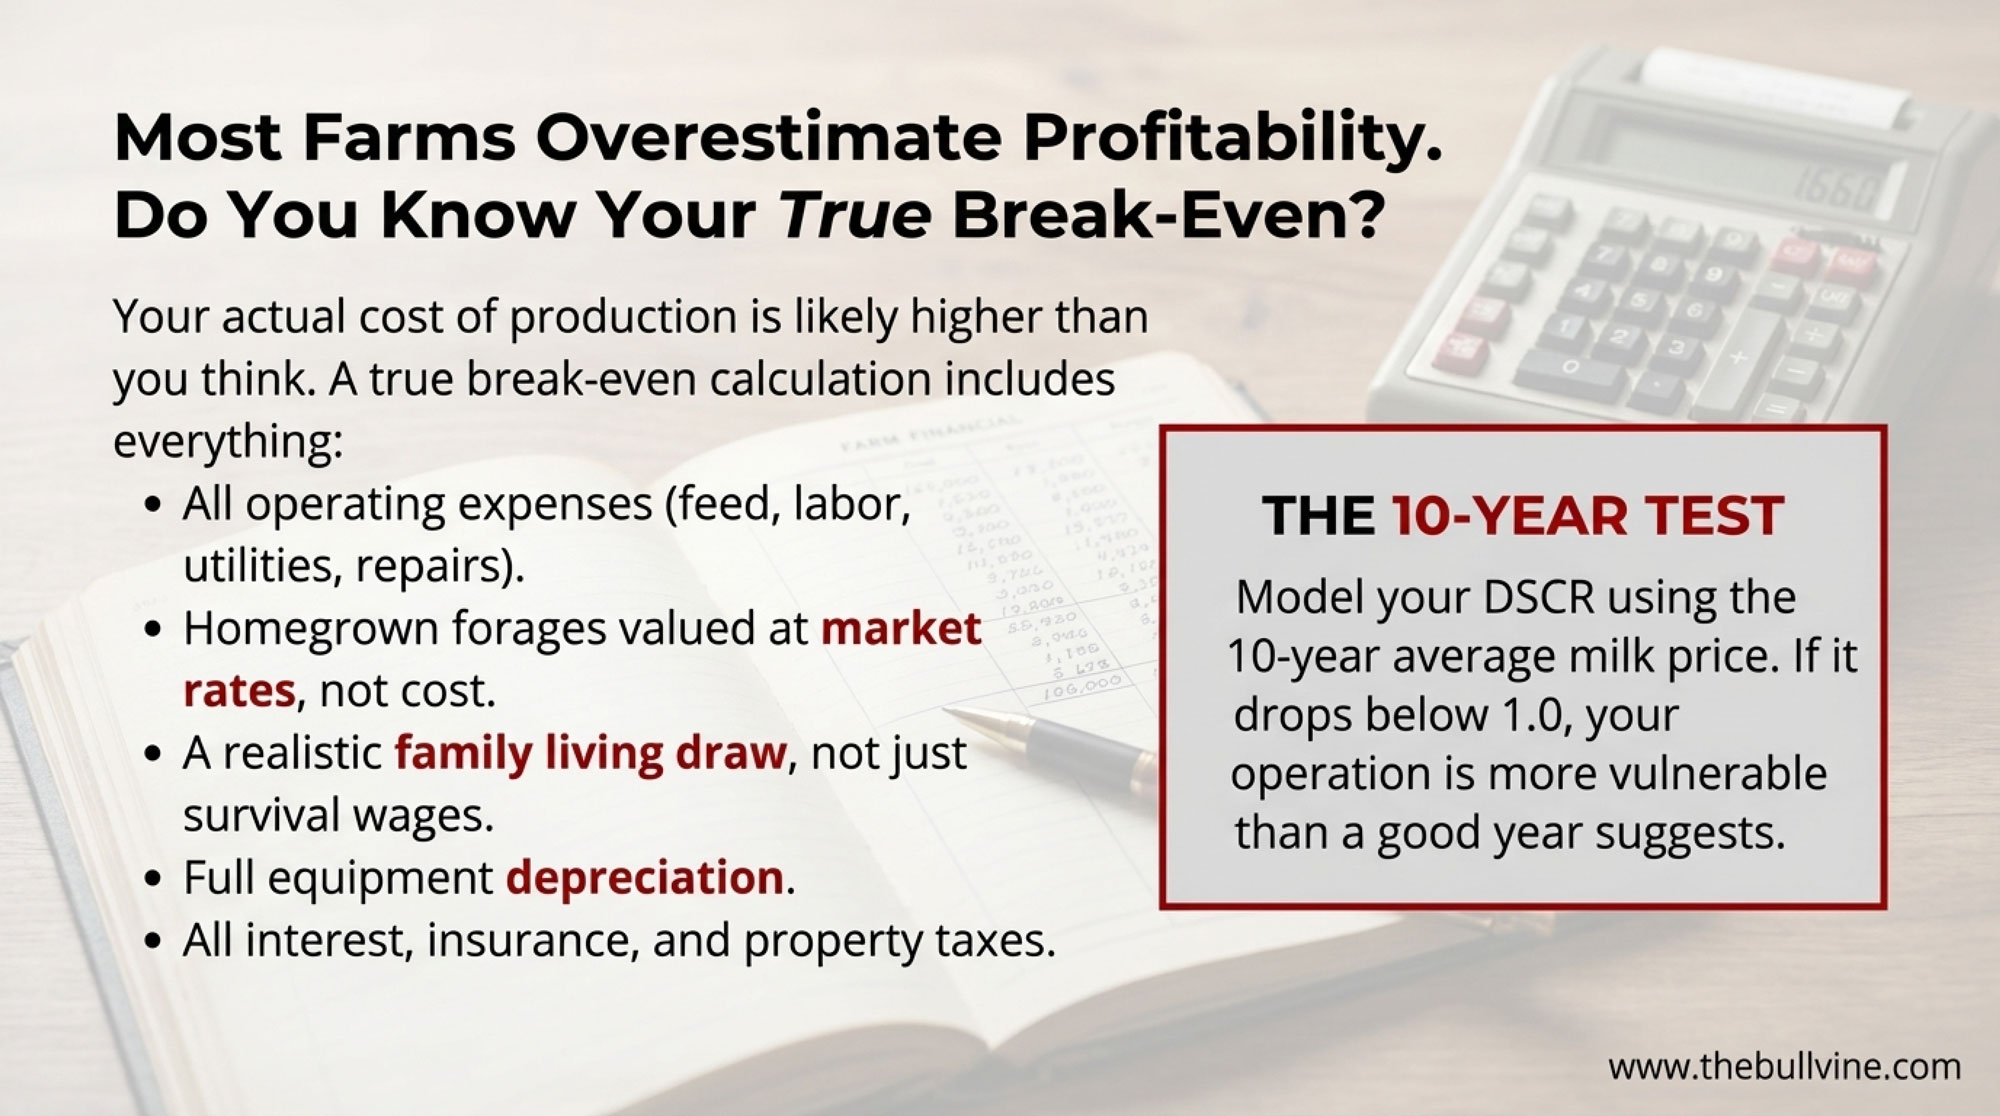
The Center for Dairy Excellence in Pennsylvania coordinates a Dairy Decisions Consultant program connecting dairies with experienced advisors. What their work consistently reveals is that many operators overestimate profitability because they don’t accurately capture all costs.
| Cost Category | Typical $/cwt | Often Underestimated? | Why It Matters |
|---|---|---|---|
| Feed (homegrown at market value) | $9.50 | ✓ YES (many use cost-of-production not market value) | Homegrown hay worth $180/ton? That’s your cost, not $0 |
| Labor (including family) | $4.20 | ✓✓ YES (family labor valued at zero or minimum wage) | Your time has value – $45K/year minimum or you’re paying to work |
| Repairs & Maintenance | $1.80 | ✓ YES (deferred maintenance not counted) | Deferred = future crisis. Include realistic annual average |
| Utilities (electric, water, fuel) | $1.40 | No (usually accurate) | Usually captured accurately in most analyses |
| Insurance & Property Taxes | $1.20 | ✓ YES (property tax increases forgotten) | Increasing property values = rising taxes many forget to model |
| Interest on Debt | $2.10 | No (debt service is visible) | Interest is painful but at least it’s visible in statements |
| Equipment Depreciation | $1.60 | ✓✓ YES (many skip or undervalue) | Equipment wears out. $500K parlor ÷ 15 years = $33K/year real cost |
| Family Living Draw (realistic) | $2.50 | ✓✓✓ MOST MISSED (survival wages vs actual need) | Can your family ACTUALLY live on what you draw? Be honest. |
| Other Operating Expenses | $1.70 | ✓ YES (small categories add up) | Vet, breeding, supplies, fuel – individually small, collectively $1.70/cwt |
| TOTAL True Break-Even | $26.00 | — | Penn State studies: Most farmers underestimate by $3-5/cwt |
Three numbers matter most:
- Your true break-even milk price. This isn’t just operating expenses divided by production. It’s everything: feed, including homegrown forages valued at market rates; labor; utilities; repairs; interest; insurance; property taxes; a realistic family living draw—not survival wages, but what you’d actually need—and equipment depreciation. Penn State Extension cash-flow tools consistently show that once you include family living, full depreciation, and opportunity costs, many dairies discover their true cost of production runs noticeably higher than their mental estimates.
- Your actual DSCR. Net farm income available for debt service is divided by total annual payments. This tells you whether profitability is genuine or depends on favorable price cycles. Here’s a useful exercise: model your DSCR using the 10-year average milk price instead of current levels. If it drops below 1.0, you’re more vulnerable than the good months suggest.
- Your competitive position. How does your cost of production compare to similar operations? USDA’s Agricultural Resource Management Survey and state dairy business summaries group herds by cost percentile. There’s a clear top tier of low-cost producers, a large middle group, and a smaller segment of high-cost operations struggling at commodity prices regardless of market conditions.
What’s revealing—and this comes from conversations with consultants across the Upper Midwest—is how often farmers discover they’re in a different position than they assumed. Operations that undergo formal financial analysis often find that their actual situation differs materially from their intuitive sense of how things are going.

Three Paths Forward
Once you have accurate numbers, strategic options come into focus. Research from Iowa State’s Beginning Farmer Center and Wisconsin’s Center for Dairy Profitability points to three main directions. None is universally right. All require honest assessment.

The Expansion Path
For operations with strong debt-service coverage and genuine competitive advantages—exceptional genetics, reliable labor, favorable land costs, proximity to processing—expansion into the 1,000-plus cow range may offer scale economics needed to remain competitive.
But here’s the reality check. Recent lender case studies and construction bids suggest that taking a 300-cow dairy into that range can require several million dollars in new facilities, equipment, and working capital. At current commercial interest rates—often running 7-8% for expansion financing through private lenders according to Federal Reserve district surveys—payback periods approaching a decade aren’t unusual unless margins run consistently strong.
A Minnesota lender framed the key question this way: Can your operation achieve profitability at the 10th percentile milk price for your region? If expansion only pencils out when prices are above average, the risk profile may be too aggressive.
That said, for the right operation with strong management depth, disciplined financial oversight, and realistic timelines, expansion remains viable. The farms succeeding at scale typically share those characteristics—it’s not just about cow numbers.

The Restructure Path
For DSCR values between 1.0 and 1.25, there’s a middle path. Stay near the current scale while fundamentally improving profitability through efficiency gains or market repositioning.
What’s working for farms pursuing this approach?
- Premium market access. Organic certification can add meaningful dollars per hundredweight according to USDA Agricultural Marketing Service organic price reports, though the three-year transition demands careful cash-flow planning. A2 programs and grass-fed premiums offer smaller but real improvements for operations with appropriate genetics and infrastructure.
- Cost structure improvement. Feed efficiency typically offers the largest opportunity—improving pounds of milk per pound of dry matter intake flows to the bottom line across every cow, every day. Labor efficiency through better scheduling and reduced turnover comes next. Genetic selection emphasizing productive life and component yield rather than type traits rounds out the practical options. For herds averaging 4.0% butterfat versus 3.5%, component premiums can add $0.50 to $1.00 per hundredweight to your mailbox price—that’s real money across a full year of production.
- Cooperative positioning. Farmer-owned cooperatives often provide better price transparency than commodity channels, though this varies by region. Edge Dairy Farmer Cooperative in the Upper Midwest has been active on contract transparency. For some operations, the right co-op relationship provides stability worth as much as a premium.
This path typically requires 3-5 years of focused execution. It works best when the next generation has a genuine interest and developing capability.

The Exit Path
Let’s be clear: Exiting isn’t quitting. It’s preserving equity.
Burning $450,000 of family wealth just to say you hung on for three more years isn’t pride—it’s poor management. And I’ve watched too many families learn that lesson the hard way.
For operations with DSCR persistently below 1.0 or structural losses that relief payments mask rather than resolve, a strategic exit often preserves more family wealth than continued operations.

Farm transition research from Cornell’s Dyson School frames the arithmetic starkly: A farm losing $150,000 annually that delays exit by three years destroys $450,000 in equity—plus the psychological toll on everyone involved. An orderly exit preserves substantially more equity than forced liquidation, in which lenders set the timeline and distressed sales become unavoidable.
That’s not a small difference. That’s the difference between retiring with dignity and starting over with nothing.
Farm transition specialists across Wisconsin and Minnesota consistently report that families preserve substantial wealth—often $100,000 or more—by making decisions earlier and executing deliberately rather than waiting until a crisis removes options.
A retired dairyman in central Wisconsin shared something that stuck with me: “The hardest part was admitting it to myself. Once I did that, the actual process wasn’t that bad. And my kids thanked me for not making them watch it fall apart.”
Exit isn’t failure. For many families, it’s the decision that preserves generational wealth and allows the next generation to build lives that match their actual interests. Sometimes the bravest thing you can do is know when to stop.
| Factor | Expansion Path | Restructure Path | Strategic Exit |
|---|---|---|---|
| Minimum DSCR | Above 1.75 | 1.0-1.25 | Below 1.0 |
| Capital Required | $3-5M+ | $50-150K | Consultant fees only |
| Timeline | 5-7 years to payback | 3-5 years | 8-10 months |
| Risk Level | Very High | Moderate | Low (preserves equity) |
| Success Rate | <5% access financing | 30-40% achieve goals | 100% preserve wealth |
| Next Generation? | Strongly committed | Interested, developing | Free to choose their path |
| Best Case Outcome | 1,000+ cows, economies of scale | Profitable niche, sustainable | Preserve $400K-$680K equity |
| Worst Case Outcome | Crushing debt at 7-8% interest | Margin improvement insufficient | Wait too long, lose $450K |
| Andrew’s Reality Check | Only works for top-tier operations. Most can’t get financing. | Requires discipline and premium market access. Not a miracle cure. | Not failure—it’s strategy. Preserves generational wealth. |
Different Stakeholders See This Differently
Farmers, processors, cooperatives, and lenders view consolidation through different lenses. Understanding those perspectives helps explain why solutions remain elusive.
From the processor perspective, consolidation creates efficiencies. The International Dairy Foods Association has noted that larger, more consistent milk supplies reduce collection costs and enable capital investment in specialized processing. The trend toward fewer, larger farms isn’t something most processors resist—their infrastructure investments often assume it continues.
Cooperatives occupy more complicated ground. Organizations like Dairy Farmers of America represent both large farms that benefit from consolidation and mid-sized operations that struggle against it. That tension surfaces in policy debates, pricing decisions, and governance questions.
Lenders are segmenting portfolios more deliberately. Operations with strong metrics receive competitive rates and expansion financing. Those in the middle face cautious credit and frequent reviews. Those showing deterioration get workout discussions—sometimes before the farm family has acknowledged the trajectory.
The Kitchen Table Conversation
Whatever path makes financial sense, research on farm transitions reveals something important: Most failed successions trace back to communication and expectations more than financial impossibility.
Farm transition educators at Manitoba Agriculture and Penn State Extension report this pattern consistently. Families carry different assumptions about what should happen—and unspoken expectations compound into problems that could have been addressed years earlier.
What seems to work:
- Before the family meeting, each person answers hard questions individually. Senior generation: Can I genuinely step back and let the next generation make different choices? What income do I actually need in retirement? Is this operation viable for the next generation without ongoing relief?
For the next generation: Do I actually want to farm, or am I carrying an obligation? Can I earn a reasonable living from this operation as structured? - During the meeting, a neutral third party presents actual financial data—an accountant, extension educator, or consultant without an emotional stake —presenting facts rather than perceptions.
- After the meeting, document whatever’s decided. Not from distrust. Because written agreements prevent the “I thought you meant…” conversations that later fracture relationships.
The Labor Reality
For operations choosing to stay and optimize, labor management has become as critical as milk price management.
Texas A&M research confirms what many of us have seen firsthand: immigrant labor accounts for about 51% of all dairy workers nationally. And turnover remains a persistent challenge—the FARM Workforce Development program found average turnover approaching 40% across participating dairies. For a 300-cow operation needing three or four milkers, that means potentially replacing more than one person every year.

Michigan State University Extension research shows the total cost of losing and replacing a dairy employee can reach 100-150% of annual wages—accounting for recruiting, training, productivity loss, and learning-curve mistakes. For a full-time milker earning $38,000-$45,000, that’s potentially $40,000 or more every departure.
What are farms with strong retention doing?
- Housing makes a real difference. University of Wisconsin and Cornell Extension case studies describe dairies that added on-farm housing, resulting in dramatic declines in turnover—some reporting waiting lists for positions.
- Total compensation matters more than hourly rate. Consistent year-round hours often retain people better than higher wages with unpredictable schedules. Health insurance moves the needle on retention.
- Career pathways change the equation. Paying for certifications, creating advancement from milker to lead to herd manager—these transform dairy work from a temporary job to a career worth building.
Robotic milking can make sense, but the investment is larger than sometimes expected. Industry benchmarks from Hoard’s Dairyman put individual robots at $150,000 to $275,000 before construction. Three or four units with barn modifications can climb well past a million dollars. The math works when operations are financially solid, and labor genuinely constrains options. It often doesn’t work when you’re already stressed—adding fixed costs to situations that need flexibility.
Regional Realities: Why Your Location Changes Everything
| Region | Typical “”Mid-Size”” | Key Advantage | Major Challenge | What Success Looks Like |
|---|---|---|---|---|
| Upper Midwest (WI, MN) | 300-500 cows | Cheese market infrastructure, cooperative network, land costs moderate | Winter feed costs, labor housing in rural areas, consolidation pressure | DSCR 1.5+, feed efficiency >1.5, co-op loyalty for price stability |
| California / Southwest | 2,000+ cows | Scale economies, year-round production, processing proximity | Water costs ($50K+/year), regulatory compliance, manure management expenses | 2,500+ cows minimum, robotic milking, water rights secured |
| Northeast (NY, VT, PA) | 120-250 cows | Fluid milk premiums, local market access, population density | Land cost 3-4X Midwest, fragmented processing, limited expansion room | Organic or premium markets, direct-to-consumer options, 150+ cows profitable |
| Southeast (GA, FL, TN) | 200-400 cows | Grazing-based lower feed costs, heat-tolerant genetics available | Heat stress (May-Sept), forage quality in humidity, limited processing | Grazing-based <$15/cwt cost, heat abatement investment, niche marketing |
Everything discussed applies most directly to Upper Midwest operations—the Wisconsins and Minnesotas, where cheese-focused production dominates. The framework translates elsewhere, but the specifics shift considerably.
- California and the Southwest operate at entirely different scales—a “mid-sized” Central Valley dairy might milk 2,000 cows. Water costs that barely register in Wisconsin can run $50,000-plus annually in California. Compliance with manure management adds layers of expense. I talked with a Tulare County producer last year who said his regulatory costs alone would bankrupt most Midwest operations his size.
- The Northeast offers stronger local market access and premium opportunities—fluid milk still dominates, and proximity to population centers creates options. But land costs can run three to four times those in the Upper Midwest, and fragmented processing means fewer outlets. A Vermont organic producer told me his premium market access is the only reason he’s still viable at 120 cows.
- The Southeast operates with grazing-based systems, creating fundamentally different cost structures. Heat-stress management and forage systems look nothing like those in Upper Midwest production. Fluid milk focus means different price exposure than cheese-market operations.
The framework—understand your numbers, choose a path, have family conversations, address labor strategically—applies everywhere. But the thresholds and viable options vary considerably. Your local extension dairy specialist can help translate.

What to Do in the Next 30 Days
For the producer who just received government support: Before allocating it all to operations, invest a small portion in understanding your actual position.
A diagnostic assessment from a qualified dairy consultant typically runs $2,000 to $5,000, depending on scope and region. What you receive: actual DSCR compared to benchmarks, true break-even determination, competitive position assessment, and honest conversation about realistic options.
Why January matters: Most lenders conduct annual portfolio reviews in late winter. Getting your analysis done now—before those reviews, before spring planting decisions lock in cash flow, and with time to implement changes before peak production season—gives you maximum flexibility. If your lender identifies concerns in their February review and you haven’t done your homework, you’re reactive. If you’ve already got a plan and the data to support it, you’re in a much stronger position. Wait until March, and you’ve lost two months of runway.
Where to start: County Extension offices often provide free initial consultations. In Wisconsin and the Upper Midwest, the Center for Dairy Profitability at UW-Madison offers farmer-focused analysis at cdp.wisc.edu. The Center for Dairy Excellence coordinates approved consultants across Pennsylvania and neighboring states at centerfordairyexcellence.org. Farm Credit associations offer analysis as part of lending relationships.
Questions worth asking: Where do I actually stand financially? How do I compare to similar operations in my region? What’s my true break-even? Based on these numbers, what options make sense?
Schedule it now. The farmer who gets clarity in January makes better decisions in March—and has time to act on them before the year gets away.
| Week | Action Item | Who to Contact | What You’ll Learn | Cost |
|---|---|---|---|---|
| Week 1 (Jan 6-12) | Gather financial documents | Your accountant/bookkeeper | Actual liabilities, assets, cash flow | $0 |
| Week 1 (Jan 6-12) | Calculate actual DSCR | Extension office (free tools) | Where you REALLY stand (not where you hope) | $0-200 |
| Week 2 (Jan 13-19) | Contact dairy consultant | Center for Dairy Profitability / local consultant | What diagnostic analysis costs ($2-5K) | $0-500 |
| Week 2 (Jan 13-19) | Run break-even analysis | Consultant + your actual production data | True cost per cwt including ALL costs | $2,000-5,000 |
| Week 3 (Jan 20-26) | Schedule family meeting | Spouse, next generation, key family | Whether expectations align across generations | $0 |
| Week 3 (Jan 20-26) | Model 3-path scenarios | Consultant or extension advisor | Which path makes financial sense for YOUR numbers | Included |
| Week 4 (Jan 27-Feb 2) | Meet with lender (proactive) | Your ag lender (Farm Credit, etc) | Their view of your operation BEFORE formal review | $0 |
| Week 4 (Jan 27-Feb 2) | Decide & document plan | Attorney if exit, consultant if expand/restructure | Commitment to action or need to pivot | $500-2,000 |
Government support provides breathing room. What dairy families do with that breathing room—pursue honest assessment and deliberate decisions, or extend the status quo—will shape which operations remain viable.
The farms navigating this successfully share one trait: they got clear on their actual position early enough to still have options.
That’s not pessimism. That’s strategy.

Key Takeaways
- Relief payments buy time—not a future. Use this cash to understand your true position, not just pay down the feed bill.
- Below 1.25 DSCR? You have no cushion. Model your numbers at 10-year average milk prices. If it drops below 1.0, you’re exposed.
- Three paths exist: expansion, restructuring, or strategic exit. All are valid. None work can be done without an honest financial assessment first.
- Waiting costs more than deciding. Cornell research shows that delaying exit by three years destroys $450,000 in family equity. Exiting isn’t failure—it’s strategy.
- January clarity beats March panic. Lenders review portfolios in late winter. A $2K-$5K diagnostic now gives you leverage before those conversations start.
Learn More:
- Beyond the Milk Check: How Dairy Operations Are Building $300,000 in New Revenue Today – Provides a tactical roadmap for the “Restructure Path,” detailing how beef-on-dairy premiums and feed efficiency protocols can add six figures to your bottom line when milk checks fall short.
- The $228,000 Exit Strategy Reshaping Dairy: Inside the 55% Surge in Strategic Bankruptcies – Reveals why Section 1232 tax provisions make Chapter 12 bankruptcy a wealth-preservation tool rather than a failure, potentially saving exiting families over $200,000 in equity compared to a traditional sale.
- Robotic Milking Revolution: Why These Money Machines Are Crushing Traditional Parlors – Analyzes the hard ROI of automation for the “Labor Reality,” demonstrating how labor savings and yield increases can deliver a $118,000 annual benefit for herds transitioning to robotics.
Complete references and supporting documentation are available upon request by contacting the editorial team at editor@thebullvine.com.
Learn More:
- Beyond the Milk Check: How Dairy Operations Are Building $300,000 in New Revenue Today – Provides a tactical roadmap for the “Restructure Path,” detailing how beef-on-dairy premiums and feed efficiency protocols can add six figures to your bottom line when milk checks fall short.
- The $228,000 Exit Strategy Reshaping Dairy: Inside the 55% Surge in Strategic Bankruptcies – Reveals why Section 1232 tax provisions make Chapter 12 bankruptcy a wealth-preservation tool rather than a failure, potentially saving exiting families over $200,000 in equity compared to a traditional sale.
- Robotic Milking Revolution: Why These Money Machines Are Crushing Traditional Parlors – Analyzes the hard ROI of automation for the “Labor Reality,” demonstrating how labor savings and yield increases can deliver a $118,000 annual benefit for herds transitioning to robotics.
 Join the Revolution!
 Join the Revolution!
Join over 30,000 successful dairy professionals who rely on Bullvine Weekly for their competitive edge. Delivered directly to your inbox each week, our exclusive industry insights help you make smarter decisions while saving precious hours every week. Never miss critical updates on milk production trends, breakthrough technologies, and profit-boosting strategies that top producers are already implementing. Subscribe now to transform your dairy operation’s efficiency and profitability—your future success is just one click away.


