


COVID-19 has changed most every aspect of life around the globe. This post will examine the impact on the U.S. dairy industry. The analysis below reflects primarily the impact on producer pricing of milk.
The first item to be reviewed will be the deaths in the U.S. that are related to COVID-19. Chart I below shows a 7 day rolling average of COVID-19 deaths starting in March 2020 through the most current available data. As reported by the CDC, the majority of these deaths result from underlying health conditions complicated by COVID-19. The largest spike was in April with another increase in August. Since the beginning of August to the present there is a downward trend in deaths.
 |
| Chart I – U.S. COVID-19 Related Deaths |
Much of the disruption in daily life has resulted from measures such as quarantines and closing of restaurants, intended to reduce the number of deaths involving COVID-19. Demand for dairy products changed with the closing of restaurants, schools, and other places normally frequented by people. This led to a massive change from reduced food service demand to increased retail demand. For instance, retail cheese sold in grocery stores is usually branded and in small packages bearing brand names such as Kraft, Borden, etc. Cheese for food service is packaged by non-retail companies and is typically packed in large containers without consumer branding. Because of the overnight change in demand, there were brief shortages and excesses causing significant pricing changes. The structure for providing the appropriate product for each channel is significantly different and the rapid change caused major disruption in supply and demand and thereby it caused extreme volatility in commodity dairy product prices.
As a result, the wholesale price of commodities which are used to price producer milk changed quickly and drastically. What is amazing is that the dairy industry changed in a matter of months to service the new high demand channels. There are four commodities that are used to price producer milk in most of the U.S. They are cheese, butter, Nonfat Dry Milk (NDM), and dry whey. Cheese and butter are primarily consumed domestically while NDM and dry whey are primarily export products.
In this post, cheese and butter parameters will be covered first as they are the most significant commodities used to price Class III milk, milk protein, and butterfat. Some of the charts below use moving averages as they level some of the seasonal changes and month-to-month “blips.”
During this time NASS prices for cheese and butter followed a similar pattern. In April, as COVID-19 deaths spiked and quarantining was implemented, the prices of both cheese and butter first took a major drop and then increased to higher prices than before the drop. The cheese prices that followed were record setting highs for cheese. Chart II shows the progression of cheese prices from a low of $1.12 per pound to $2.63 per pound within a few weeks. The low prices brought some major buys at bargain prices which then resulted in shortages in some channels leading to the record setting prices.
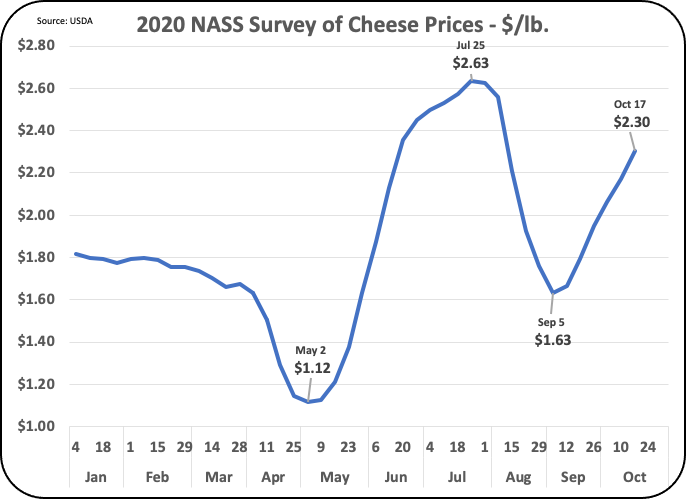 |
| Chart II – NASS Cheese Prices |
The butter price shown in Chart III follows a similar pattern but without record setting high prices. The reason for this will be coved later in this post.
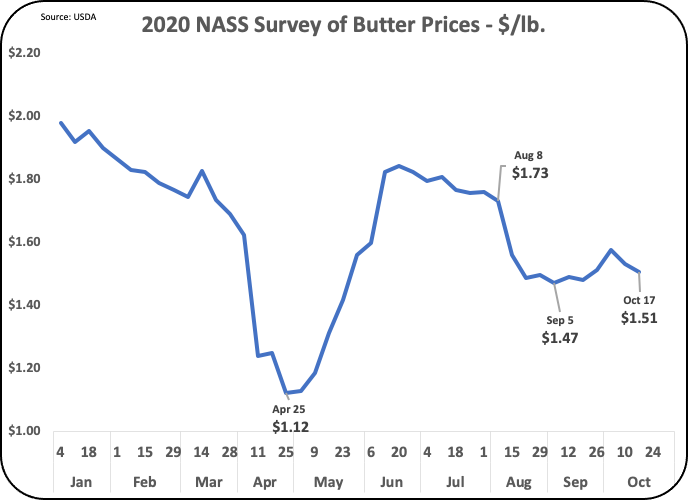 |
| Chart III – NASS Butter Prices |
The prices of NDM and dry whey follow different patterns from cheese and butter. Chart IV shows a major drop in NDM prices in May with a fairly steady increase to its current price. These prices result from international supply and demand and are only slightly impacted by domestic supply and demand. NDM prices are used to price Class IV skim milk.
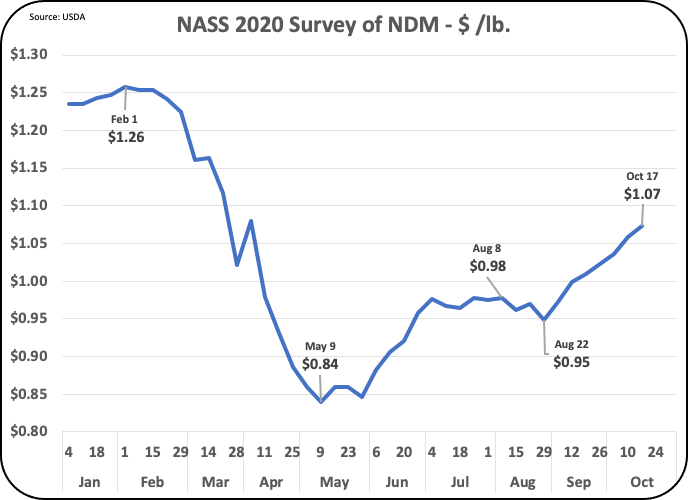 |
| Chart IV – NASS NDM Prices |
The prices of dry whey took an entirely different pattern with highs during the first four months of COVID-19 in the U.S., but then prices fell by nearly 20 percent. Dry whey prices are used to set the value of “Other Solids” in the Class III milk price.
 |
| Chart V – NASS Dry Whey prices |
What did not change?
The product used to represent the NASS cheese is Cheddar cheese. USDA data separates cheese into two categories, American Cheese and “Other” cheese. Cheddar cheese is considered an American cheese. Chart VI shows the production of Cheddar cheese and other American cheeses. Unlike many of the above charts, this chart shows no variation during the time of COVID-19 lifestyle changes.
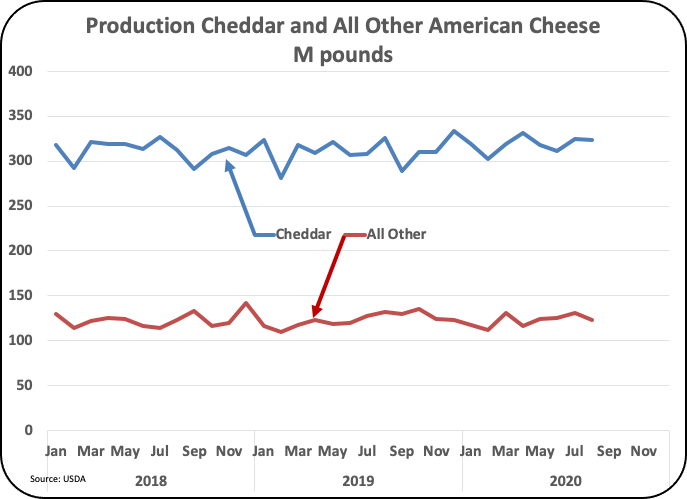 |
| Chart VI – Production of American Cheeses |
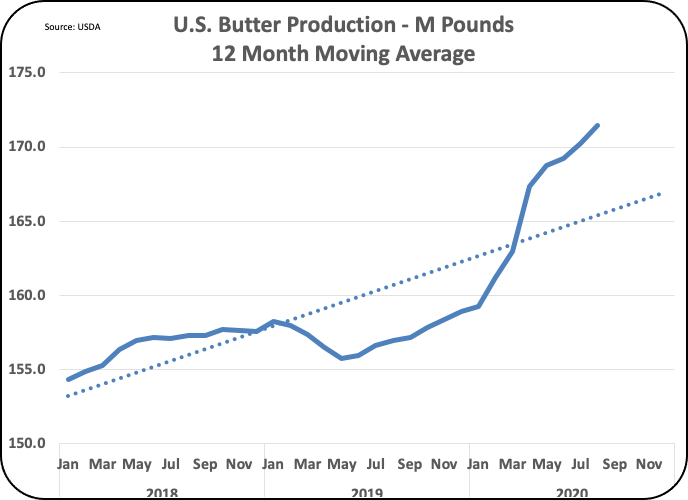
Production of Butter is shown in Chart VII. This is shown as a 12-month moving average as there are annual cycles of butter production that make trends more difficult to follow. Butter production has been increasing in 2019 and 2020, after years of minimal changes in butter churning. In 2020, the increases have been very significant, and with little impact from COVID-19.
 |
| Chart VII – Production of Butter |
The “bottom line is that the COVID-19 pandemic had little impact on the production of cheese and butter.
 |
| Chart VIII – Inventories and NASS price of Cheese |
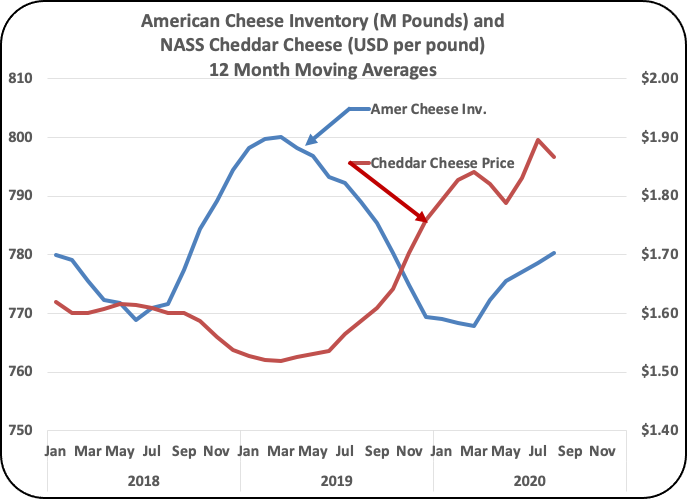
Butter inventories and prices have taken a different path. As shown in Chart VII, butter churning has increased. Butter disappearance from cold storage has been steady through the COVID-19 pandemic and the increased churning has therefore increased cold storage supplies. With increased inventories, lower prices have prevailed and will probably continue for some time.
 |
| Chart IX – Inventories and NASS price of Butter |
In conclusion, the “crisis” of COVID-19 has had a very significant impact especially on cheese prices. Cheese prices are the most influential variable in producer milk prices. While the COVID-19 pandemic continues to be a threat to the U.S. lifestyle, it appears that the worst of deaths and price volatility is behind us. American cheese inventories are at a 50 to 55 days’ supply which is “normal.”
The CFAP program has delivered some nice cash support for the dairy industry. Now the problem that may arise will likely be the familiar one of too much milk.


