


80% of dairy farmers can’t answer a €27,000 question. After this winter, you won’t be one of them.

EXECUTIVE SUMMARY: There’s a €27,000 (~$29,000 USD) question that 80% of dairy farmers can’t answer: What’s your feed efficiency ratio? That single number determines whether your operation’s biggest expense—50-70% of costs according to USDA data—generates profit or disappears into the manure pit. The math is compelling: improving from 1.4 to 1.6 efficiency captures €281 per cow annually without new genetics, additional cows, or capital investment. Research from Iowa State’s Dr. Lance Baumgard, Cornell’s transition cow program, and Penn State Extension reveals three proven strategies: systematic measurement, silage preservation, and metabolic optimization. Winter 2025-2026 is your measurement window—housed cattle, stable rations, no heat stress confounding your baseline. All you need: seven days, a bathroom scale, and a moisture tester. The bottom line is simple: you can’t deposit milk production; you deposit margin.
Growing numbers of progressive dairy operations are discovering that a single metric—feed efficiency—holds the key to capturing thousands in additional profit without producing more milk. Here’s what the industry’s efficiency pioneers are finding, and how your operation can benefit from their insights.
The question caught the experienced dairy farmer off guard during a routine consultation last winter: “What’s your current feed efficiency ratio?” After successfully managing 100 cows for 15 years, producing a respectable 35 kilograms of milk per cow daily, he couldn’t answer. Like many in the industry, he knew total feed costs and milk production, but not the critical ratio connecting them.
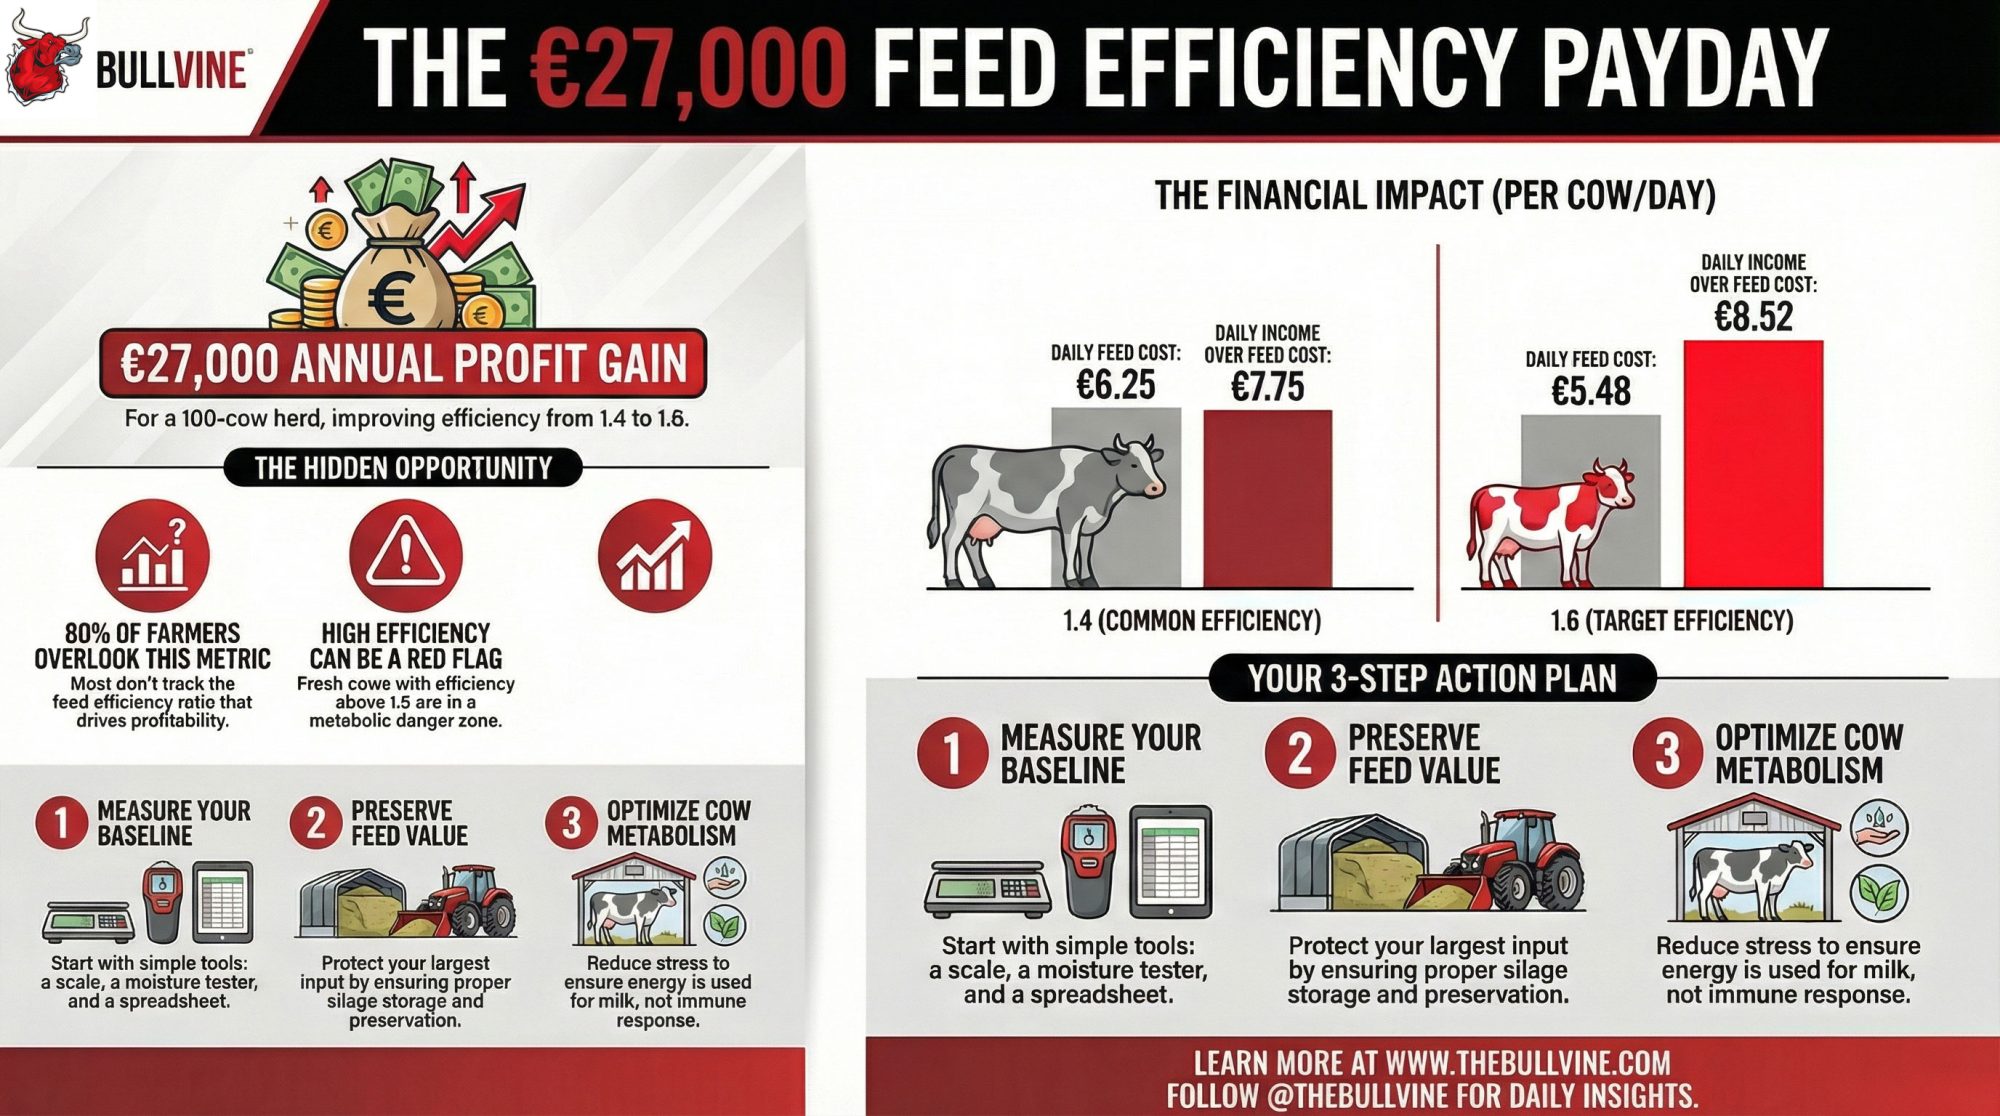
What happened next transformed his operation. Within twelve months of implementing systematic efficiency measurement, his farm captured over €15,000 (~$16,200 USD) in additional profit—without buying a single additional cow or increasing milk production. His story reflects a broader awakening across the dairy industry: improvements in feed efficiency from 1.4 to 1.6 generate approximately €270 (~$290 USD) per cow annually, based on current commodity prices of €0.25 per kilogram dry matter and €0.40 per kilogram milk. For a typical 100-cow operation, we’re talking about €27,000 (~$29,000 USD) in potential improvement.
This builds on what we’ve seen in operations worldwide. Farms implementing comprehensive efficiency strategies report remarkably consistent results. With feed costs accounting for 50-70% of operational expenses, according to USDA Economic Research Service data, understanding this metric has become fundamental to sustainable dairy farming.
Understanding the Industry’s Relationship with Efficiency Data
What’s particularly noteworthy is how sophisticated we’ve become in certain areas—genomic testing, milk component analysis, reproductive protocols—while feed efficiency remains a blind spot for many successful operations. I find this fascinating, actually.
Industry consultants Jacques Bernard and Christine Massfeller regularly encounter this pattern. When they ask fundamental questions about dry matter consumption or cost per kilogram of energy-corrected milk, even experienced producers often pause. This isn’t about capability—it reflects how our industry has traditionally measured success.
Recent industry observations suggest that while most farms diligently track milk production and components, regular efficiency calculation remains less common. The gap between what we measure and what drives profitability deserves our attention.
THE GOLDEN RATIOS: Know Your Efficiency Targets
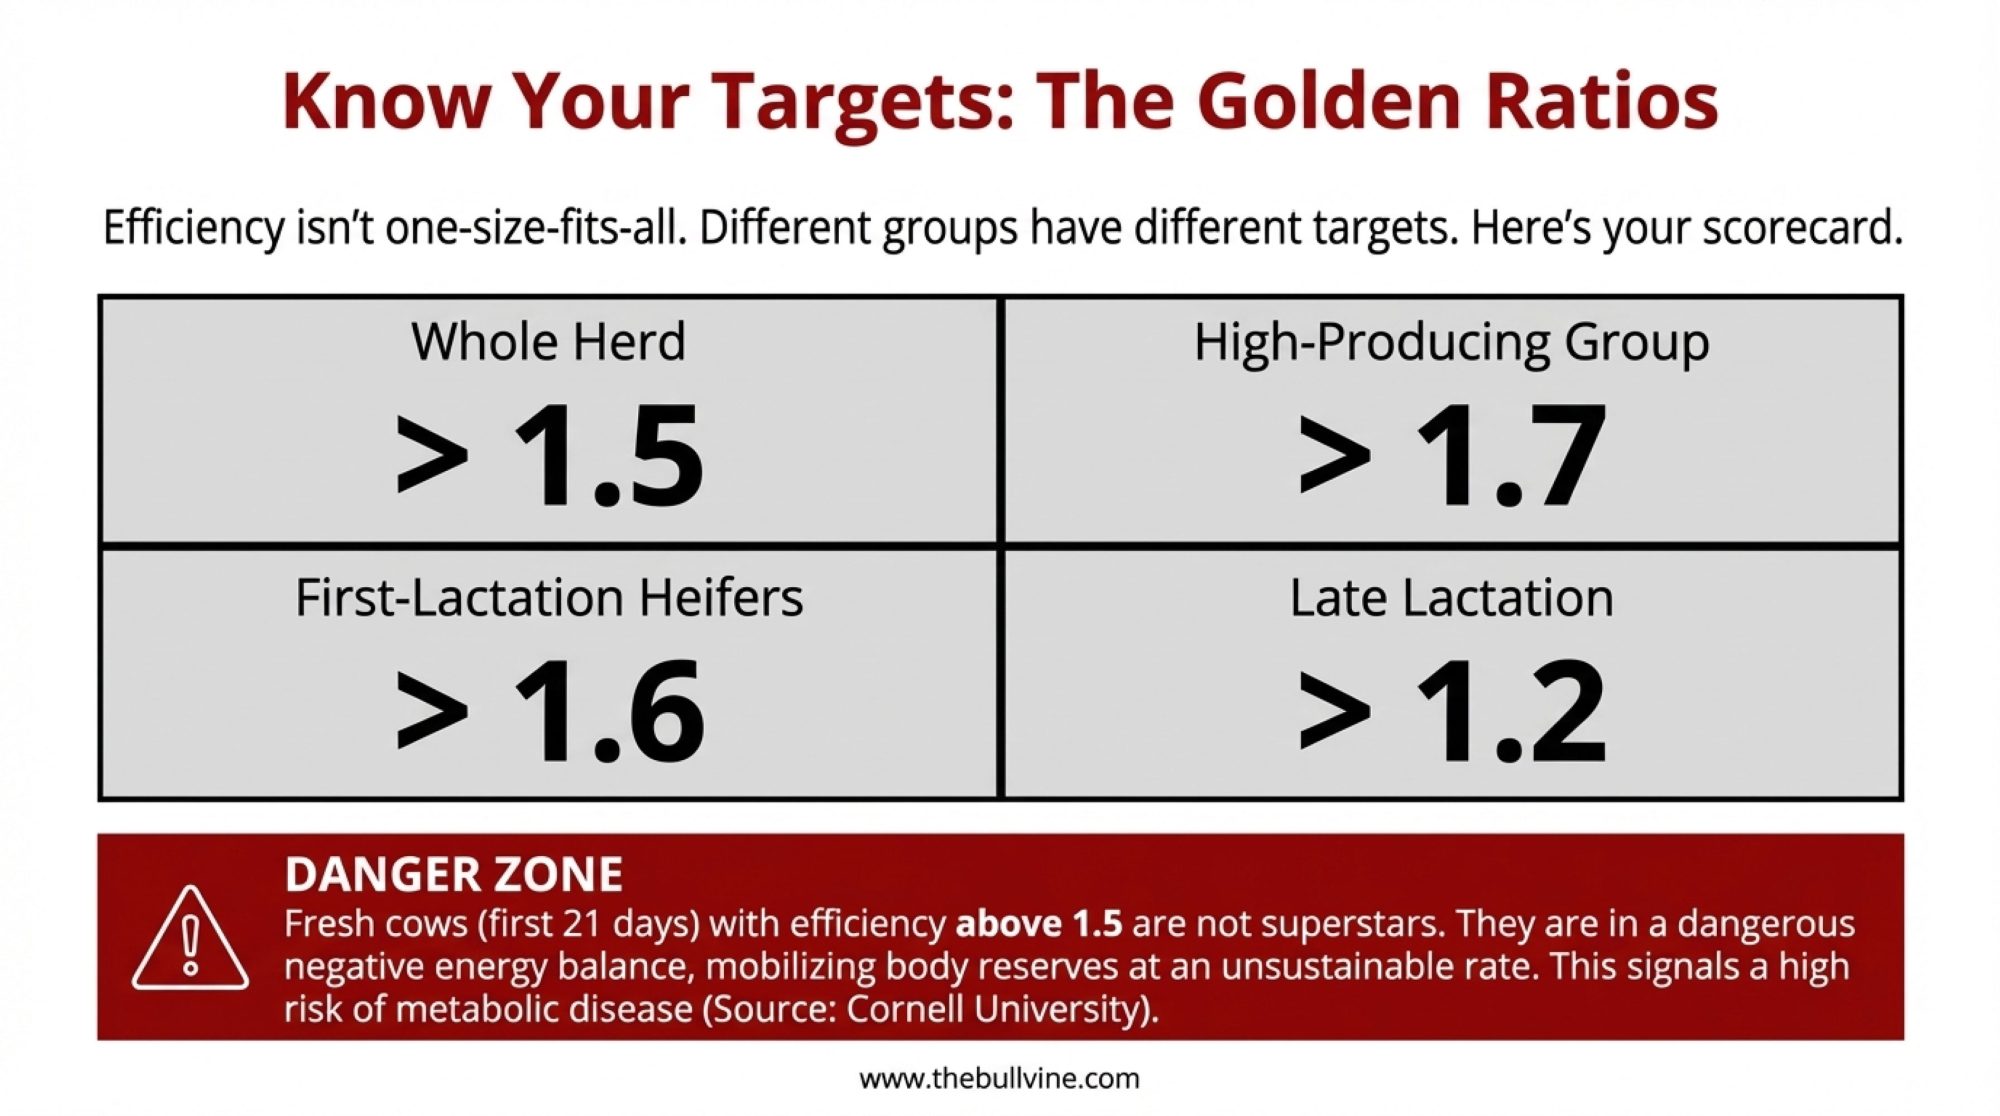
| Group | Target |
| Whole Herd | > 1.5 |
| High-Producing Group | > 1.7 |
| First-Lactation Heifers | > 1.6 |
| Late Lactation | > 1.2 |
⚠️ WARNING: Fresh Cows (First 21 Days) Above 1.5 = Metabolic Danger Zone
Fresh cows with efficiency above 1.5 are actually experiencing a dangerous negative energy balance, mobilizing body reserves at an unsustainable rate despite appearing to be top producers. Cornell University’s transition cow management resources indicate that these animals face a substantially higher risk of metabolic disease.
The Economics Behind Efficiency Improvement
Let me walk through some practical mathematics that illustrates why this matters so much to your bottom line. Consider a standard scenario with 35 kg of daily milk production at a milk price of €0.40 per kilogram and a dry matter feed cost of €0.25 per kilogram.

| Metric | 1.4 Efficiency | 1.6 Efficiency | Daily Difference |
| Dry Matter Intake | 25.0 kg | 21.9 kg | -3.1 kg |
| Feed Cost (€0.25/kg) | €6.25 | €5.48 | €0.77 Saved |
| Income Over Feed Cost | €7.75 | €8.52 | +€0.77 Profit |
| Annual Impact (100 Cows) | — | — | +€28,100 (~$30,350 USD) |
The difference—€0.77 per cow daily—accumulates to €281 annually per animal. Scale that across 100 cows, and you understand why progressive producers are prioritizing this metric.
I recently spoke with a Wisconsin producer who shared an interesting perspective. His cows are producing 2 kg less milk than three years ago, yet his operation is significantly more profitable because feed costs dropped by double digits through efficiency improvement. Sometimes the path to profitability isn’t about maximum production—it’s about optimal conversion.
Learning from Poultry and Swine: A Different Approach
The contrast between dairy and monogastric operations offers valuable lessons. Poultry and swine producers monitor feed conversion with remarkable precision, whereas dairy producers have traditionally focused elsewhere. Why this difference?
Part of it comes down to the simplicity of measurement. Tracking tissue growth in a broiler is straightforward compared to partitioning nutrients across milk components, body condition, and reproduction in dairy cattle. Their shorter production cycles provide rapid feedback, and integrated technology has become standard infrastructure.
Modern broiler facilities employ AI-powered systems, achieving impressive precision in automated monitoring. Swine operations use real-time tracking for weight, growth, and intake patterns. This isn’t futuristic—it’s current standard practice enabling continuous optimization.
What’s encouraging is dairy’s technological evolution. The Cattle Feed Intake System developed at the University of Wisconsin-Madison uses 3D cameras and deep learning for individual cow monitoring. Early adopters report payback within 18 months through efficiency gains alone. We’re catching up, and the results are promising.
Recognizing Efficiency Problems: Key Indicators
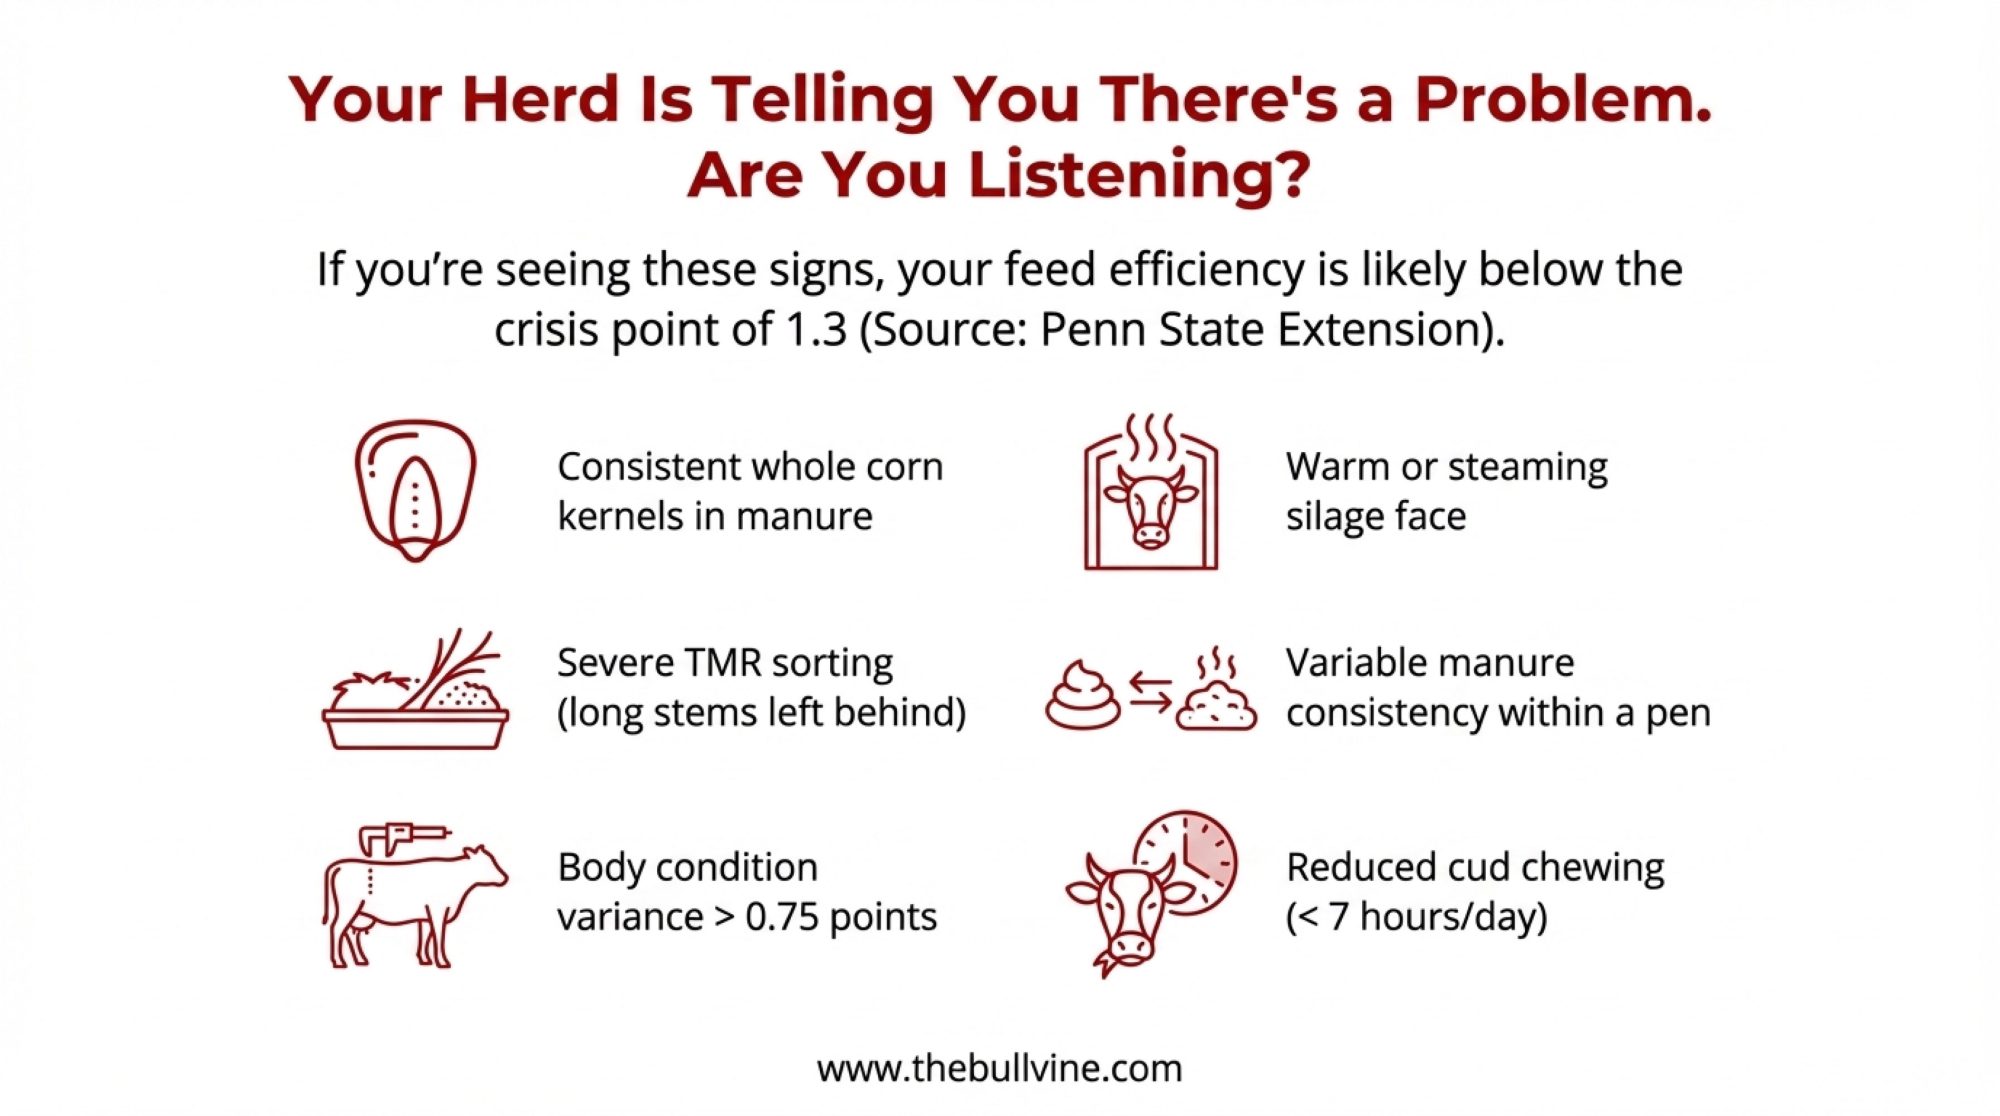
If you’re observing these signs, it’s time for closer examination:
- Consistent whole corn kernels in manure—beyond occasional presence
- Warm silage face—noticeably above ambient temperature, sometimes steaming
- Severe TMR sorting—refusals predominantly long stems while grain disappears
- Variable manure consistency within pens—suggesting diet variation
- Body condition variance exceeding 0.75 points within groups
- Reduced cud chewing—below the target 7-10 hours daily
- Long particle predominance in refusals—above 19mm
Penn State Extension’s feed management resources indicate that multiple symptoms typically correlate with efficiency below 1.3.
Three Complementary Strategies for Efficiency Improvement
The evolution of nutrition strategies over the past decade has been remarkable. What started as competing philosophies has matured into complementary systems addressing different efficiency aspects.
Strategy 1: The Measurement Foundation (Data > Assumptions)

Improvement starts with accurate data. German-based AHRHOFF GmbH, operating across multiple countries since 1996, exemplifies this approach. Feed advisor Rainer Kossmann describes their priority as helping clients develop an intuitive understanding of herd consumption through systematic measurement.
The systematic approach incorporates digital tracking for precise dry matter intake, Penn State Particle Separator analysis for sorting behavior, manure evaluation for passage rate assessment, and regular moisture testing for ration accuracy. This foundation reveals the actual difference between assumed and actual intake—often a 10-15% gap worth thousands of dollars annually.
Strategy 2: Preserving Feed Value (The Hidden Rumen Driver)
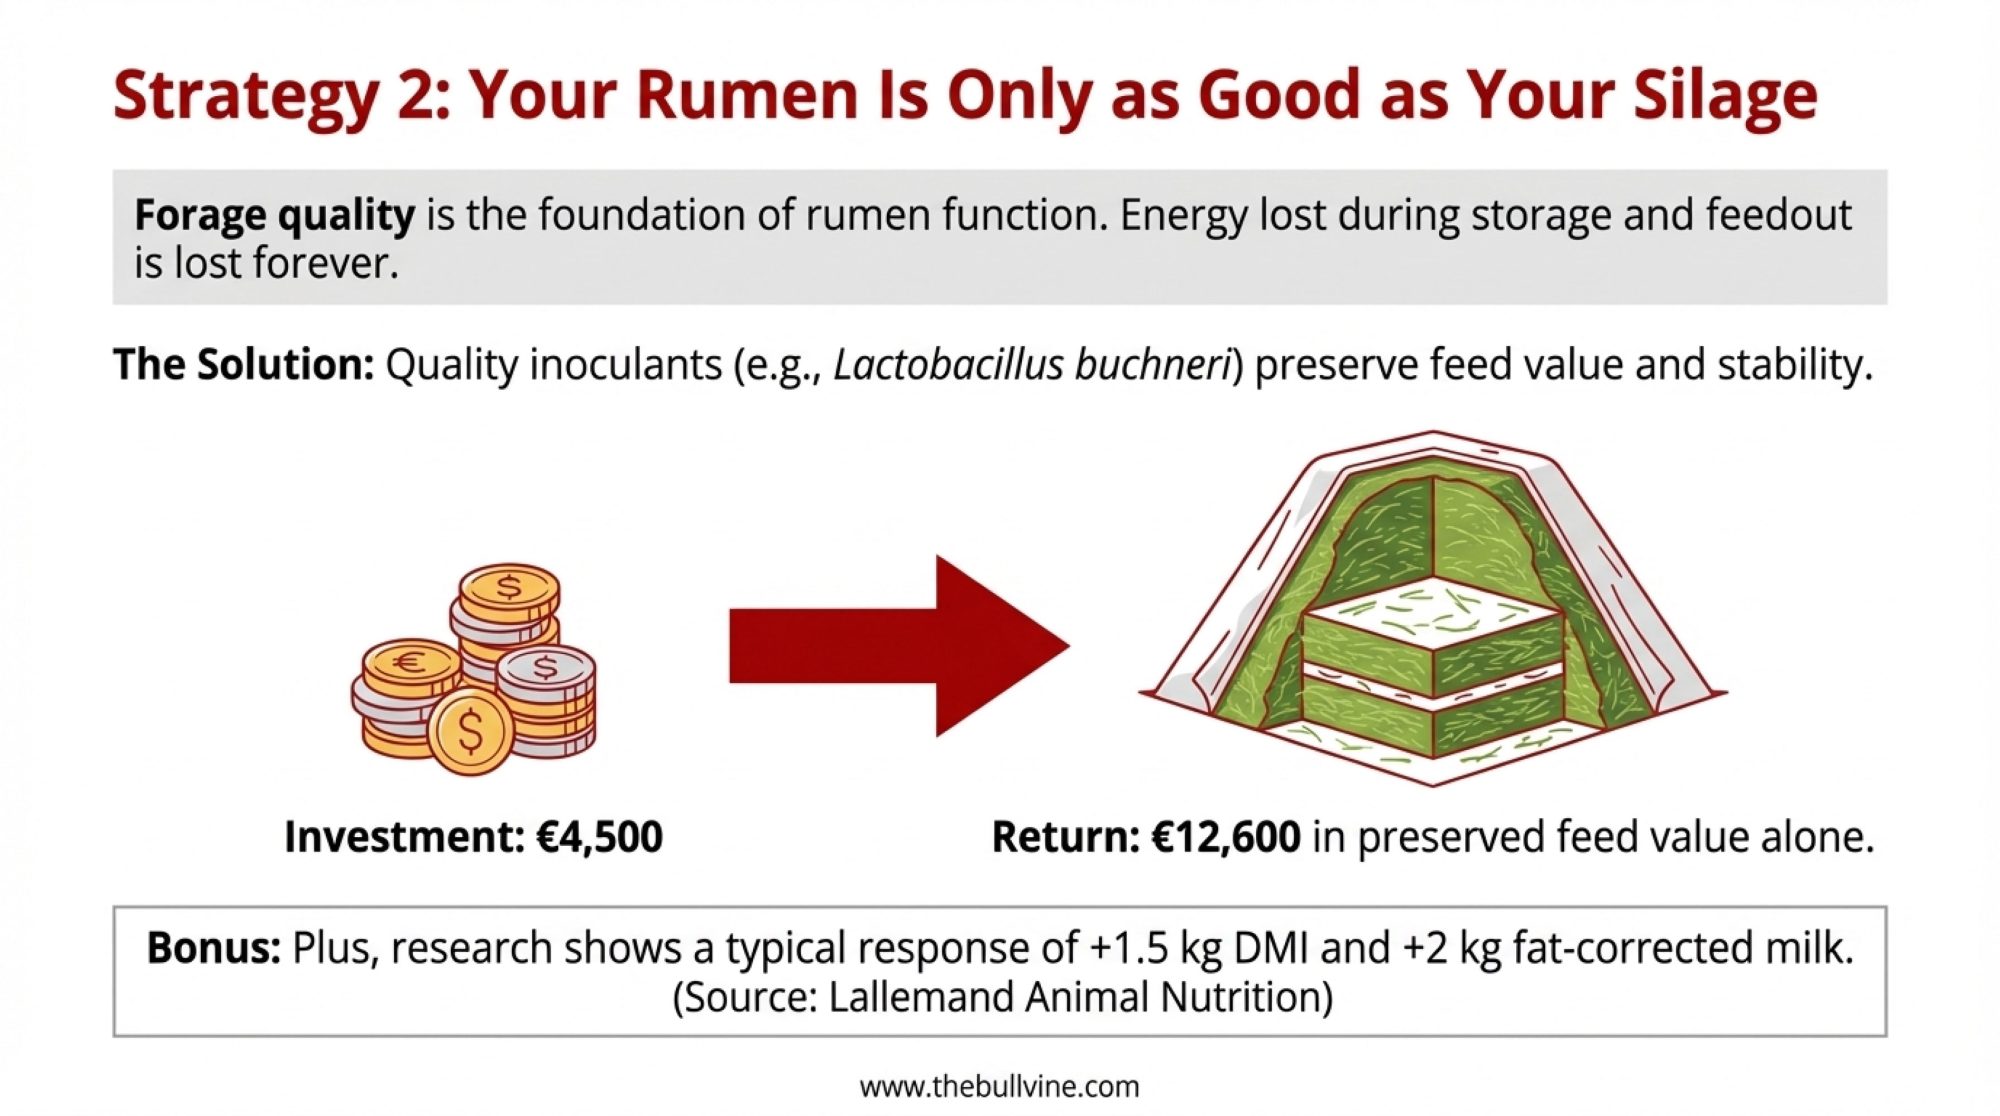
Forage quality determines rumen function potential—and this is where many operations unknowingly leak profit. Luis Queiros from Lallemand Animal Nutrition explains how energy preservation during storage and feedout represents an often-overlooked opportunity.
Quality inoculant technology, incorporating specific bacterial strains like Lactobacillus buchneri and L. hilgardii, delivers measurable benefits. Research consistently demonstrates typical responses of 1.5 kg additional dry matter intake and nearly 2 kg increased fat-corrected milk. Properly treated silage maintains stability for over two weeks after opening, compared to just days for untreated material. The investment math is compelling: €4,500 (~$4,860 USD) in inoculant typically returns €12,600 (~$13,600 USD) in preserved feed value, before accounting for production benefits.
Strategy 3: Metabolic Optimization (The Stress-Efficiency Connection)

Research from Iowa State University’s animal science department, led by Dr. Lance Baumgard and published in the Journal of Dairy Science, demonstrates how metabolic stress fundamentally compromises efficiency. When cows experience heat stress, transition challenges, or subclinical acidosis, gut barrier function deteriorates. This “leaky gut” response triggers immune activation, consuming glucose equivalent to 25-30 liters of milk—energy that could otherwise support milk synthesis.
University of Florida’s dairy science team has quantified the opportunity through heat abatement studies. Operations implementing comprehensive cooling protocols during summer months recovered 8-12% of heat-stress-related efficiency losses. The key insight: stress management isn’t separate from nutrition—it’s foundational to feed conversion.
Cornell University’s transition cow program reinforces this connection. Their research shows that cows experiencing inflammation during the transition period allocate more nutrients to immune function and less to milk production. Targeted interventions—proper close-up nutrition, minimizing social stress, optimizing stocking density—can shift this balance back toward production. Some operations implementing comprehensive transition protocols report efficiency improvements of 0.1-0.2 points within the first 60 days in milk.
Strategic Timing: Why Winter Matters for Measurement
Over years of consulting, I’ve observed that operations that begin efficiency programs in winter consistently achieve superior results compared to those that start in summer. The science supports this pattern.
Winter provides measurement advantages that summer simply can’t match. Housed cattle consuming consistent TMR eliminate the variables inherent in grazing systems. Research from the University of Minnesota demonstrates that TMR-to-pasture transitions can initially reduce intake by nearly 30%, making accurate efficiency calculations challenging during grazing seasons.
Temperature effects matter enormously. When the Temperature Humidity Index exceeds 72, production impacts begin. USDA data from southwestern operations shows average decreases of around 12%, with severe heat causing dramatic drops. Winter measurement reveals true biological capacity rather than heat adaptation.
By mid-winter, silage has stabilized post-fermentation but hasn’t deteriorated. Moisture content remains consistent week to week—essential for calculation accuracy. Plus, without fieldwork pressure, you have bandwidth for careful measurement and analysis. As Dr. Jane Sayers from Northern Ireland’s CAFRE observes, winter provides an opportunity to focus on intake monitoring, which is often overlooked during busier seasons.
Regional Considerations and Operational Realities
Different systems require different approaches—what works for California’s Central Valley operations won’t necessarily translate to Irish grazing systems or Wisconsin tie-stalls.
Pasture-based operations in Ireland, New Zealand, and parts of the Netherlands face unique measurement challenges. Daily efficiency can swing 0.2-0.3 points based on grass quality and weather. These farms benefit from establishing winter baselines during housing, then using those benchmarks to evaluate grazing performance.
Large confined operations in California, Arizona, and emerging markets have measurement consistency advantages but face greater heat stress challenges. These systems often achieve dramatic efficiency gains from metabolic support strategies, particularly during the summer months.
Smaller operations sometimes question whether efficiency improvement justifies investment. The percentage gains remain consistent regardless of scale—a 30-cow herd capturing €8,100 (~$8,750 USD) annually still achieves excellent returns. The key is appropriate implementation: perhaps weekly rather than daily measurement, creative use of existing equipment, and acceptance that progress beats perfection.
Organic producers face intervention restrictions but consistently achieve respectable efficiency through careful forage management and natural fermentation optimization. Several Northeast organic operations report 1.55+ efficiency using approved methods exclusively.
Your 7-Day Efficiency Startup Checklist
Starting efficiency measurement doesn’t require sophisticated infrastructure. Here’s a practical approach using equipment most farms already have:
Day 1: The Weigh-In. Establish your weighing system—a bathroom scale with a bucket works initially. Conduct your first dry matter test using microwave methods validated by extension services. Record pen populations and milk production with components. This is your baseline moment.
Days 2-6: The Data Gather. Continue recording delivered feed from your mixer display, weigh refusals, and test moisture. Calculate daily intake and efficiency while watching for patterns. Don’t chase perfection here—consistency matters more than precision initially. You’re building a habit, not writing a research paper.
Day 7: The Reckoning. Calculate weekly averages by group. Fresh cow efficiency above 1.5 or a herd average below 1.3 warrants immediate consultation with a nutritionist—these indicate intervention needs. This is the number that tells you whether you’re leaving money on the table.
The calculations are straightforward: Dry matter intake equals delivered feed times dry matter percentage, minus refusals times their dry matter percentage, divided by cow count. Energy-corrected milk calculators from Cornell or Penn State handle standardization. Efficiency equals ECM divided by DMI.
Investment Reality and Return Expectations
Transparency about costs builds trust. Based on current market conditions, here’s the realistic investment requirements:
Measurement systems require approximately €3,500 (~$3,780 USD) initially, €2,200 (~$2,375 USD) annually for feed management software, moisture testing equipment, particle separation tools, and scales.
Silage preservation runs €4,500 (~$4,860 USD) annually for inoculant at typical application rates. This investment consistently returns triple value in feed preservation alone, before production benefits.
Transition and metabolic support through quality mineral programs and stress mitigation protocols costs around €3,500 (~$3,780 USD) annually for 100 cows. University research suggests that even modest improvements in transition cow health can recover this investment within the first lactation.
| Investment Category | Year 1 | Ongoing |
| Measurement Systems | €3,500 (~$3,780) | €2,200 (~$2,375) |
| Silage Preservation | €4,500 (~$4,860) | €4,500 (~$4,860) |
| Transition & Metabolic Support | €3,500 (~$3,780) | €3,500 (~$3,780) |
| Total | €11,500 (~$12,420) | €10,200 (~$11,015) |
| Conservative Benefit | — | €20,000-27,000 (~$21,600-29,160) |
| Typical Payback | — | 5-7 months |
Industry Evolution and Future Considerations
The dairy industry faces an interesting crossroads in measuring and reporting efficiency.
Major processors across Europe—Danone, Arla, FrieslandCampina—are incorporating efficiency metrics into sustainability programs and payment structures. While specific program details continue evolving, the direction is clear: efficiency measurement is transitioning from optional to essential.
Carbon market developments offer additional opportunity. Regulatory frameworks in California and Europe are beginning to assign value to efficiency improvements as methane reduction strategies. Operations achieving 1.6+ efficiency may access substantial additional revenue through emerging carbon credit markets.
Within several years, industry observers expect efficiency reporting will become standard for premium market access, sustainability program participation, and competitive financing. Progressive lenders already incorporate these metrics into risk assessment.
Practical Takeaways for Your Operation
The €27,000 annual opportunity exists within your current genetics through management improvement. Unlike genetic selection, requiring years, management delivers returns within months. Each month’s delay represents approximately €2,250 (~$2,430 USD) in foregone benefit.
Starting simple with consistent measurement beats waiting for perfect systems. Basic tools—scale, moisture tester, spreadsheet—combined with two hours weekly effort can generate substantial efficiency gains.
Winter timing provides optimal measurement conditions. January through March offers stable feeding without heat stress or grazing variables, establishing accurate baselines for year-round improvement.
Sequential implementation maximizes success. Begin with a measurement to understand current performance. Address forage quality to secure your input foundation. Then optimize metabolic health through evidence-based transition protocols. Each phase builds on previous improvements.
The 1.5 efficiency threshold separates sustainable from struggling operations. Below 1.3 indicates a crisis requiring immediate attention. Above 1.5 provides a foundation for optimization toward 1.6+ targets where premium opportunities emerge.
As one experienced consultant observed: “Weekly efficiency calculation drives profitable decisions. Annual calculation generates excuses. Never calculating ensures slow decline without understanding why.”

KEY TAKEAWAYS
- €281 per cow. €27,000 per herd. Every year. Moving from 1.4 to 1.6 efficiency captures this without new genetics, additional cows, or capital investment. It’s management money—yours to take or leave.
- Fresh cows above 1.5 efficiency aren’t stars—they’re sirens. High early efficiency signals dangerous mobilization of body reserves, not superior genetics. These cows are heading for ketosis. Monitor them; don’t celebrate them.
- Three strategies. One system. No shortcuts. Measurement reveals your baseline. Silage preservation protects your inputs. Metabolic optimization unlocks conversion. Skip one, and the others underdeliver.
- Winter 2025-2026 is your measurement window—use it. Housed cattle, stable rations, no heat stress skewing numbers. January through March gives you the cleanest baseline you’ll get all year.
- The barrier to €27,000? Seven days and a bathroom scale. Add a microwave for moisture testing and a spreadsheet. That’s it. Start this week. Stop guessing. Start weighing.

The Bullvine Bottom Line
You can’t deposit milk production; you deposit margin. Genetic potential means nothing if your conversion is poor. For the cost of a bathroom scale and a moisture tester, you can unlock €27,000 (~$29,000 USD) in hidden value this winter. Stop guessing and start weighing.
Complete references and supporting documentation are available upon request by contacting the editorial team at editor@thebullvine.com.
Complete references and supporting documentation are available upon request by contacting the editorial team at editor@thebullvine.com.
Learn More:
- The $150,000 Silage Gamble: Why Your “Good Enough” Approach Is Killing Your Dairy – Reveals specific protocols for kernel processing, packing density, and face management that prevent invisible shrink losses. Essential reading for producers wanting to secure the feed investment foundation mentioned in Strategy 2.
- The 90-Day Dairy Pivot: Converting Beef Windfalls into Next Year’s Survival – Provides a financial blueprint for navigating high breakeven thresholds through component premiums and culling strategies. Demonstrates how to protect the margins you capture through efficiency gains.
- The $700 Truth: Your Best Milkers Are Your Worst Investment – challenges traditional production metrics with new data from 3,000 herds, proving that high-volume cows often hide poor conversion ratios. Offers a data-driven approach to identifying true herd profitability stars.
 The Sunday Read Dairy Professionals Don’t Skip.
 The Sunday Read Dairy Professionals Don’t Skip.
Every week, thousands of producers, breeders, and industry insiders open Bullvine Weekly for genetics insights, market shifts, and profit strategies they won’t find anywhere else. One email. Five minutes. Smarter decisions all week.


