


US dairy production has changed substantially in the past two decades. Milk production has increased as both the number of dairy cows and the milk yield per cow in the US has grown. In this article, we break down production trends in US dairy. Production gains in the past two decades are the result of markedly different growth strategies across regions. We consider what these regional growth trends mean for future dairy production decisions.
Our analysis focuses on the fifteen states with the most dairy cows. We distinguish between “traditional” dairy states with small herd sizes and a long history of dairy production and “modern” dairy states with large herds where the dairy sector has only recently reached its current scale. While each region comprises a roughly equal share of total US milk production, traditional and modern dairy states have grown in very different ways. Most production growth in traditional dairy states comes from rising milk yield. Modern dairy states have grown production by increasing both milk yield and the total number of cows.
As US dairy cow numbers have started to level off, it is possible that there are limits on how much the total US herd can grow. Constraints on the scale of dairy production may have hit dairy farms in traditional dairy states first, leading those farms to focus on growing yield through improvement in management and genetics. This trend may play out in modern dairy states in coming years.
The Location of US Milk Production
Our data on state-level milk production comes from the USDA National Agricultural Statistics Service Milk Production survey which measures milk production, cow numbers, and milk yield by state each month. Milk production is seasonal and this seasonality varies across regions, so we present data at annual frequency. NASS also collects data on the number of dairy farms which allows us to calculate average herd size. Figure 1 highlights the location of the top 15 dairy states by number of dairy cows. States where the average herd size is less than 500 cows are shown in blue, and those with more than 500 cows per herd are in orange. The locational contrast is stark; states with small herds are entirely in the Midwest and Northeast. In contrast, dairy states in the West all have substantially larger herds with nearly all having an average herd size above 1,000 cows.
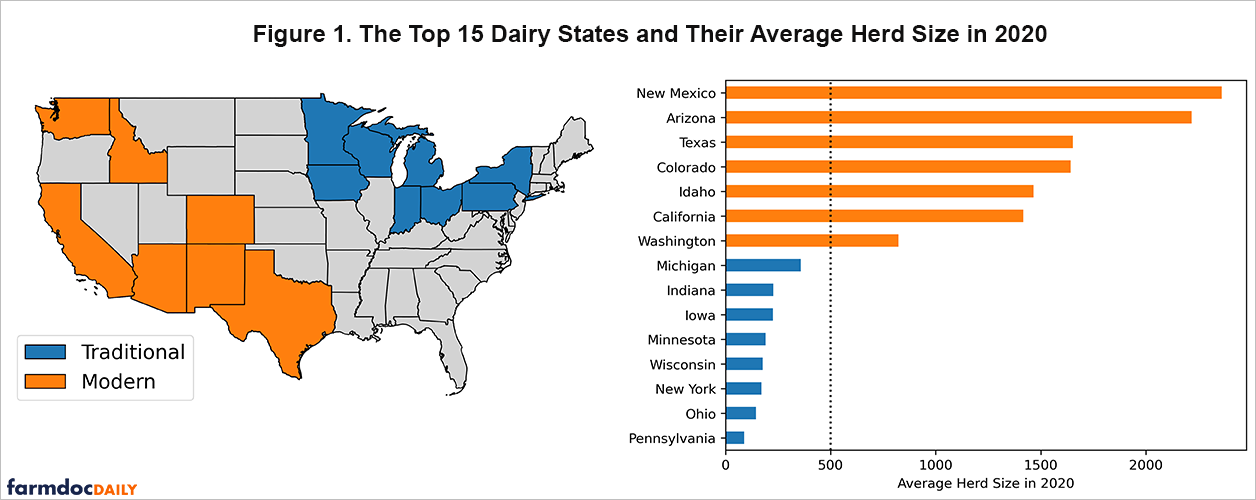
Dairy farming has a long history in the Midwest and Northeast because dairy production tended to be located in cooler climates, whereas dairy farming in relatively hot and arid states is a more recent phenomenon. For this reason, we term the small-herd, Midwest and Northeast dairy producing states in Figure 1 as “traditional” and the large-herd, Western states as “modern”.
Trends in Cow Numbers
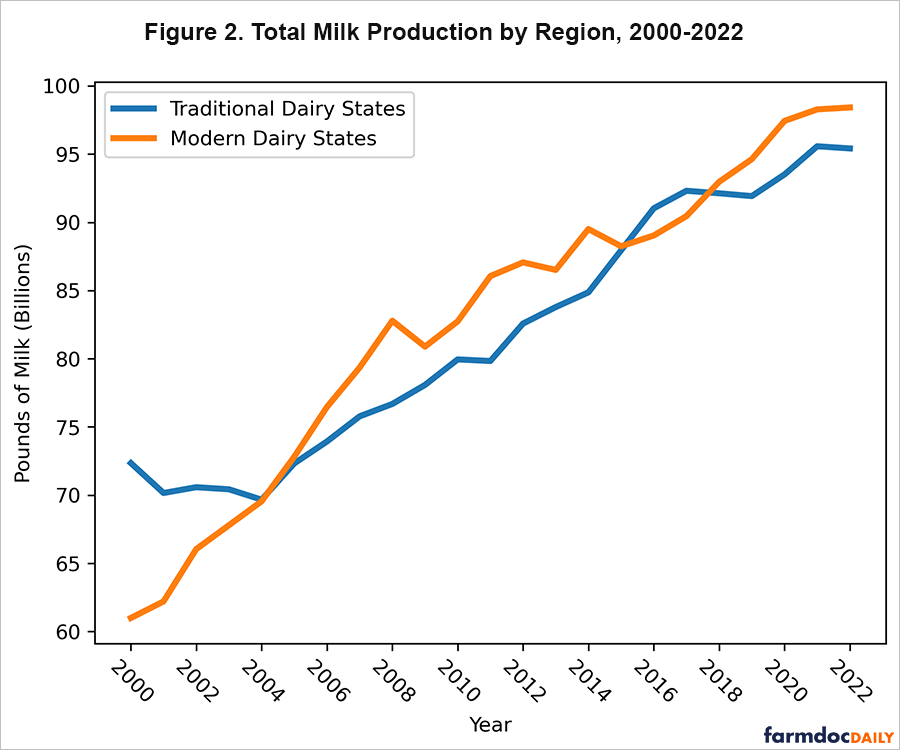
Traditional and modern dairy states have in the past decade contributed roughly the same amount to aggregate annual US production as shown in Figure 2. Rapid production growth in modern states led their output to exceed traditional states in 2004. However, recent growth trends appear roughly similar across regions.
How are these two different milk-producing regions increasing production? Figure 3 shows the total number of dairy cows by region. Until 2008, modern dairy states were adding cows at a rapid rate even as traditional dairy states were losing them. After 2008, the growth trend in cow numbers in modern dairy states slowed considerably and, in some years, has shown small declines. However, growing numbers of cows is still a major reason for production growth in modern dairy states.

Cow numbers have been comparatively stagnant in traditional dairy states. The dairy cow herd there stopped declining in 2004 and has since only increased slightly increased before declining again in 2018. Both regions have had low growth in cow numbers in the past two years, though in 2020 the number of cows in modern dairy states was higher than traditional dairy states for the first time.
Trends in Milk Yield
Milk yield (in pounds per cow) is the other component of production growth. Dairy farms may increase milk yield by adopting better management practices and/or purchasing improved genetics. Throughout our sample period, large-scale production in modern dairy states had higher milk yield than traditional states: 1,721 pounds per cow versus 1,473 in 2000. By 2022, the yield gap between modern and traditional states narrowed to less than 100 pounds: 2,070 pounds per cow versus 1,984 pounds per cow.
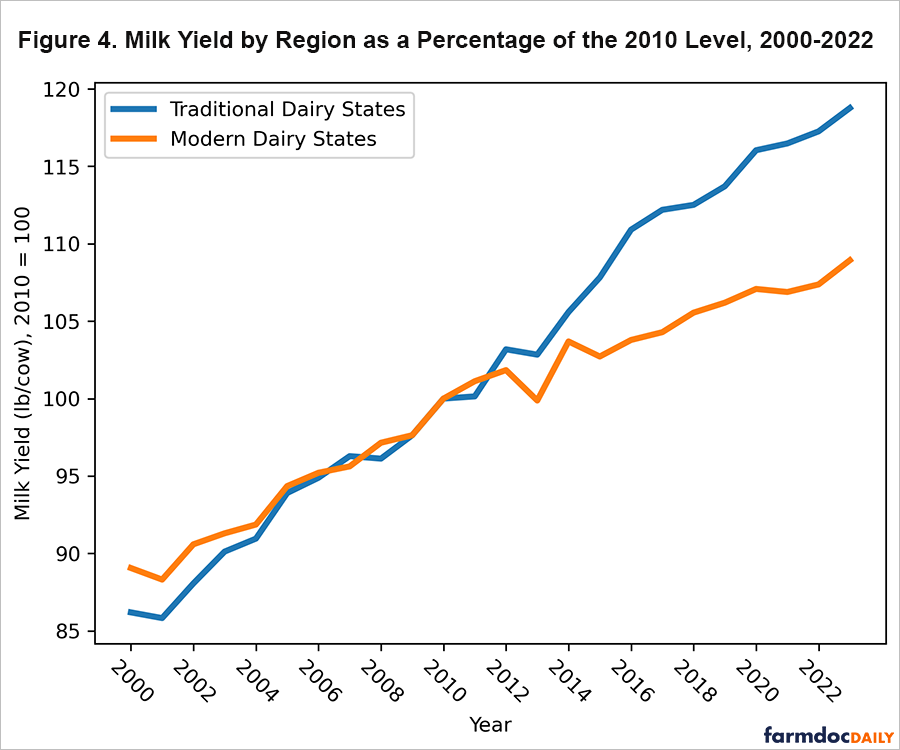
Traditional dairy state milk yield began to catch up to modern dairy states after 2010. Figure 4 shows regional yield trends over time normalized so the level in 2010 is equal across regions. While yield growth prior to 2010 was roughly the same in both regions, traditional states have increased milk yield about 18% since 2010, compared to just 8% growth in modern dairy states. This change in relative yield growth happens to coincide with an increase in the genetic milk yield potential of dairy bulls due to the introduction of genomic testing (See: Geiger, 2022 and Cole, et al, 2023). While traditional dairy states have not added as many cows as modern dairy states, they have kept pace with the West by increasing milk yield at a faster rate. Traditional state yields appear to be converging to that of the modern states, implying that they are either tapping into a new source of yield growth or simply catching up by adopting improvements of the modern dairy states.
Declining Farm Numbers and Average Herd Size
Dairy regions have also diverged in terms of changes in average herd size. All fifteen states have seen increases in average herd size since 2003 but dairy farm consolidation has led to faster growth in average herd size in traditional dairy states. In traditional dairy states, herd size growth has been almost entirely driven by decreases in the number of farms (as total cow numbers have been stable). From 2014 to 2022, the number of farms dropped by 37% in traditional states and 26% in modern dairy states.
Figure 5 shows the rate of average herd size growth diverging between the two regions since 2014. Traditional dairy states have almost tripled their average herd size in twenty years while modern dairy state herd size is a little over double what it was in 2003. While herd size remains much larger in modern states than traditional ones, dairy farm consolidation in traditional states has shrunk the gap slightly over time.

Discussion
What explains the divergence between traditional and modern dairy-producing regions in terms of cow numbers and milk yield? One possibility is that traditional dairy states are investing less in growing their cow numbers and more in better management, enhanced milking technology, and more productive genetics. The fact that milk yield in traditional states grew more rapidly after the introduction of genomic testing in dairy genetics suggests that genetics may have played a role in the observed yield increase. It is also possible that, due to zoning and environmental regulations, traditional dairy states are simply more limited in their ability to grow cow numbers. Having exhausted their ability to grow production through cow numbers, they are instead turning to improving yield. This mirrors a larger trend in US crop production where output growth is driven mostly through productivity gains rather than putting more acres into production.
Since 2020, there has been heightened concern about the resiliency of dairy supply chains (See: Bauer, 2022) and even talk of supply management (See Frericks, 2017 and Natzke, 2018). In the past two years, cow numbers have begun to level off, perhaps reacting to uncertainty the ability and willingness of the supply chain to continue to accept the volume of milk that it does. It may also be that the total number of dairy cows in the country is reaching a long-run, stable level. This is especially the case if zoning and environmental regulation prevent modern dairy states from expanding cow numbers as they have in the past two decades. If growth in the US dairy herd does level off, we may even see modern dairy states follow the lead of the traditional states and drive growth through yield improvement rather than more cows.
YouTube Video: Discussion associated with this article at
References
Bauer, Abby. “Working through the supply chain woes.” Hoard’s Dairyman, July 4, 2022. https://hoards.com/article-32164-working-through-the-supply-chain-woes.html
Cole, John B., Bayode O. Makanjuola, Christina M. Rochus, Nienke van Staaveren, Christine Baes. “The effects of breeding and selection on lactation in dairy cattle.” Animal Frontiers, Volume 13, Issue 3, June 2023, Pages 62–70, https://doi.org/10.1093/af/vfad044
Frericks, Sadie. “U.S. dairy needs supply management…” Hoard’s Dairyman, April 25, 2017. https://hoards.com/blog-20856-us-dairy-needs-supply-management—.html
Geiger, Corey. “What’s driving record milk component levels?” Hoard’s Dairyman, June 7, 2022. https://hoards.com/article-32067-whats-driving-record-milk-component-levels.html
Natzke, Dave. “Dairy Summit finds support for milk supply management.” Progressive Dairy, September 11, 2018. https://www.agproud.com/articles/21600-dairy-summit-finds-support-for-milk-supply-management


