


Milk at $18. Butter at $1.50. But heifers at $3,200 tell the real story. The recovery’s already starting—if you know where to look.
EXECUTIVE SUMMARY: A Wisconsin dairy producer’s confession reveals the new reality: “I watch New Zealand milk production closer than my own bulk tank.” While traditional metrics show disaster—butter at $1.50, milk under $18, three forward signals are flashing a recovery 3-4 months out. Weekly dairy slaughter remains at historic lows (230k vs. 260k trigger) because $900-$1,600 crossbred calves are keeping farms afloat, breaking the normal correction cycle. Smart operators monitoring Global Dairy Trade auctions and $230/cwt cattle futures have already locked in $4.38 corn, gaining $1.20/cwt margin advantage over those waiting for Class III improvements. With heifer inventories at 40-year lows (3.914 million head), operations that went heavy on beef-on-dairy face a cruel irony: they survived the crash but can’t expand in recovery. The next 18 months won’t reward efficient production—they’ll reward those watching the right signals.

Last week, a Wisconsin producer told me something that stopped me in my tracks: “I’m watching New Zealand milk production closer than my own bulk tank readings.”
That conversation captures perfectly how dairy economics have shifted. And looking at Monday’s CME spot prices—butter hitting $1.50 a pound, lowest we’ve seen since early 2021—alongside December cattle futures losing nearly twenty bucks per hundredweight over the past couple weeks, you can see why traditional metrics aren’t telling the whole story anymore.
Here’s what’s interesting, folks… while everyone’s fixated on Class III and IV prices that essentially report yesterday’s news, there are actually three specific signals providing genuine forward-looking intelligence. I’ve been tracking these with producers across the country for the past year, and what I’ve found is that the patterns could determine which operations thrive during this transition period.
AT A GLANCE: Your Three Critical Market Signals

📊 Signal #1: Weekly dairy cow slaughter exceeding prior year by 8-10% for three consecutive weeks
📈 Signal #2: GDT auctions showing 6-8% cumulative gains over four consecutive sales
📉 Signal #3: December cattle futures 30-day moving average crossing above 200-day at $230+/cwt
The Perfect Storm We’re Navigating Together
You’ve probably noticed this already, but what we’re experiencing isn’t your typical dairy cycle. It’s more like… well, imagine several weather systems colliding simultaneously, each amplifying the others in ways most of us haven’t seen before.
The Production Surge
So here’s what the USDA data shows—milk production increased 3.5% through July, and those butterfat tests? Katie Burgess over at Ever.Ag called them “somewhat unbelievable” in her recent market analysis, and honestly, she’s spot on. I’m seeing consistent test results of 4.2% butterfat, even 4.3%, across multiple regions—Wisconsin operations, Pennsylvania farms, and even out in California—when just two years ago, 3.9% was considered excellent.
You know what’s happening here, right? We’re all getting better at managing transition periods, feeding programs are more precise, genetics keep improving… but when everyone’s achieving similar improvements simultaneously, well, the market gets saturated. And that’s exactly what we’re seeing.
Global Supply Pressure
The Global Dairy Trade auction has declined for three straight months now, and that’s coinciding with European production recovering—you can see it in the Commission’s September data—and Fonterra announcing that massive 6.3% surge in September collections. When major exporters increase production simultaneously like this… friends, you know what happens to prices.
Domestic Demand Challenges
Meanwhile, domestic demand faces unprecedented pressure. Those SNAP benefit adjustments affecting 42 million Americans? They’re creating ripple effects throughout the retail sector. Food banks across Iowa are reporting demand increases of ten to twelve times normal—I mean, the Oskaloosa facility went from distributing 300-400 pounds typically to nearly 5,000 pounds in the same timeframe. That’s not sustainable.
A Lancaster County producer managing 750 Holsteins shared an interesting perspective with me recently:
“Component payments help, sure, but when everyone’s achieving similar improvements, the market gets saturated. And those fluid premiums we used to count on? They’re basically evaporating as processors shift toward manufacturing.”
The Broken Feedback Loop
Here’s what really caught me off guard, though—that traditional feedback loop where low prices trigger culling, which reduces supply and brings markets back? It’s broken.
With crossbred calves commanding anywhere from $900 to $1,600 at regional auctions—and I’m seeing this from Pennsylvania clear through to Minnesota based on the USDA-AMS reports—compared to maybe $350-$400 back in 2018-2019, that additional beef revenue is keeping operations afloat despite negative milk margins.

Three Dairy Market Signals Worth Your Morning Coffee
📊 SIGNAL #1: Weekly Dairy Cow Slaughter Patterns
When: Every Thursday at 3:00 PM Eastern
Where: USDA Livestock Slaughter report at usda.gov
Time Required: 5 minutes
What’s fascinating is the consistency here—dairy cow culling has run below prior-year levels for 94 out of 101 weeks through July, according to USDA’s cumulative statistics. Year-to-date culling? It’s the lowest seven-month figure since 2008, and we’ve got a much bigger national herd now.
🎯 THE KEY THRESHOLD:
Three consecutive weeks where slaughter exceeds prior-year levels by 8-10% or more
When weekly figures rise from the current 225,000-230,000 head range toward 260,000-270,000 head, that signals crossbred calf values have finally declined below that critical $900-$1,000 level where they no longer offset weak milk margins.
💡 WHY IT MATTERS:
A 600-cow operation near Eau Claire started monitoring these signals back in March, locked in feed when they saw the pattern developing, and improved margins by $1.20/cwt compared to neighbors who waited. That’s real money, folks.
📈 SIGNAL #2: Global Dairy Trade Auction Trends
When: Every two weeks, Tuesday evenings, our time
Where: globaldairytrade.info (free access)
Time Required: 15 minutes
I’ll be honest with you—for years, I ignored these New Zealand-based auctions, thinking they were too far removed from Midwest realities. That was an expensive mistake.
🎯 THE KEY THRESHOLD:
Four consecutive auctions showing cumulative gains of 6-8% or higher, with whole milk powder exceeding $3,400/MT
Katie Burgess explains it well: “GDT auction results in New Zealand influence U.S. milk powder pricing dynamics.” And the correlation is remarkably consistent—GDT movements typically show up in CME spot markets within two to four weeks.
💡 INSIDER PERSPECTIVE:
A Midwest cooperative CEO recently shared this with me—can’t name the co-op for competitive reasons—but he said: “We’ve integrated GDT trends into our pooling strategies. Sustained upward movement there typically translates to improved export opportunities within 30-45 days.”
📉 SIGNAL #3: Cattle Futures Technical Analysis
When: Daily monitoring
Where: Any free futures charting platform
Time Required: 5 minutes daily
With the National Association of Animal Breeders data showing 40-45% of dairy pregnancies now utilizing beef sires, and those calves generating 20-25% of total farm revenue, cattle market volatility directly impacts our cash flow.
🎯 THE KEY THRESHOLD:
30-day moving average crossing above 200-day moving average while December futures maintain above $230/cwt
Recent movements illustrate the impact perfectly—when cattle prices dropped in October, crossbred calf values fell by $200-$250 per head. For a 1,500-cow operation with 40% beef breeding, that’s substantial revenue reduction… we’re talking six figures of annual impact.
💡 PRO TIP:
If you’re just starting to track these signals, give yourself a full month to establish baseline patterns before making major decisions based on them. As many of us have learned, knee-jerk reactions rarely pay off.
Quick Reference: Your Market Monitoring Dashboard
MONDAY MORNING (10 minutes over coffee)
✓ Check Friday’s CME spot dairy prices
✓ Review cattle futures five-day trends
✓ Update 90-day cash flow projections
THURSDAY AFTERNOON (5 minutes)
✓ Access USDA slaughter report (3 PM ET)
✓ Calculate 4-week moving average vs. prior year
✓ Note trend acceleration or deceleration
BIWEEKLY GDT DAYS (15 minutes)
✓ Monitor GDT Price Index and whole milk powder
✓ Calculate 3-auction cumulative change
✓ Compare with NZ production reports
MONTHLY DEEP DIVE (worth the hour)
✓ USDA Cold Storage report analysis
✓ Regional milk production review
✓ Update beef-on-dairy calf values
✓ Calculate actual production cost/cwt
✓ Evaluate 2:1 current ratio benchmark
Understanding the Structural Shifts Reshaping Our Industry
The Heifer Shortage: By the Numbers
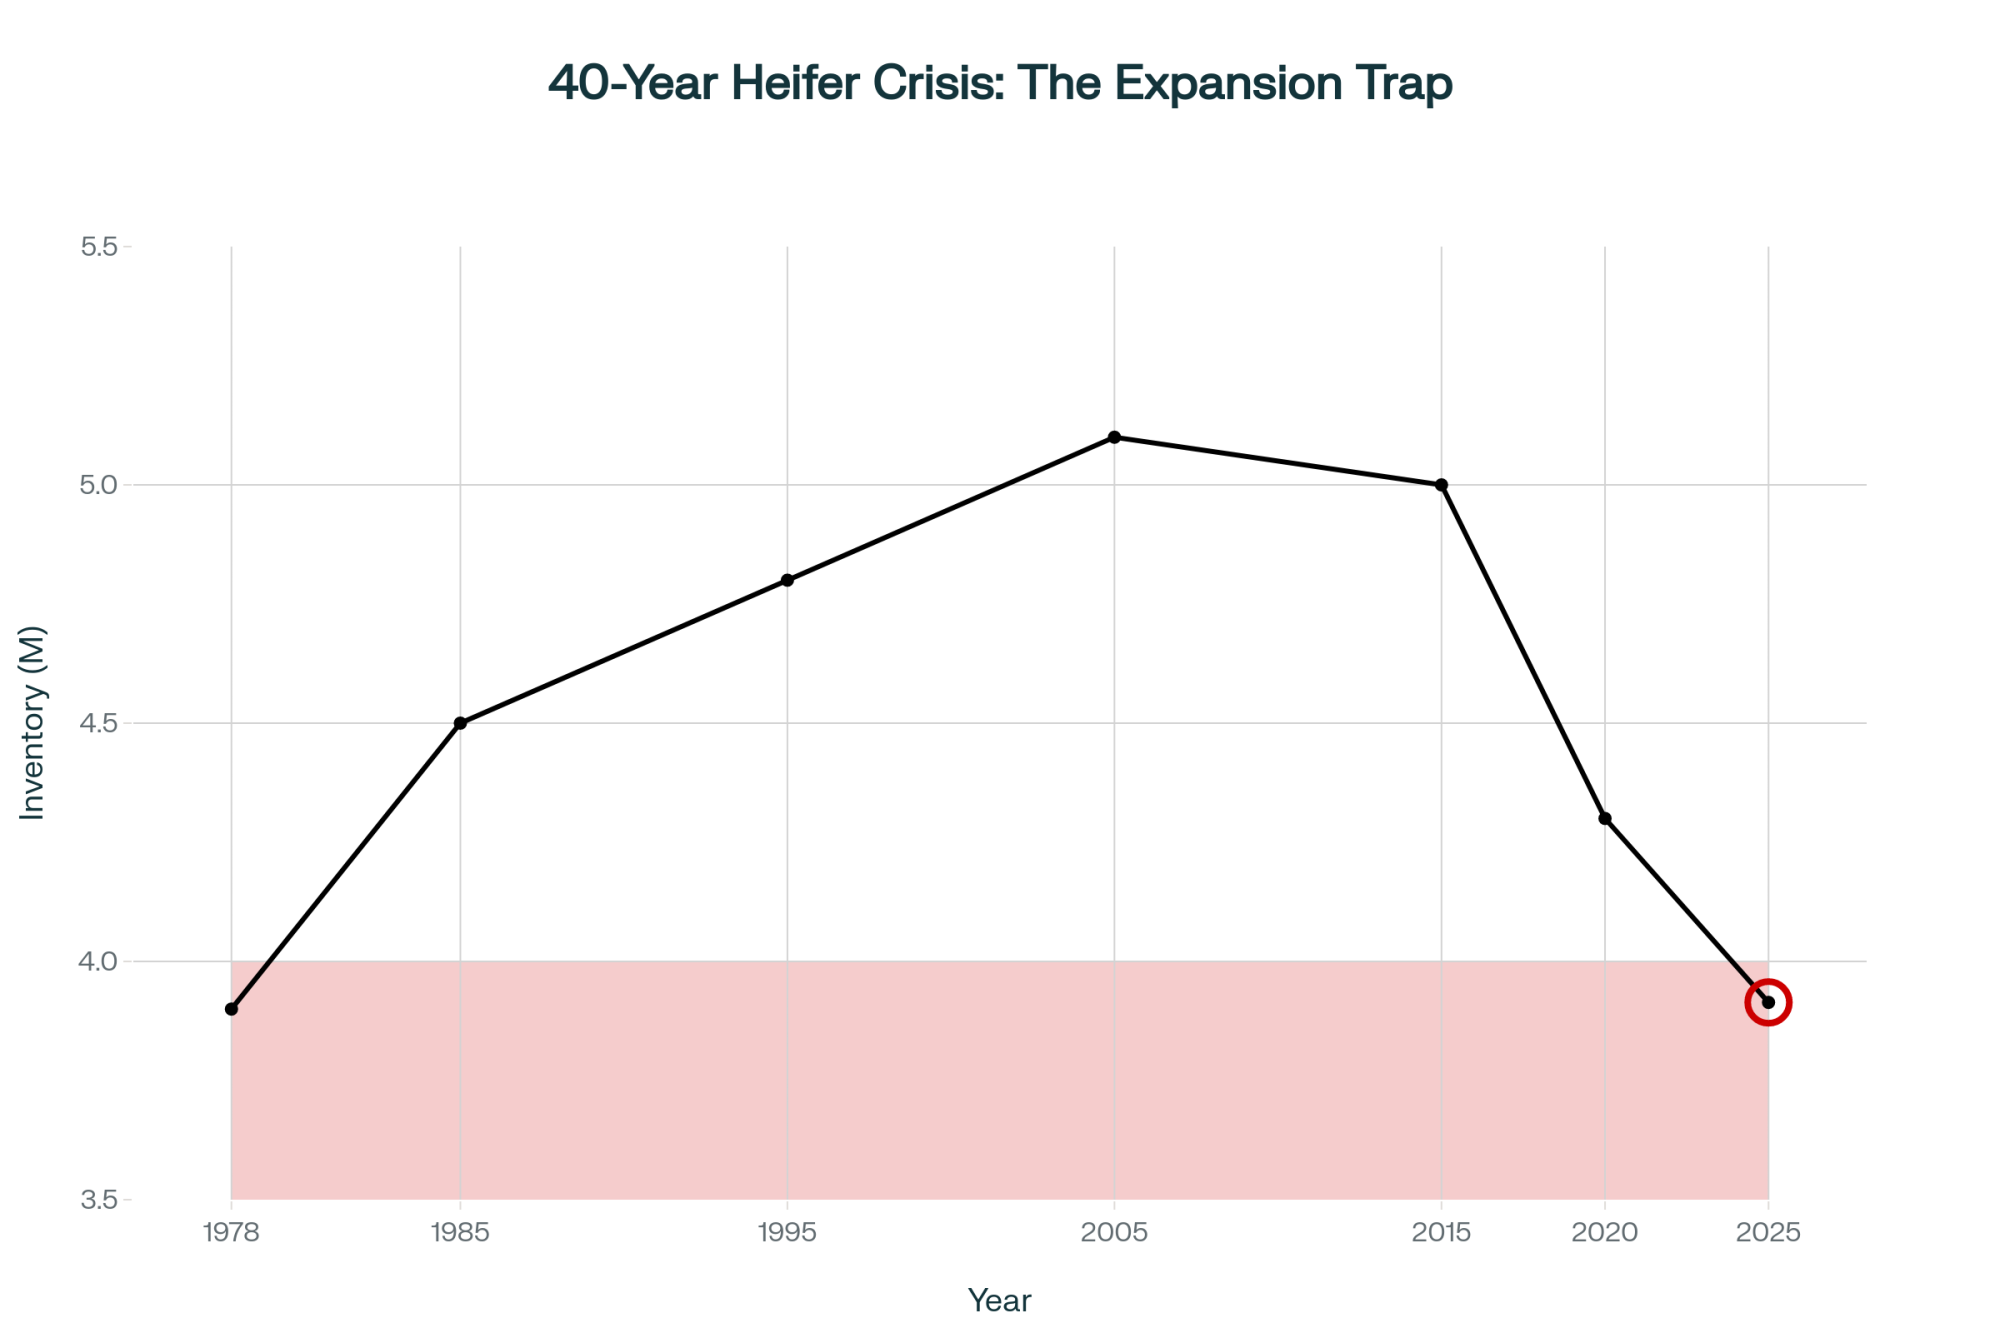
You know, CoBank’s August dairy report really opened some eyes—they’re projecting an 800,000 head decline in heifer inventories through 2026. And the January USDA Cattle inventory confirmed we’re at just 3.914 million dairy heifersover 500 pounds. That’s the lowest since 1978, folks.
Current Reality:
- $3,200 current bred heifer cost (compared to $1,400 three years ago)
- Wisconsin actually added 10,000 head
- Kansas dropped 35,000 head
- Idaho lost 30,000 head
- Texas shed 10,000 head
A Tulare County producer summed it up perfectly when he told me: “The irony is crushing—beef-on-dairy revenue helped us survive the downturn, but now expansion is virtually impossible without heifers.”
SNAP Impact: The Ripple Effect
When those 42 million Americans saw their SNAP benefits cut from $750 to $375 for a family of four… the impact on dairy demand was immediate and, honestly, worse than I expected.
The Numbers:
- 50% benefit reduction starting November 1st
- 10-15% reduction in retail dairy orders within the first week
- 1.4-1.6 billion pounds milk equivalent annual impact
Andrew Novakovic from Cornell’s Dyson School—he’s been studying dairy economics for decades—offers crucial context: “Dairy products often see early reductions when household budgets tighten. Unfortunately, many consumers categorize dairy as discretionary when financial pressures mount.”
Global Dynamics: The New Reality
Twenty years ago, friends, U.S. dairy prices were mostly about what happened between California and Wisconsin. Today? With 16-18% of our production going to export markets, what happens in Wellington, Brussels, and Beijing matters just as much.
Key Production Increases:
- Ireland’s up 7.6% year-to-date through May
- Poland’s share grew from 1.9% to 3.9% of EU production over five years
- New Zealand hit four consecutive monthly records through September
- China’s now 85% self-sufficient, up from 70%
Ben Laine over at Rabobank explained it well: “When major exporters increase production simultaneously while China requires fewer imports, prices have to adjust globally. These signals reach U.S. farms within weeks, not months.”
Action Plans by Operation Type
📗 For Growth-Oriented Operations
Genomic Testing ROI:
I’ll admit, spending $45 per calf for genomic testing when milk prices are in the tank seems counterintuitive. But here’s the math that convinced me:
- Test 300 heifer calves at $45 each: $13,500
- Apply sexed semen to top 120 at $27 extra per breeding: $3,240
- Generate 80-100 surplus heifers worth $3,200-$3,500 each: $280,000+
- Your ROI? About 16 to 1
University dairy economics programs have validated these projections, and frankly, those numbers work in any market.
Risk Management Stack:
You can’t rely on DMC alone—it hasn’t triggered meaningful payments in over a year according to FSA records. Smart operators are layering:
- DMC at $9.50: ~$0.15/cwt for first 5 million pounds
- DRP at 75-85%: Premiums run 2-3% of protected value
- Forward contracts: 30-40% when you see $19+/cwt
📘 For Transition Candidates
Three Proven Paths:
- Collaborative LLC: Three farms near Fond du Lac reduced per-cow investment from $8,000 to $3,200 by sharing infrastructure
- Premium Markets: A2 can bring a $4/cwt premium; organic runs $20/cwt over conventional if you can secure a buyer first
- Strategic Exit: You preserve 80-85% of equity in a planned transition versus maybe 50% in distressed liquidation
📙 For Next Generation
If you’re under 30 and considering this industry, you need to know it’s fundamentally different from what your parents knew. University programs like Wisconsin’s Center for Dairy Profitability and Cornell’s PRO-DAIRY are developing specific resources for younger producers navigating this new environment. Use them.
Regional Snapshot: Your Competition and Opportunities
Southwest: Water costs are doubling in some areas. One Albuquerque producer told me they’re making daily tradeoffs between feed production and maintaining adequate water for the herd.
Northeast: Those fluid premiums we used to count on? They’ve compressed from $2-3/cwt down to $0.50-1.00 in many months.
Pacific Northwest: Urban pressure near Seattle and Portland—plus down in Salem—has reduced available land by 30% in five years for some operations. A Yakima producer told me they’re now focusing entirely on efficiency rather than expansion.
Upper Midwest: Generally best positioned with those heifer additions and relatively stable production costs. Wisconsin operations, particularly, are seeing benefits from their heifer inventory decisions.
The Path Forward: Your 18-Month Strategy
You know, a Turlock-area veteran told me something last week that really stuck: “We’ve shifted from watching weather and milk prices to monitoring New Zealand production and Argentine beef policy. This isn’t the dairy farming of previous generations, but it’s our evolving reality.”
The coming 18 months will challenge all of us, yet patterns remain identifiable for those watching. Markets will recover—they always do—but the question is whether your operation will be positioned to benefit from that recovery.
Looking at this trend, farmers are finding that appropriate signal monitoring, combined with decisive action, makes the difference. Your operation deserves strategic planning beyond hoping for better prices. And with the right approach, achieving better outcomes remains entirely possible.
Because at the end of the day, friends, as many of us have learned, success in modern dairy isn’t just about producing quality milk anymore. It’s about understanding global dynamics, managing risk intelligently, and making informed decisions based on forward-looking indicators rather than yesterday’s prices.
The tools are there. The signals are clear. What we do with them over the next 18 months will determine who’s still farming when this cycle turns—and it will turn. It always does.
KEY TAKEAWAYS:
- Monitor three signals, not milk prices: Weekly slaughter approaching 260k (currently 230k), GDT auctions gaining 6-8% over four sales, and cattle futures holding above $230/cwt predict recovery 3-4 months before Class III moves
- The correction isn’t coming—it’s different this time: Crossbred calves at $900-$1,600 create a revenue floor keeping marginal operations alive, breaking the traditional supply response to low milk prices
- First movers are winning now: Operations tracking these signals have locked in $4.38/bushel corn and gained $1.20/cwt margins while others wait for “normal” price recovery that follows different rules
- The heifer shortage trap: At 3.914 million head (lowest since 1978), expansion is mathematically impossible for most—even when milk hits $22, you can’t grow without $3,200 heifers
- Your 18-month edge: Implement Monday morning CME checks, Thursday slaughter monitoring, and biweekly GDT tracking—15 minutes weekly that separates thrivers from survivors
Complete references and supporting documentation are available upon request by contacting the editorial team at editor@thebullvine.com.
Learn More:
- Building a Beef-on-Dairy System: Capturing $360,000 in Annual Farm Profit – Reveals how beef-on-dairy breeding jumped from 50K to 3.2M head and demonstrates methods for capturing 6% of total farm income through crossbred calves, directly addressing the $900-$1,600 calf values sustaining operations through negative milk margins.
- Trump Promised Cheaper Beef – Here’s Your $160,000 Counter-Move – Provides contrarian strategies for producers considering heifer production when others focus on beef breeding, perfectly aligning with the heifer shortage trap at 3.914 million head and offering a profitable alternative path during market transitions.
- Pick Your Lane or Perish: The 18-Month Ultimatum Facing 800-1,500 Cow Dairies – Explores October’s $2.47 Class spread proving mid-size dairies must choose between commodity and premium markets, offering strategic frameworks that complement the three-signal monitoring system for operations navigating the “middle ground is gone” reality.
 Join the Revolution!
 Join the Revolution!
Join over 30,000 successful dairy professionals who rely on Bullvine Weekly for their competitive edge. Delivered directly to your inbox each week, our exclusive industry insights help you make smarter decisions while saving precious hours every week. Never miss critical updates on milk production trends, breakthrough technologies, and profit-boosting strategies that top producers are already implementing. Subscribe now to transform your dairy operation’s efficiency and profitability—your future success is just one click away.


