


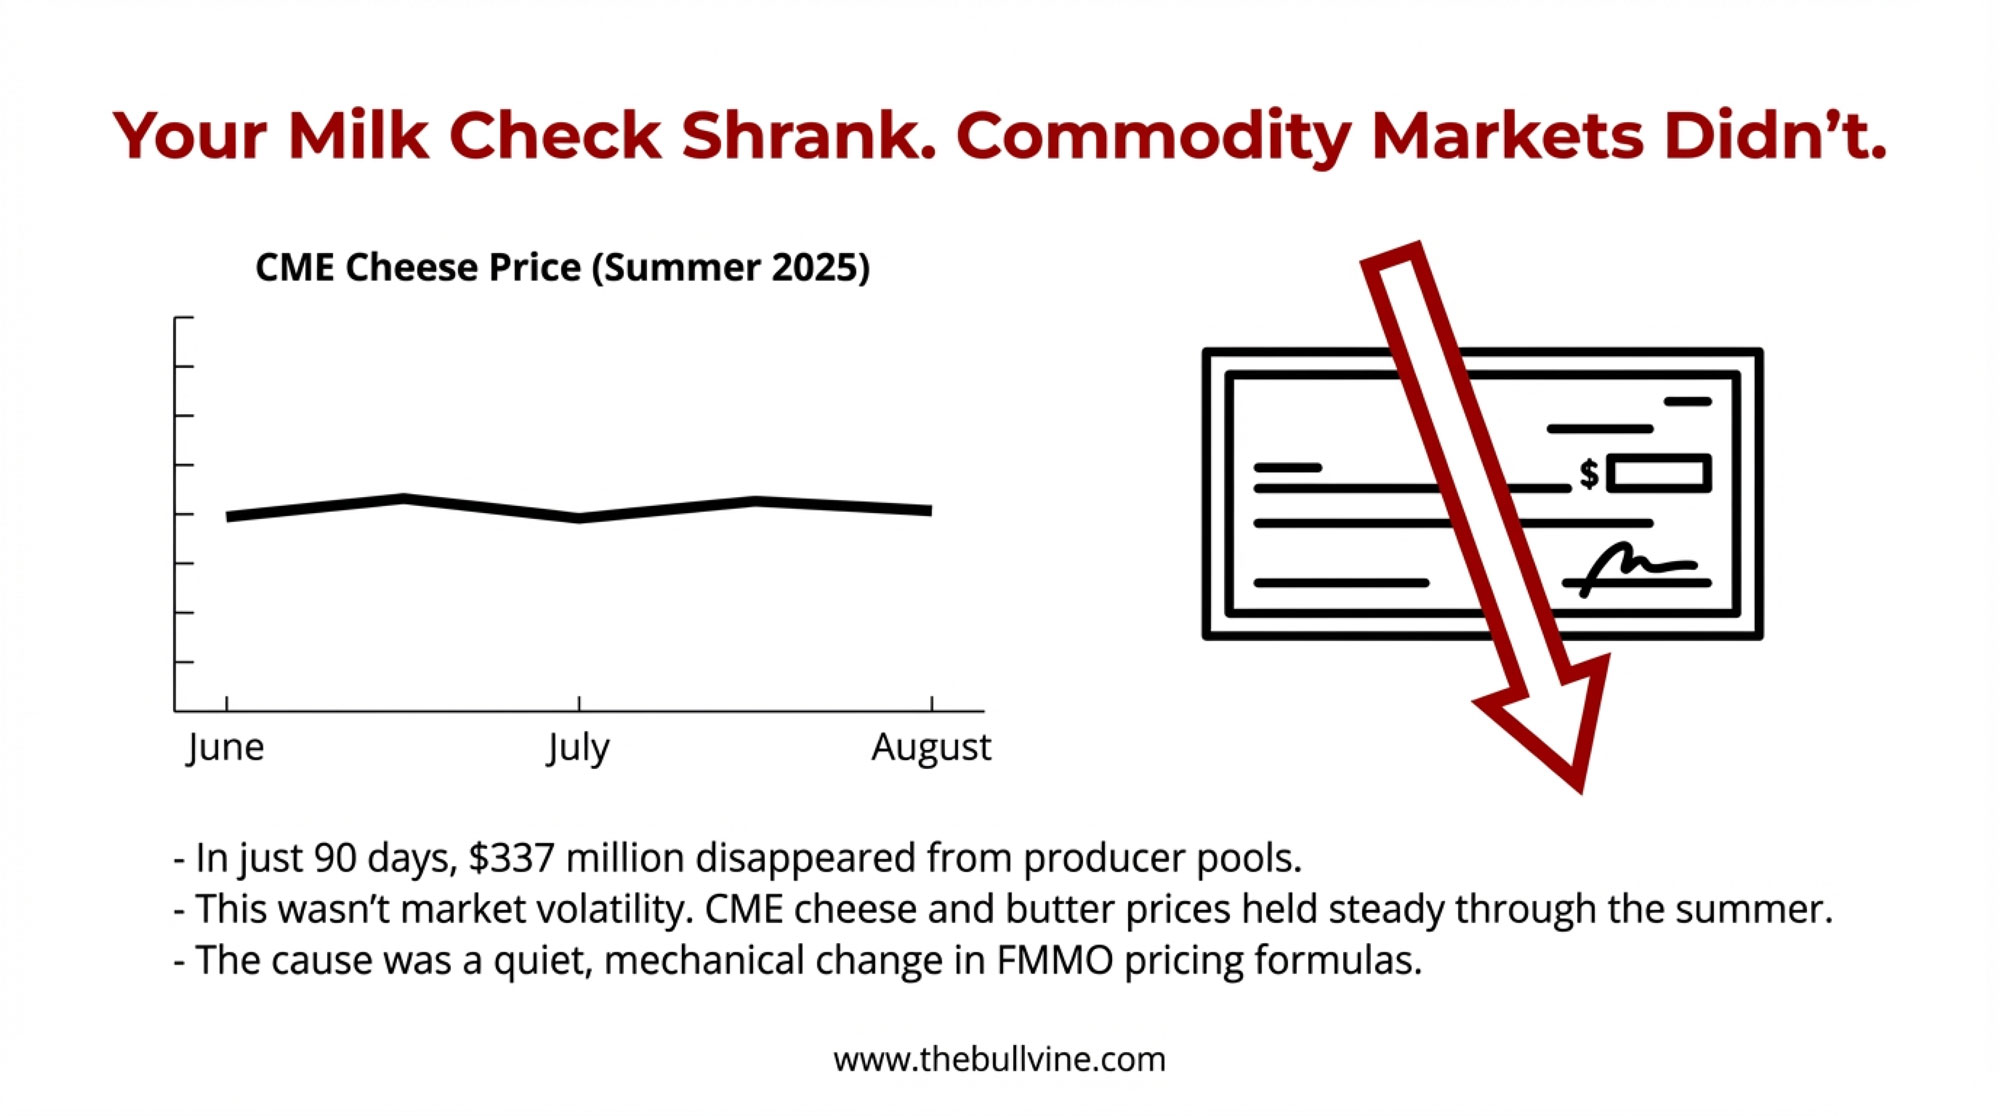
$337 million vanished from milk checks in 90 days. Cheese prices never moved. Formula math did.
EXECUTIVE SUMMARY: $337 million vanished from producer pools in 90 days—while cheese and butter prices held steady. The cause: FMMO make allowance increases effective June 1, 2025, cutting Class III prices by 92 cents per hundredweight. That revenue now stays with processors, not farms. Regional damage: Upper Midwest: $64 million; Northeast: $62 million; California: $55 million. Implementation timing compounded the hit—producer-negative changes took effect June 1; producer-positive composition updates waited until December 1, a $100 million gap. Policy corrections won’t reach milk checks until 2028 at the earliest. Three moves to make now: request your Class utilization breakdown from your co-op, verify DMC enrollment at the new 6-million-pound Tier 1 limit, and recalculate your breakeven against current Class III minus $0.92/cwt.
When a third-generation Wisconsin dairy farmer opened his August milk check, something didn’t add up. Cheese prices at the CME had held relatively steady through the summer. Butter markets weren’t in freefall. Yet his payment per hundredweight had dropped noticeably from where it sat in May.
“We knew the FMMO changes were coming,” he told me. “But there’s a difference between reading about formula adjustments and watching thousands of dollars disappear from your monthly check when nothing in the market seemed to justify it.”
And you know, he’s not alone in that experience. Across the country, producers are discovering that the Federal Milk Marketing Order reforms implemented June 1, 2025, have quietly extracted $337 million from producer pools in just three months. That number comes from the American Farm Bureau Federation’s analysis of the early impacts—and what’s striking is that this reduction came entirely from formula changes, not from anything happening in commodity markets.
Here’s what stands out about this situation. It isn’t a story about market volatility or demand shifts. It’s about policy mechanics that directly translate into milk check reductions. And understanding those mechanics has become essential for every dairy operation trying to plan beyond next month’s bills.
What Actually Changed in the Pricing Formulas
Let me walk through this, because the details matter more than most of us realize.
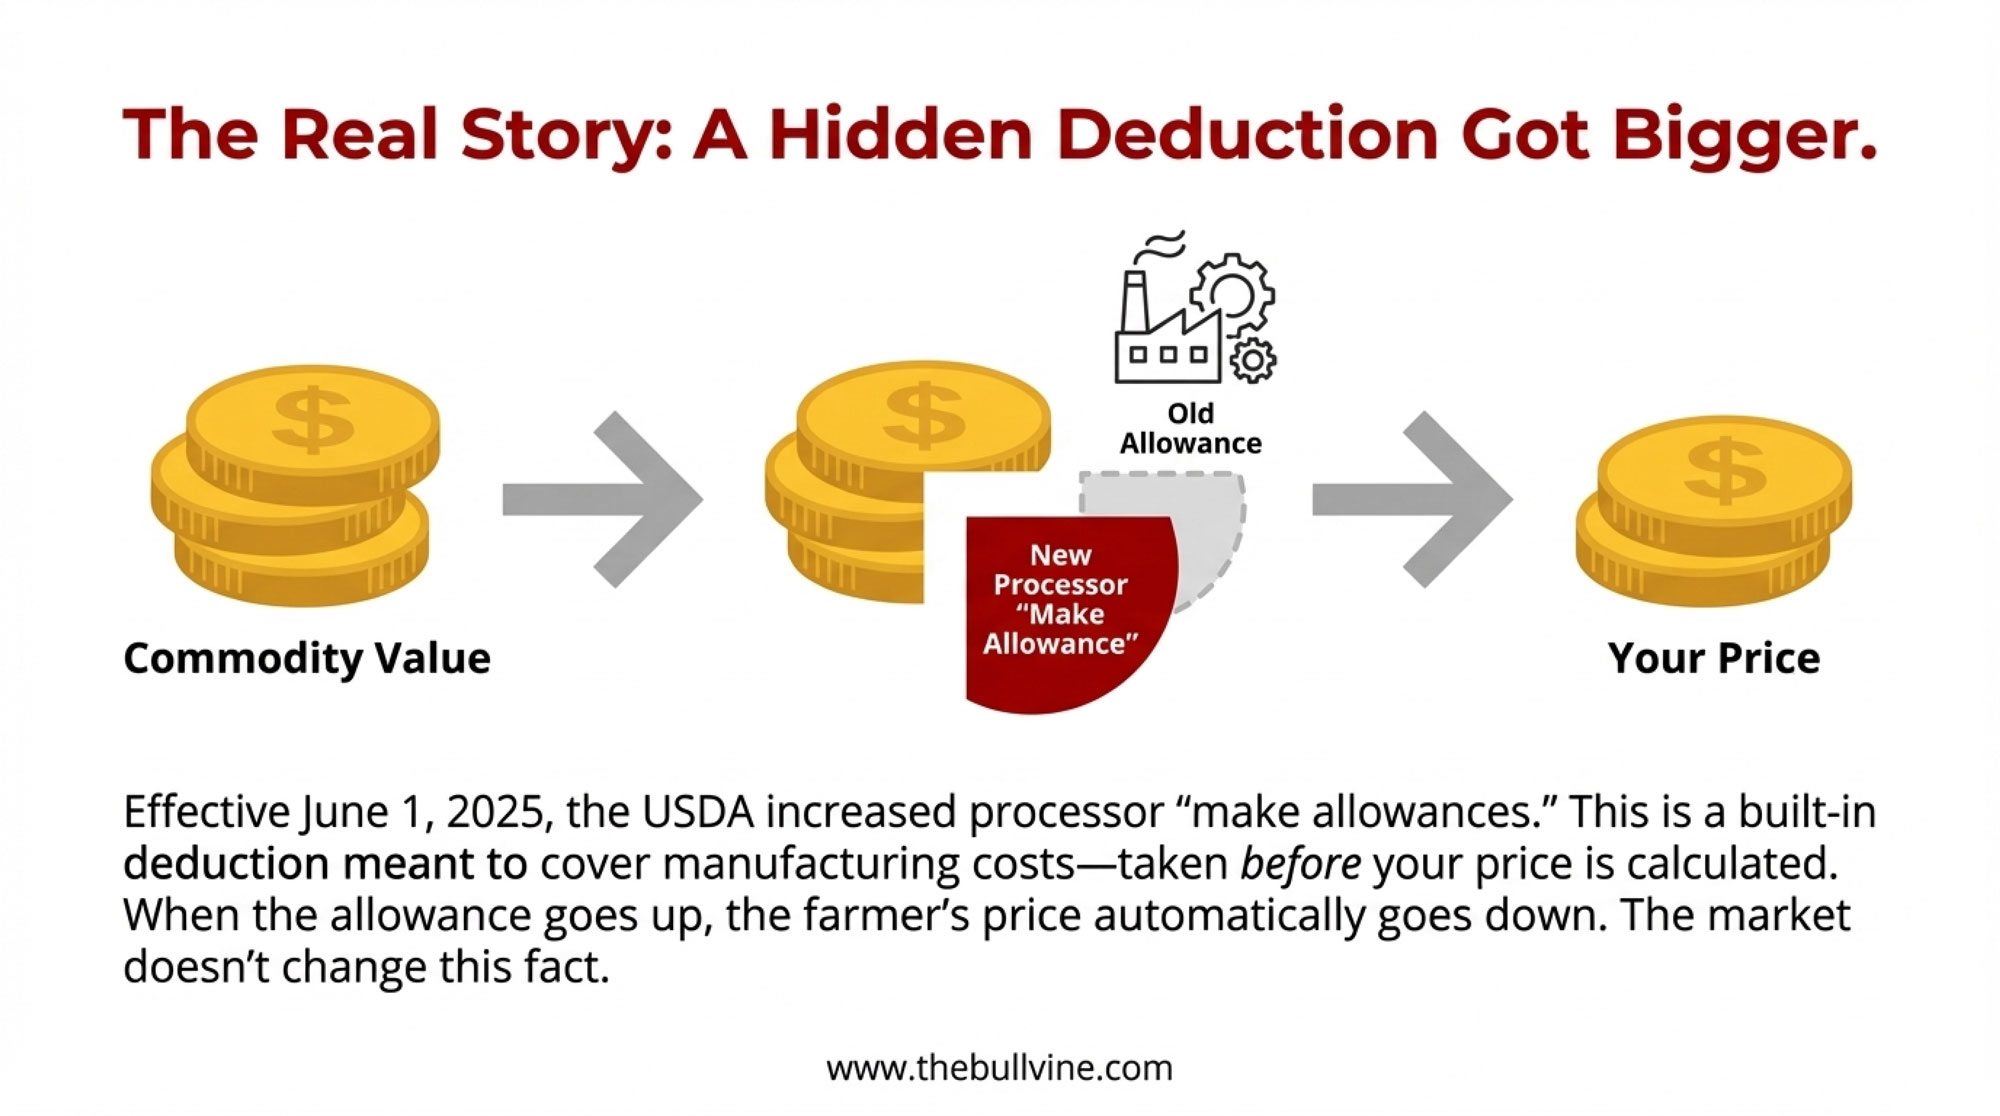
The June 2025 reforms updated several components of FMMO pricing that hadn’t been touched in nearly two decades. The biggest change involved make allowances—those deductions processors can take from milk prices to cover their manufacturing costs before calculating what farmers receive.
Now, processor groups had argued that manufacturing costs—energy, labor, packaging, maintenance—had risen substantially since the last update, making some adjustment necessary for plant viability. The International Dairy Foods Association and other processor representatives testified during FMMO hearings that plants were struggling to maintain margins under the old allowance structure. And honestly, there’s some legitimacy to that concern. Running a cheese plant isn’t cheap, and input costs have climbed across the board since the early 2000s.
USDA agreed with much of that assessment. So here’s what shifted:
The cheese make allowance jumped from $0.20 to $0.2519 per pound. Butter increased to $0.2272. Nonfat dry milk rose to $0.2393. And dry whey climbed to $0.2668 per pound.
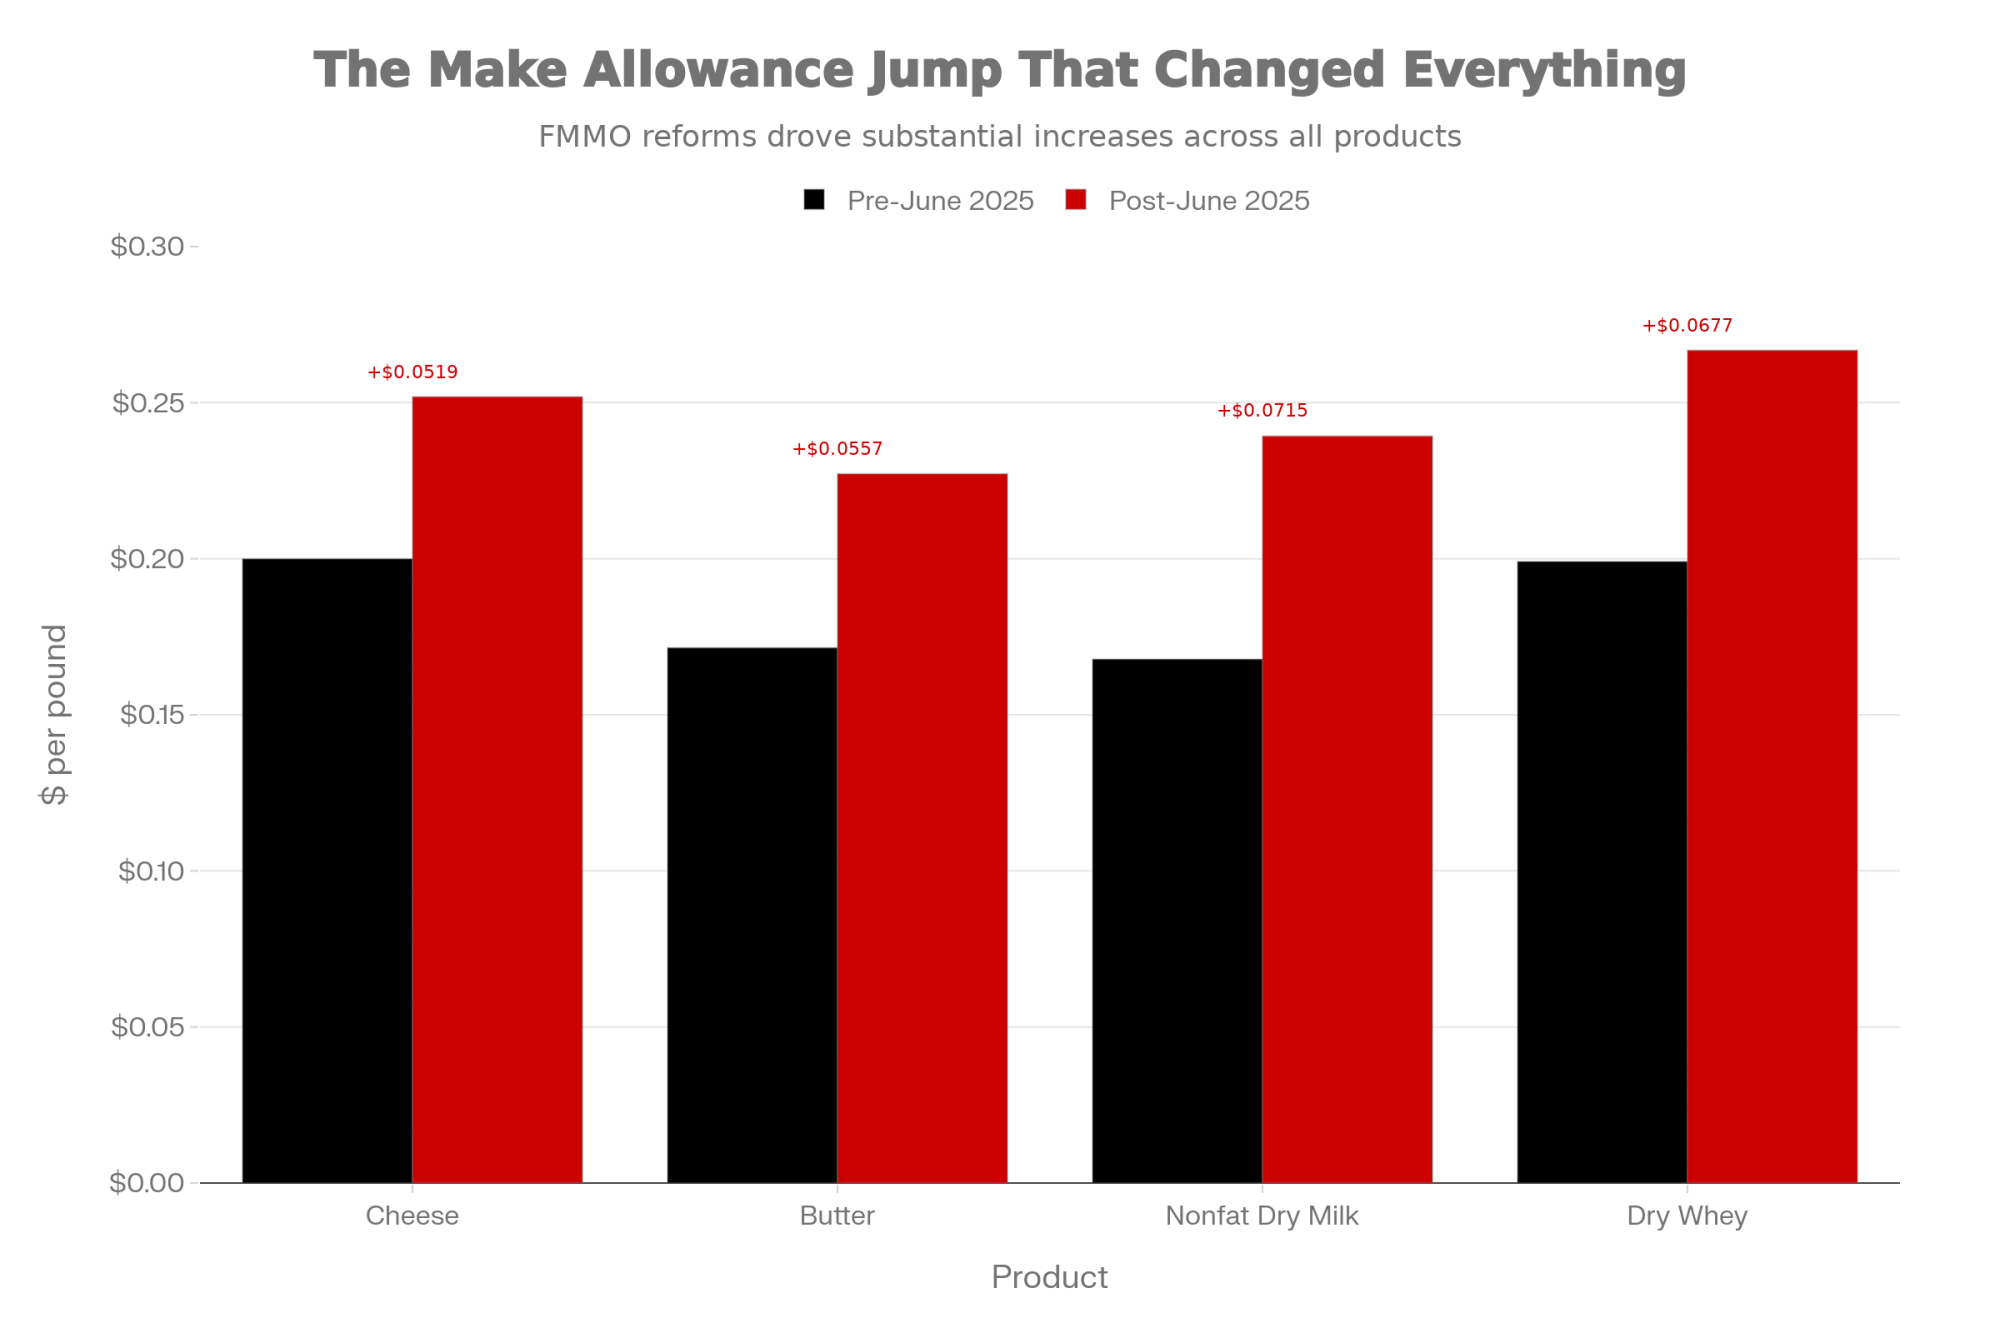
Those numbers might seem modest in isolation. A few cents here, a few cents there. But here’s the thing—these allowances get subtracted from commodity prices before the formulas calculate your component values. So when make allowances rise, every hundredweight you ship is worth less, regardless of what’s happening at the CME.
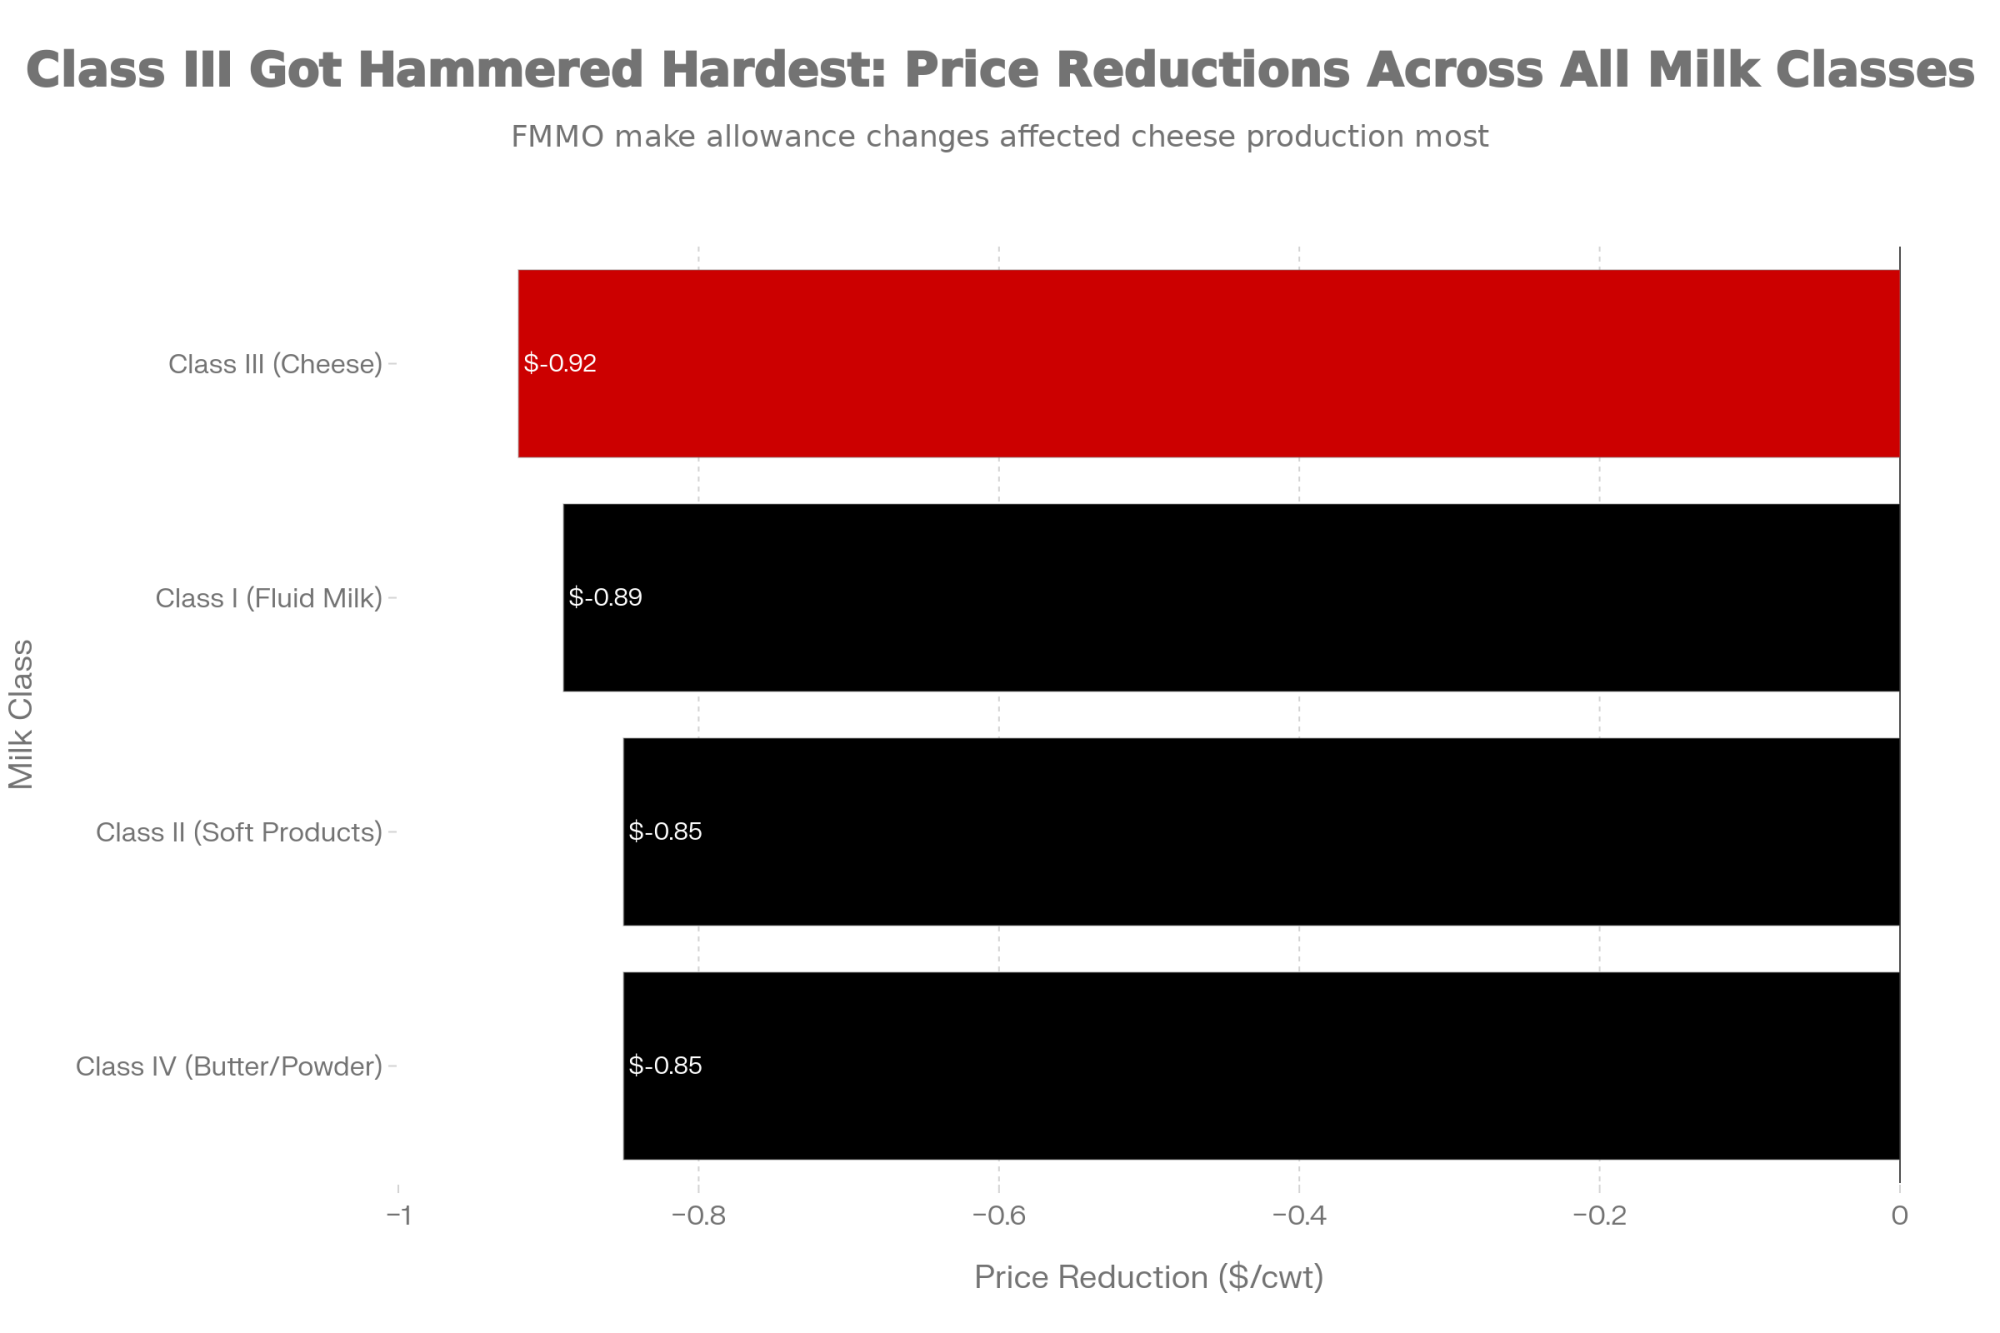
Danny Munch, an economist with the American Farm Bureau Federation who’s been tracking these changes closely, put it plainly. In the first three months under the new rules, farmers lost more than $337 million in combined pool value, with Class price reductions ranging from 85 to 93 cents per hundredweight.
The breakdown by Class tells the story:
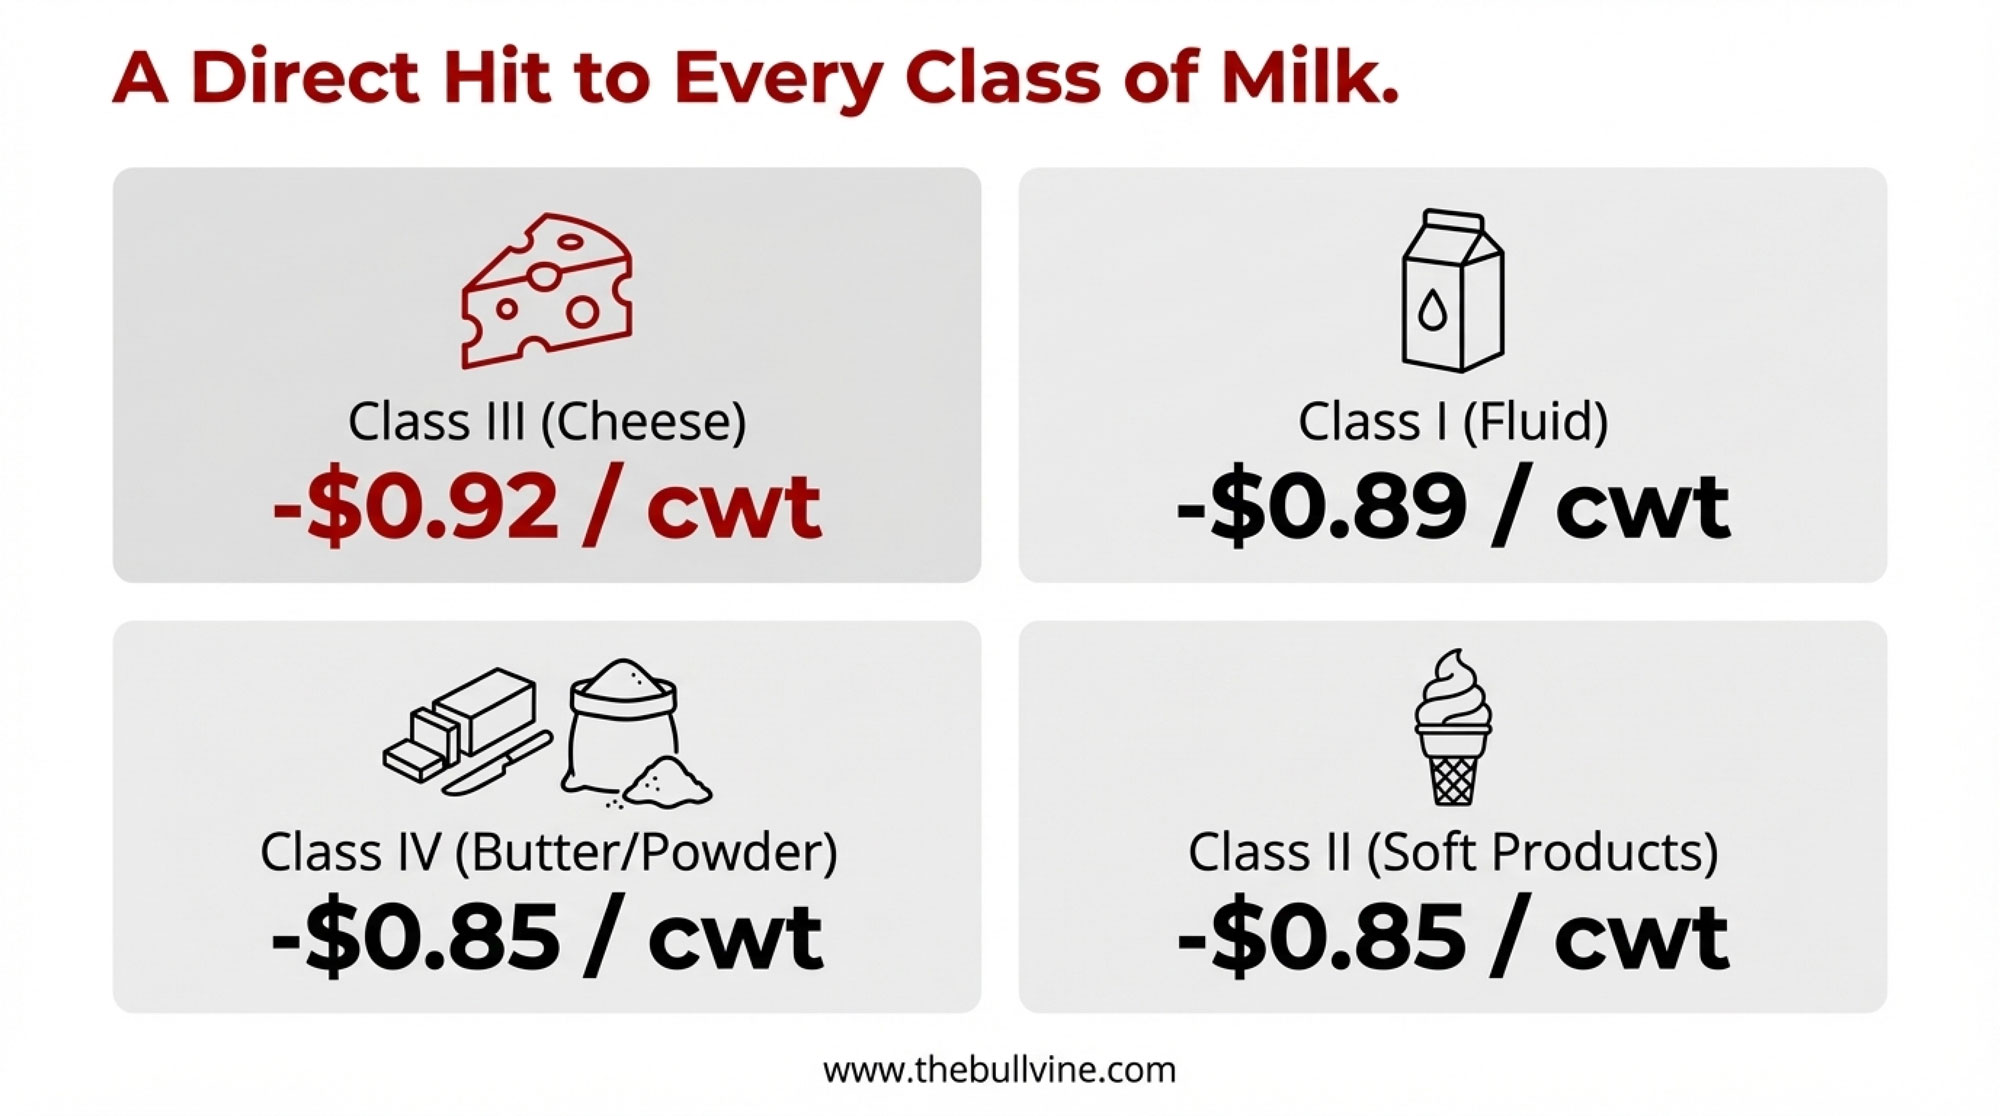
| Milk Class | Product Category | Price Reduction (per cwt) |
| Class I | Fluid Milk | -$0.89 |
| Class II | Soft Products (Yogurt, Ice Cream, Sour Cream) | -$0.85 |
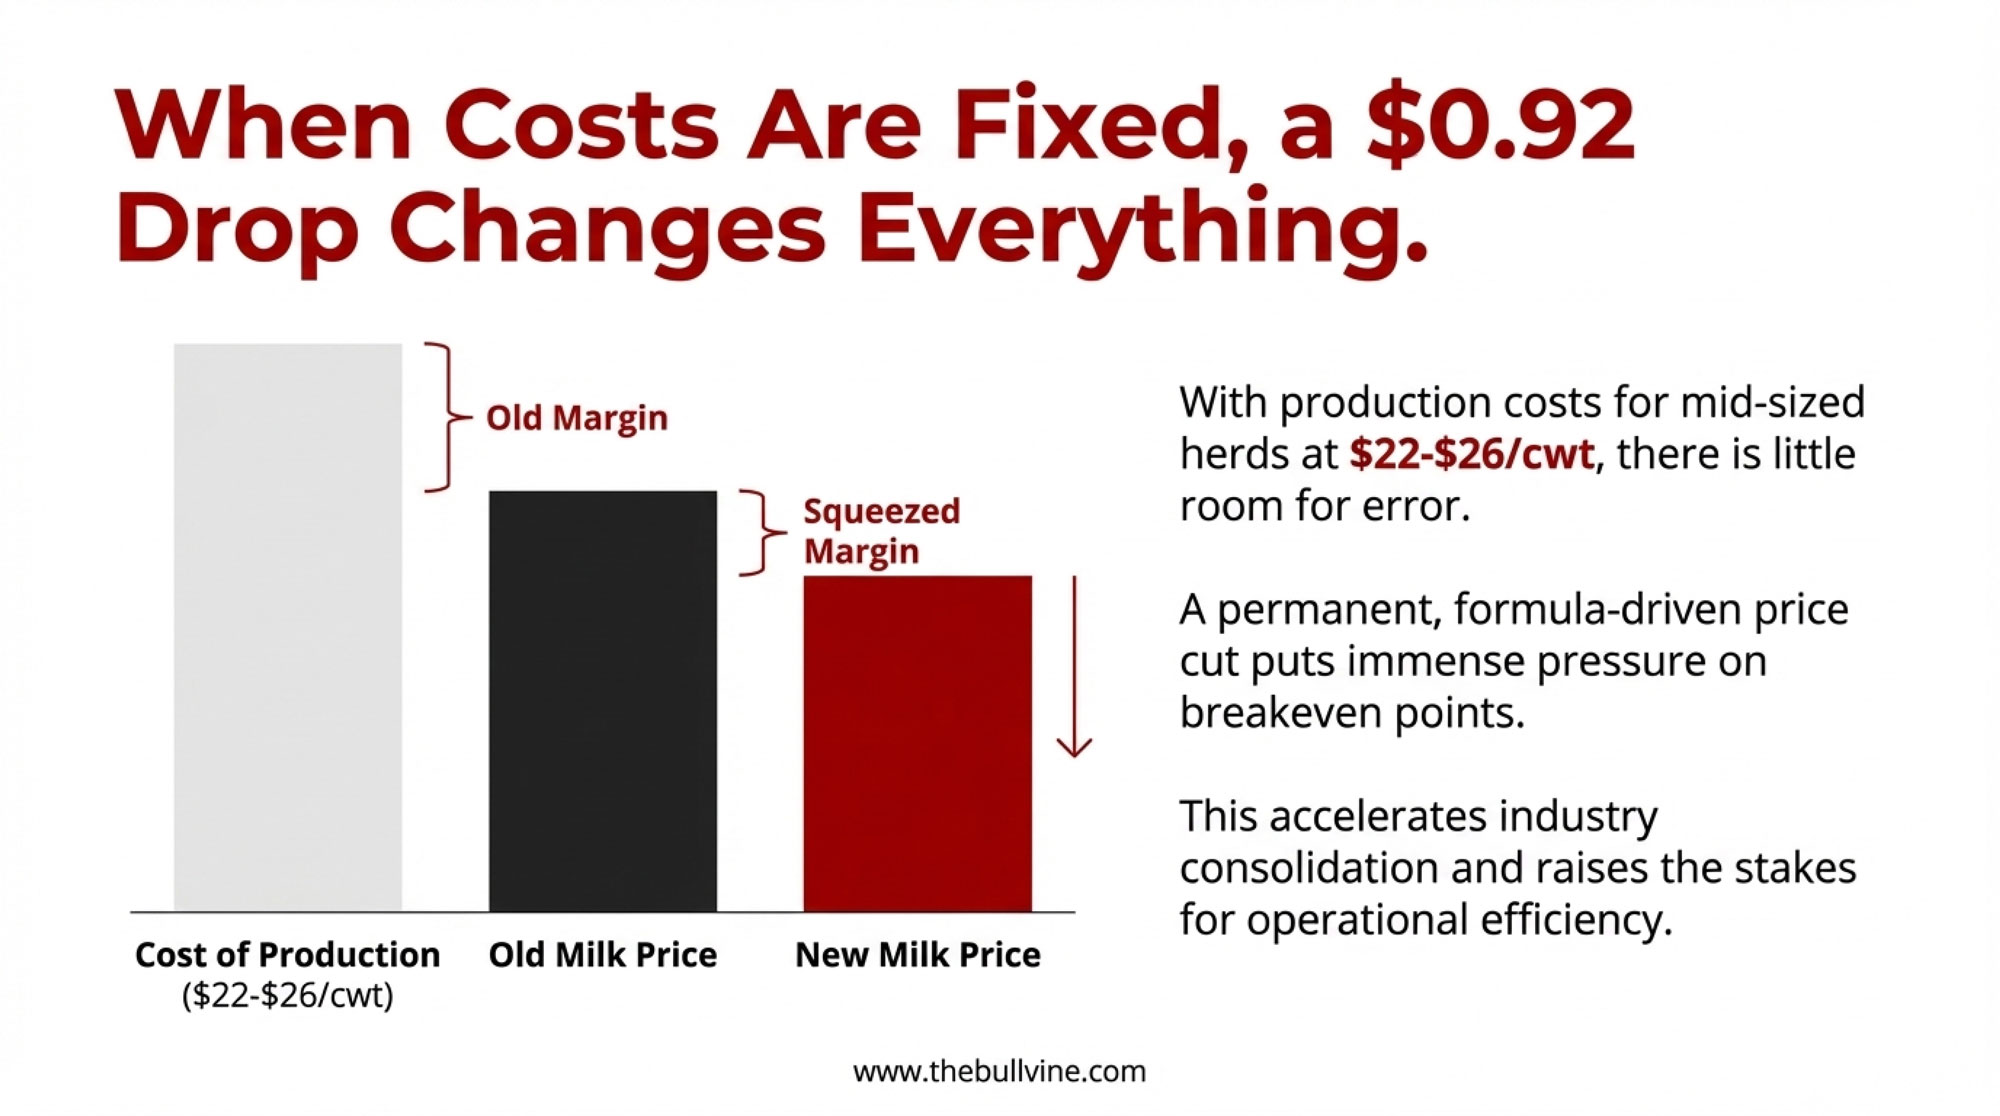
| Class III | Cheese | -$0.92 |
| Class IV | Butter / Powder | -$0.85 |
That’s not market conditions. That’s formula math.
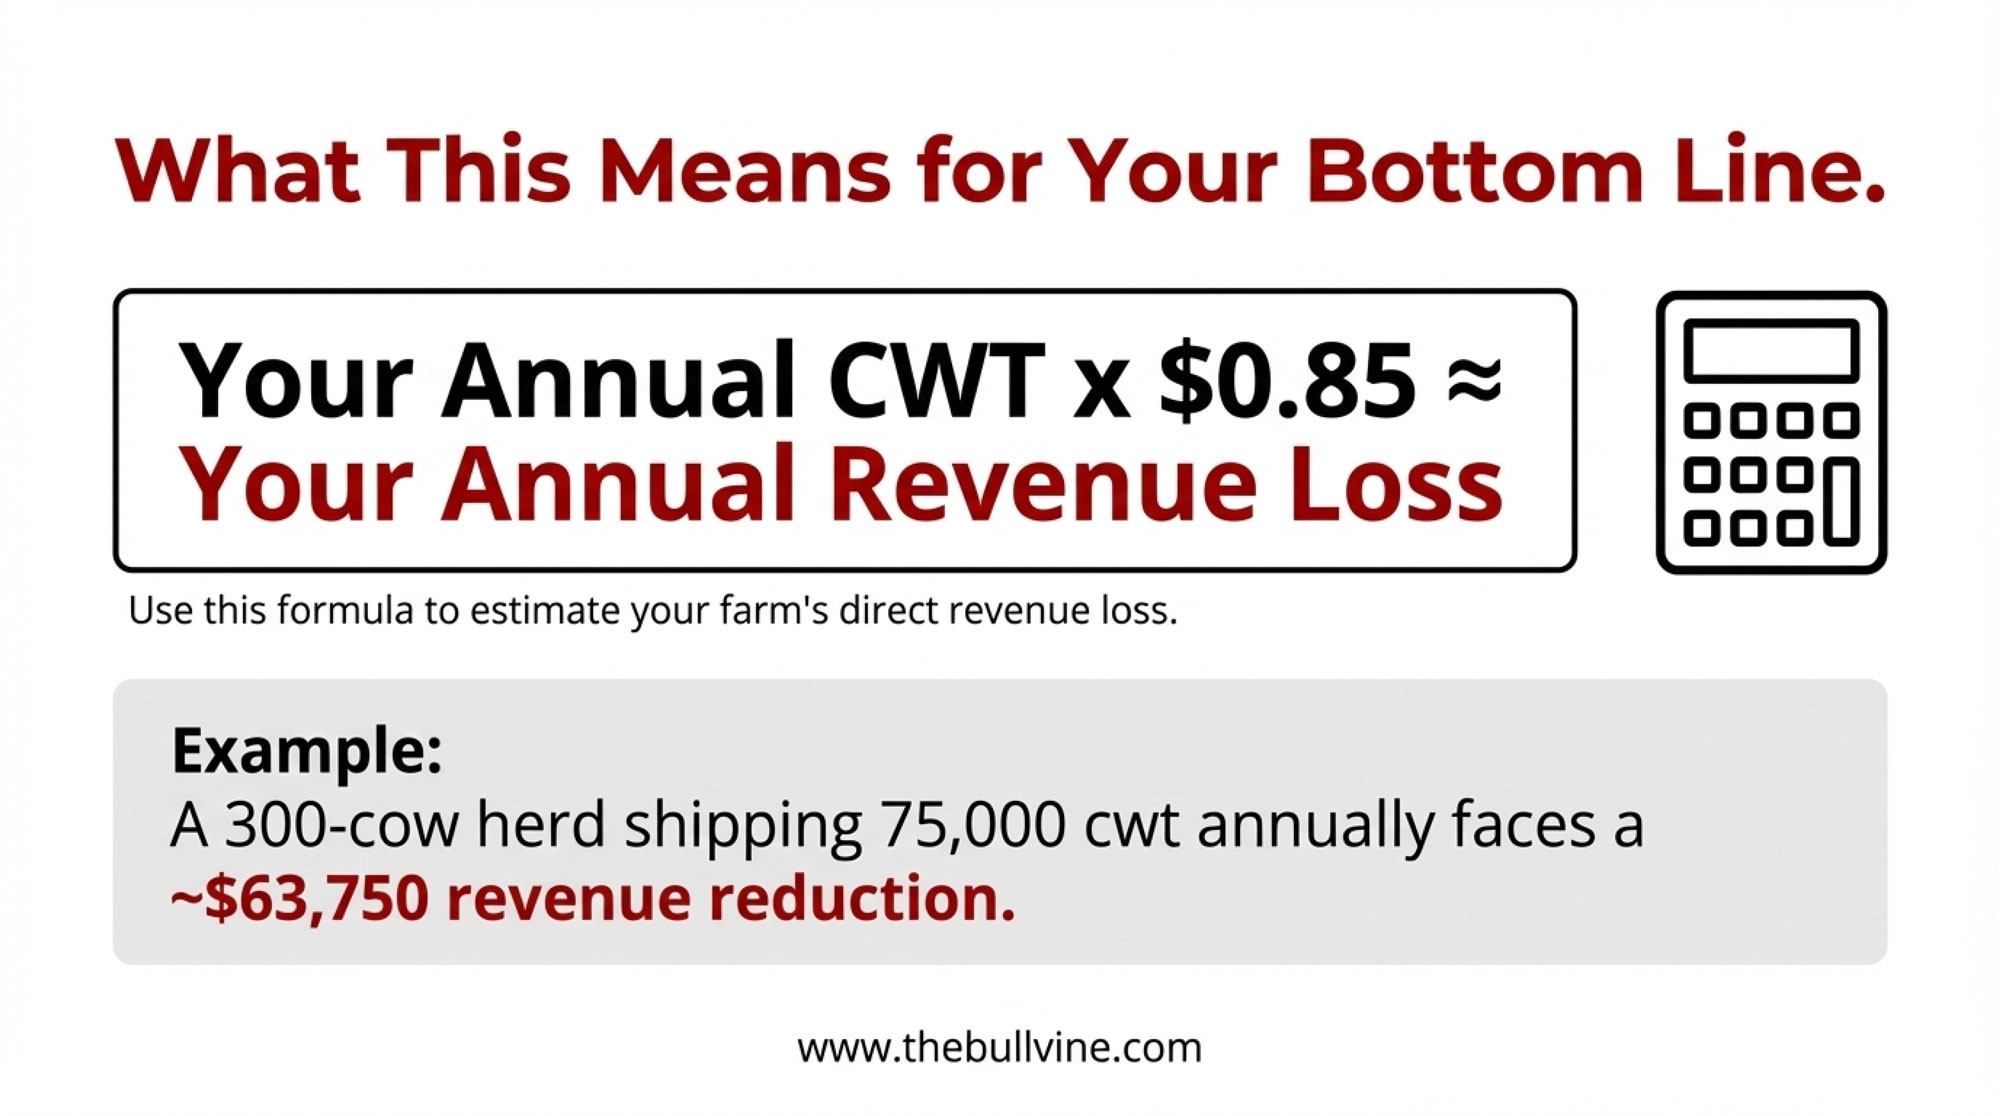
Quick exposure check: Take your annual production in hundredweight and multiply by $0.85 for a rough estimate of your Class III exposure from make allowance changes alone. A 300-cow herd shipping 75,000 cwt annually? That’s roughly $63,750 in annual revenue reduction before any offsetting factors.
The Regional Picture Gets Complicated
One pattern that’s emerged from the early data—and this aligns with what we’ve seen historically—is just how unevenly these changes landed across different parts of the country. FMMO reforms rarely affect everyone equally, and this time’s no exception.
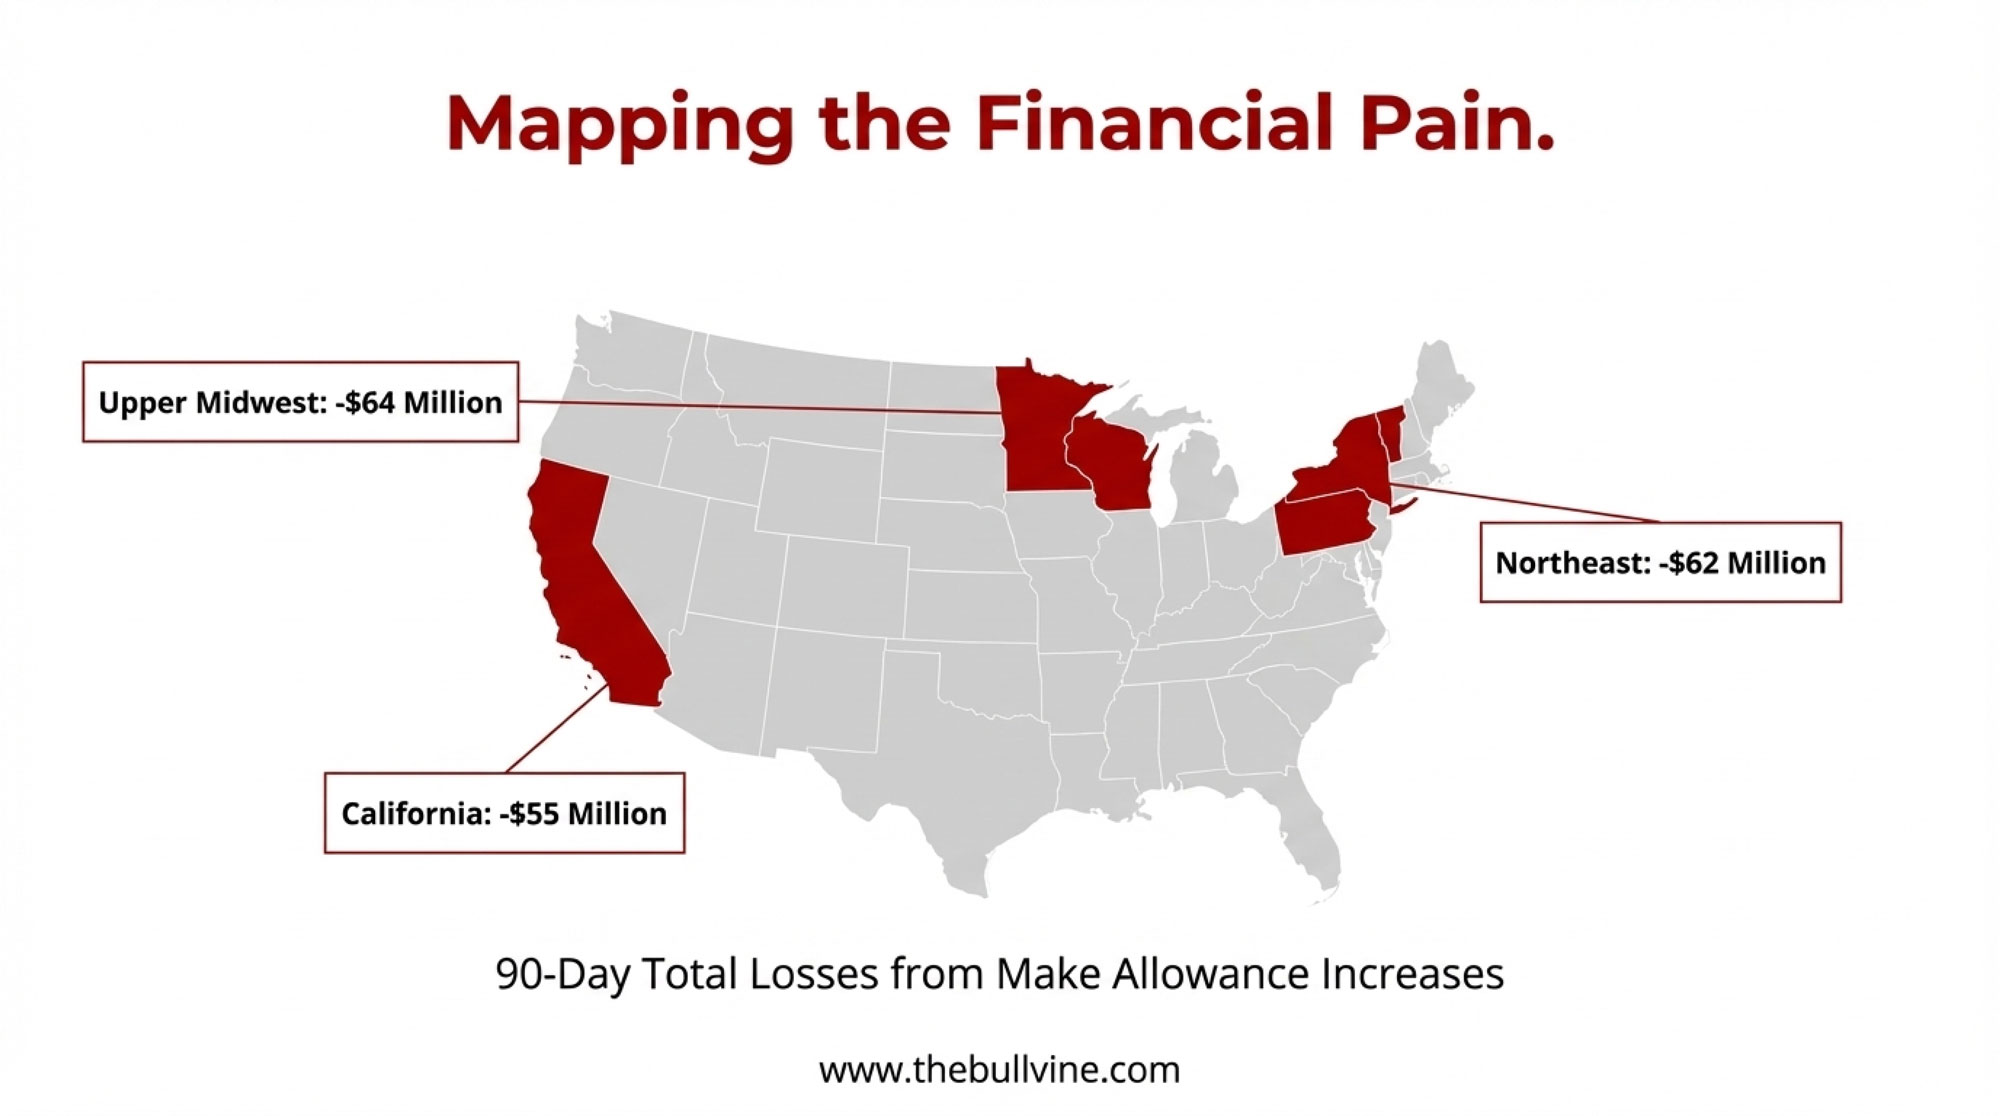
The regions absorbing the largest losses from make allowance increases were the Upper Midwest at $64 million, the Northeast at $62 million, and California at $55 million. This makes sense when you think about where the milk goes. These manufacturing-heavy regions send most of their production into cheese, butter, and powder. When make allowances rise, they feel the full weight of those higher deductions.
| FMMO Region | Make Allowance Loss | Class I Differential Gain | Net Impact (90 days) | Primary Utilization |
|---|---|---|---|---|
| Upper Midwest | -$64M | +$7M | -$57M | Cheese/Butter |
| Northeast | -$62M | +$34M | -$28M | Mixed/Fluid |
| California | -$55M | +$4M | -$51M | Cheese/Butter |
| Southwest | -$45M | +$5M | -$40M | Cheese |
| Southeast | -$42M | +$18M | -$24M | Mixed |
| Mideast | -$38M | +$30M | -$8M | Fluid-Heavy |
But the reforms also included Class I differential increases—adjustments meant to reflect higher transportation costs for serving fluid milk markets. These provided some offset in certain regions. The Northeast picked up about $34 million from differential gains, the Mideast around $30 million, and the Upper Midwest somewhere in the $6-8 million range.
So what does this mean for individual operations? Well, it depends heavily on where your milk actually ends up.
I’ve been talking with producers in different regions, and the experiences vary dramatically. A farm shipping to fluid bottlers in suburban markets might have seen partial offset from those higher differentials. Meanwhile, a commodity milk producer in rural Wisconsin shipping to a cheese plant absorbed the full make allowance impact with minimal relief.
The frustrating part for many of us is that Class utilization often falls outside direct control. Your cooperative makes routing decisions based on plant capacity, transportation logistics, and contract obligations—not based on which destination minimizes your personal exposure to formula changes.
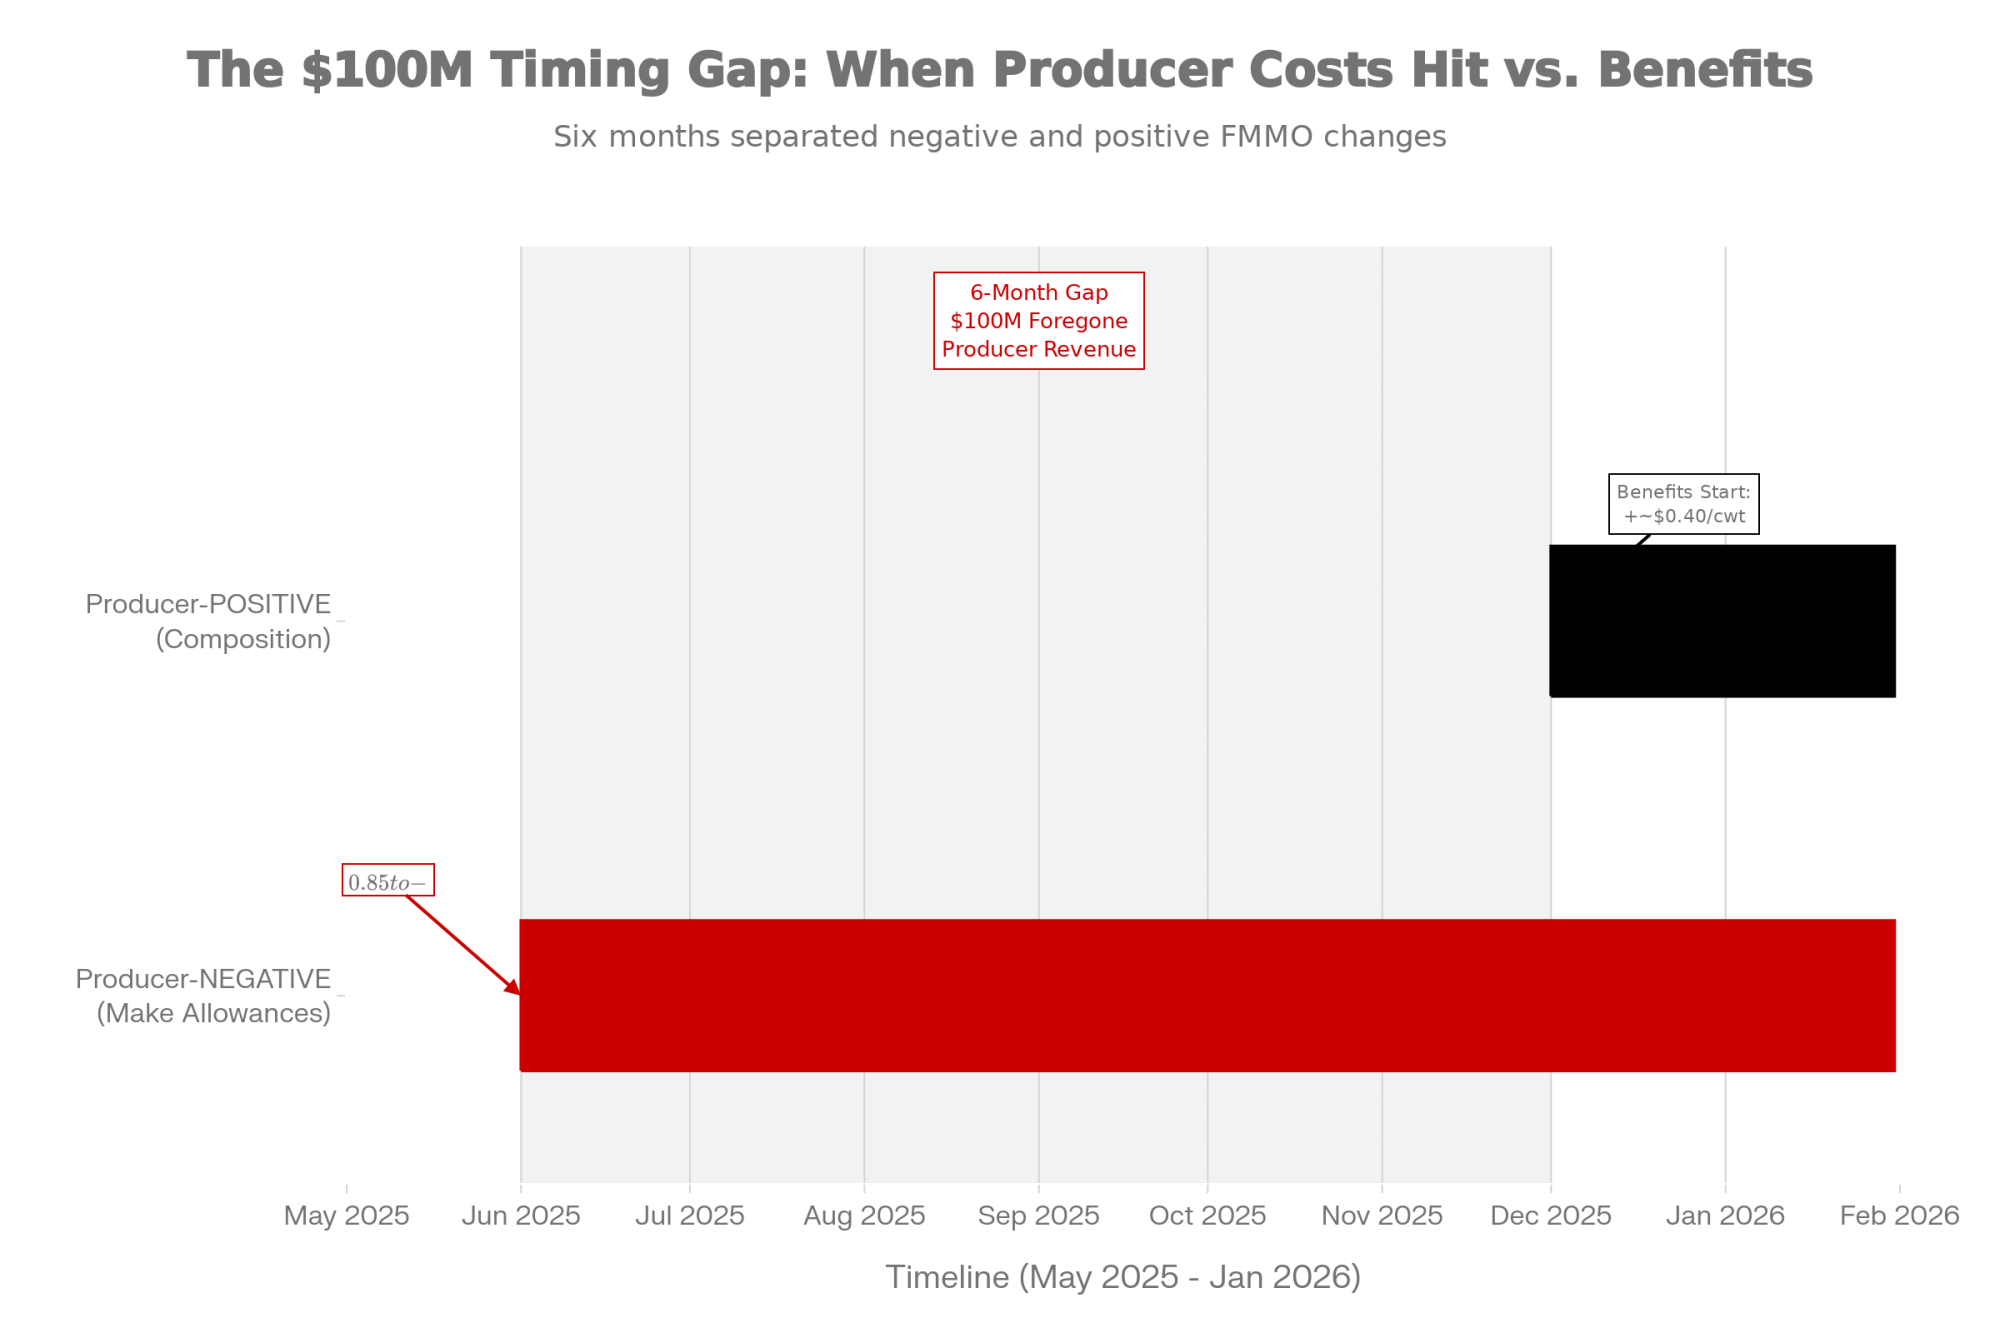
Here’s What Nobody Saw Coming: The Implementation Gap
There’s an aspect of these reforms that caught many people off guard, and it’s worth understanding because it reveals how policy decisions get sequenced.
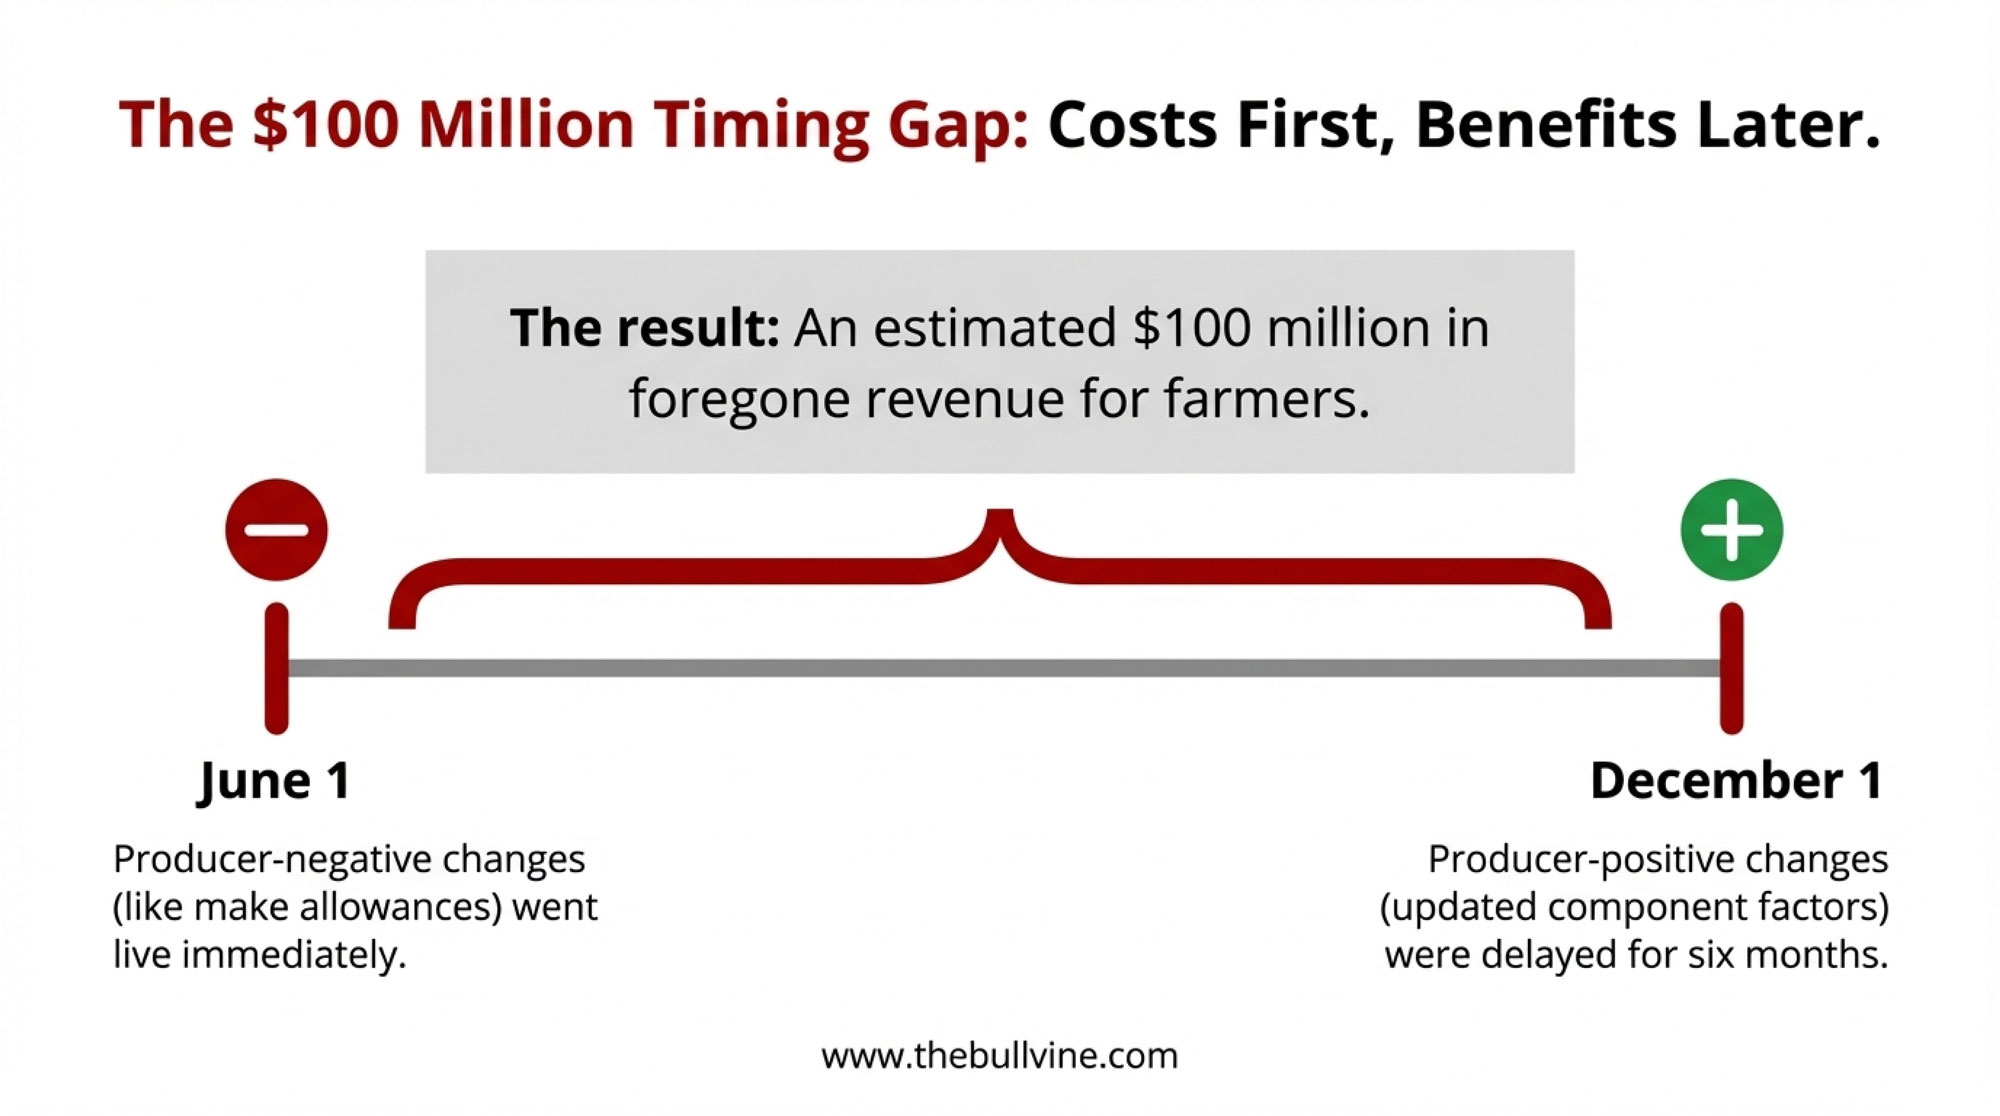
On June 1, 2025, make allowance increases, Class I mover changes, and differential updates all went live immediately. But the composition factor updates—which recognize that today’s milk actually contains higher protein and solids than the old formulas assumed—didn’t take effect until December 1, 2025.
That six-month gap matters a lot more than it might seem.
The composition factor updates are projected to add roughly $200 million annually to producer pool values. These changes recognize what anyone who’s tracked their herd’s components already knows—milk composition has improved significantly over the past two decades. Protein content is now recognized at 3.3 percent, up from the old 3.1 percent assumption. Other solids moved to 6.0 percent from 5.9 percent. Nonfat solids went to 9.3 percent from 9.0.
Today’s Holsteins are producing milk very different from that of their grandmothers. The genetics work we’ve done over the years is finally getting recognized in the pricing formulas.
Had USDA implemented everything at once, the net impact would have been considerably smaller. Instead, producer-negative changes took effect immediately while producer-positive changes waited half a year.
USDA’s stated rationale centered on avoiding disruption to existing risk management positions. And there’s something to that concern—a lot of operations had hedges and contracts in place based on certain assumptions. But as one Upper Midwest producer put it to me: “Funny how avoiding disruption only seemed to matter for one side of the equation.”
The practical effect? An estimated $100 million in foregone revenue during the waiting period. That’s real money that could have partially offset the make allowance hit.
What This Means at the Farm Level
So what does this actually look like for a specific operation?
Consider a 500-cow dairy producing 12.5 million pounds annually—that’s 125,000 hundredweight. At a net impact of 75 to 85 cents per hundredweight, after accounting for whatever Class I differential offset they might receive, you’re looking at an annual revenue reduction somewhere between $93,750 and $106,250. On a quarterly basis, that’s $23,400 to $26,500.
For operations already running tight margins, that’s not a rounding error. That’s the difference between breaking even and bleeding equity.
| Operation Scale | Typical Herd Size | Production Cost ($/cwt) | Baseline Milk Price | Post-Reform Price | Margin Status |
|---|---|---|---|---|---|
| Small Operations | 150-350 cows | $28-32/cwt | $22.50/cwt | $21.58/cwt | -$6 to -$10 |
| Mid-Size Operations | 400-800 cows | $22-26/cwt | $22.50/cwt | $21.58/cwt | -$4 to $0 |
| Large Operations | 1,000-2,500 cows | $18-22/cwt | $22.50/cwt | $21.58/cwt | $0 to +$3 |
| Mega Operations | 3,000+ cows | $16-20/cwt | $22.50/cwt | $21.58/cwt | +$1 to +$5 |
Farm business analyses from university extension services starkly illustrate the challenge. As many of us have seen in our own benchmarking groups, production costs vary enormously by scale. Smaller operations often run $28-32 per hundredweight once you account for all the costs. Mid-sized herds typically see $22-26 per hundredweight. Large operations with real scale efficiencies can sometimes get below $20 per hundredweight.
If you’re running 350 cows at $24 per hundredweight production costs and your milk check just dropped by 85 cents from formula changes alone… well, the math gets uncomfortable quickly.
What Farmers Are Finding Works Right Now
I’ve been asking producers and advisors what’s actually helping operations navigate this environment. A few patterns keep emerging.
For operations with 12-18 months of financial runway:
Take a hard look at your marketing relationships. Some processors are actively seeking guaranteed supply right now and will pay premiums for volume commitments and quality consistency. This requires proactive outreach—they’re not going to call you—but the potential upside is meaningful.
I recently spoke with an 800-cow Wisconsin operator who renegotiated his supply agreement last fall. He ended up with about 65 cents per hundredweight above what he was getting through his cooperative. “That doesn’t solve everything,” he told me, “but it bought us time to figure out next steps.”
Review your defensive positions. Are you maximizing DMC, DRP, and LGM coverage? Do you know your cooperative’s exit provisions and equity retention schedules? These aren’t exciting conversations, but they’re the ones that matter when margins compress.
For operations under immediate financial pressure:
Start the lender conversation early. I keep hearing from agricultural bankers that farmers wait too long. Early engagement almost always produces better outcomes than waiting until covenant violations force difficult conversations.
Get honest about asset values. Understanding current cow prices, equipment market conditions, and land values helps determine whether continuing operations preserve more value than an orderly wind-down. This isn’t giving up—it’s making informed decisions with full information.
For well-positioned operations:
There’s another side to consolidation periods. Quality genetics, equipment, and other assets may become available at attractive valuations. Processor relationships may be negotiable as supply uncertainty increases. Operations with strong balance sheets have options that stressed operations don’t.
Who’s Finding It Easier to Adapt
Looking at operations that seem better positioned for this environment, a few characteristics stand out.
Scale efficiency matters more than ever. Operations running production costs below $20 per hundredweight have a cushion that mid-sized dairies at $24 per hundredweight simply don’t have. This isn’t about big versus small in some ideological sense—it’s just math.
Component profiles aligned with processor needs. Herds optimized for the component profiles that cheesemakers value—particularly strong protein levels—are capturing better premiums from buyers focused on cheese yield efficiency. If you’ve invested in genetics that emphasize protein production, those investments are paying dividends right now.
Diversified market access. Farms with direct processor relationships, specialty arrangements, or above-average Class I utilization have pricing mechanisms that partially insulate them from pool-level swings.
What’s particularly noteworthy is that many operations that appear well-positioned today made strategic decisions during 2018-2021, before anyone knew the FMMO reforms were coming. They invested in genetic improvement for specific component profiles, built relationships with specialty buyers, or developed direct channels.
They weren’t predicting FMMO changes. They were reading structural trends—declining fluid consumption, processor consolidation, component value shifts—and positioning accordingly. The farms that treated those years as “good enough” are the ones feeling the squeeze most acutely now.
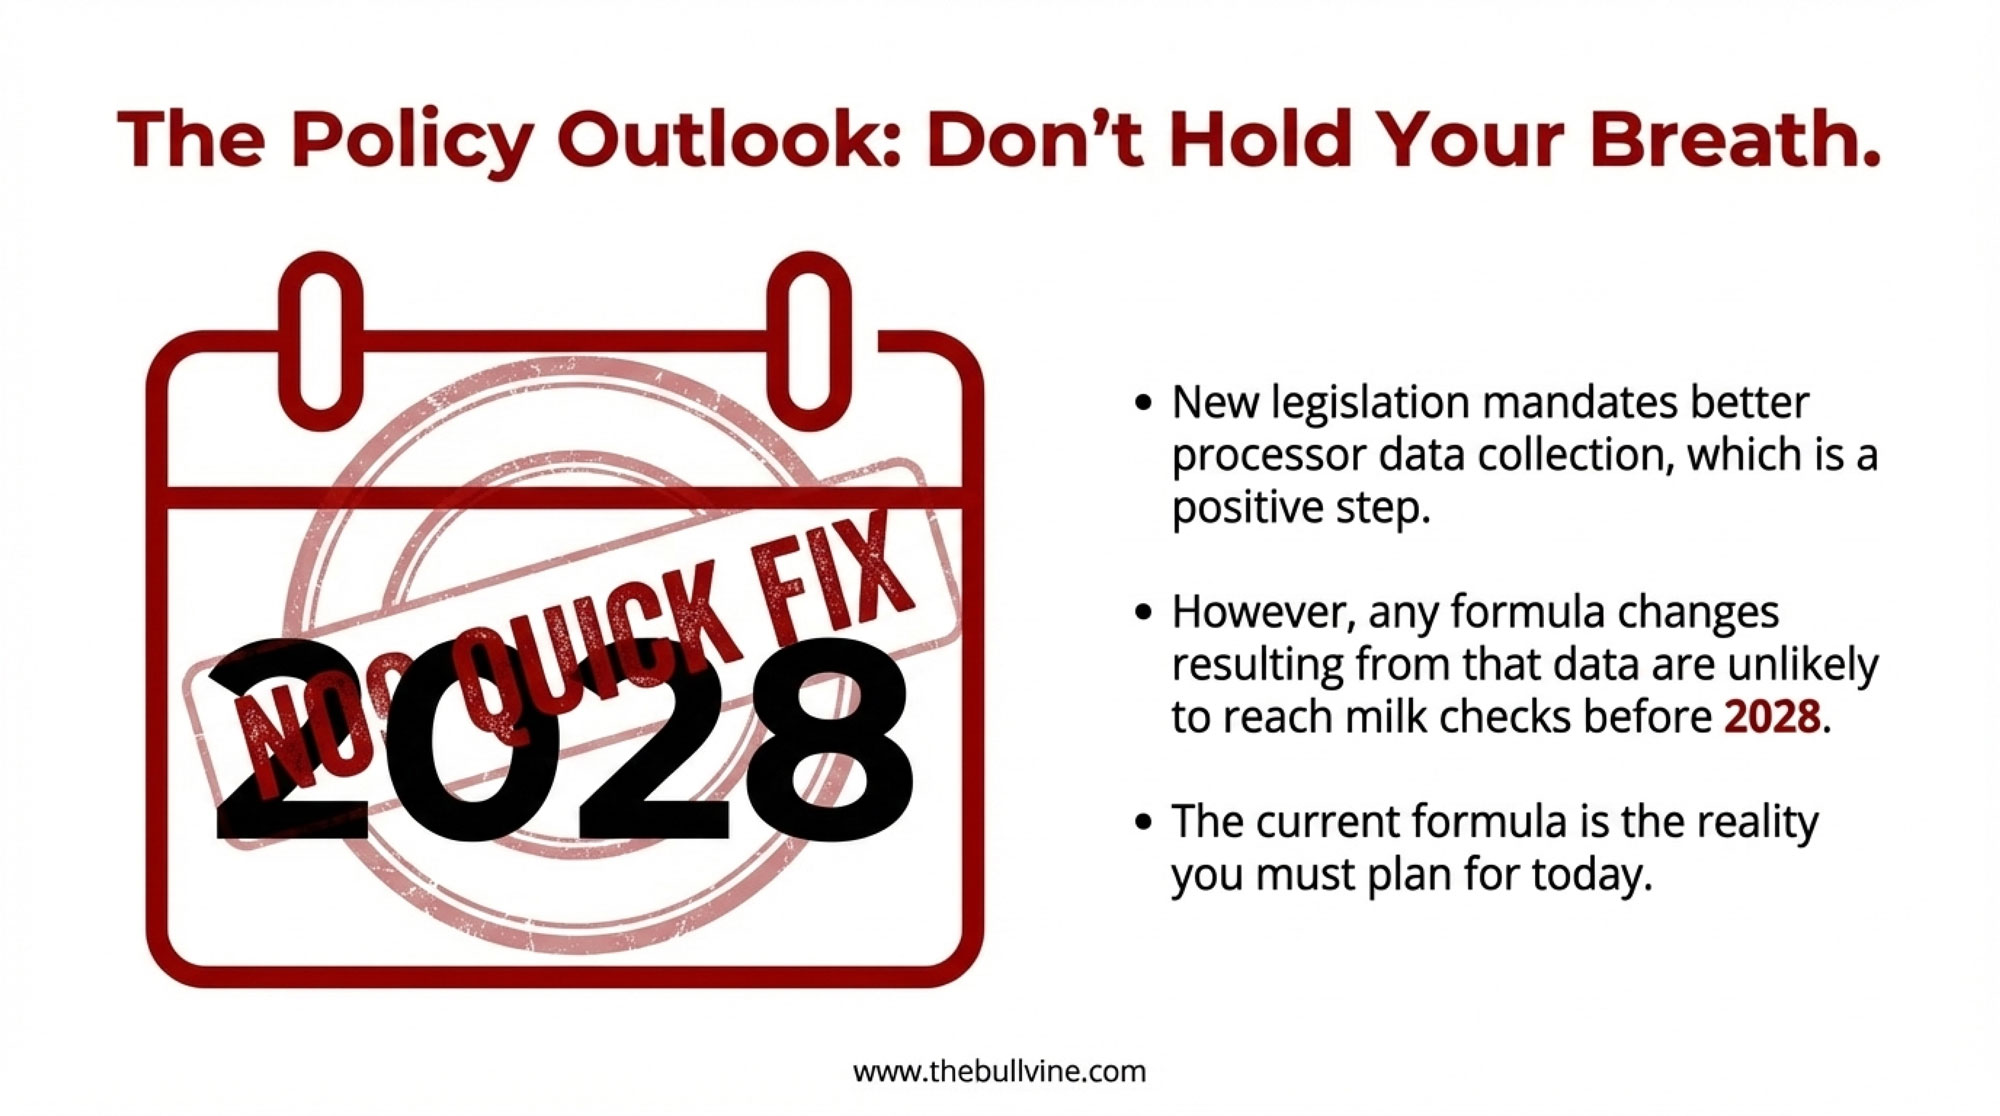
The Policy Outlook: What’s Actually Changing
The One Big Beautiful Bill Act—the sweeping budget reconciliation package signed into law by President Trump on July 4, 2025—includes several provisions that directly affect dairy. Among them is a mandate requiring the USDA to conduct biennial surveys of actual processor manufacturing costs, with dedicated funding for dairy processing cost and product yield data collection. This responds to criticism that the 2025 make allowances were based on self-selected, self-reported processor data that couldn’t be independently verified.
The legislation, which passed the House 218-214 and the Senate 51-50 with Vice President Vance casting the tiebreaking vote, also expanded Dairy Margin Coverage by raising Tier 1 coverage eligibility from 5 million to 6 million pounds per farm and reauthorized the program through 2031.
Better data is better than no data. But let’s be honest—surveys don’t change formulas, and formulas are what hit your milk check. The fundamental structure that determines how allowances affect producer prices remains intact. So does USDA’s discretion over implementation timing. So do the regional disparities built into how different orders work.
Even under optimistic scenarios, any improvements in data won’t take effect until 2028 or 2029. As Danny Munch from AFBF noted, “It’s supposed to be biennial, so it happens every other year, but we don’t know when USDA is going to publish a rule and a timeline, and begin data collection.” For operations making decisions this year, the current formula structure is simply the operating reality.
Looking Ahead Through 2028
Based on current trends and the additional pressure from these formula changes, the industry structure continues evolving.
Annual farm exit rates have been running 6-8 percent in recent years – several ag lenders have tracked this closely. The additional margin pressure from FMMO changes appears to be accelerating that pace in some regions, particularly where mid-sized operations are concentrated. The Upper Midwest and parts of the Northeast seem to be feeling this most acutely.
By 2028, industry analysts project U.S. dairy farm numbers may decline from approximately 24,000 in 2022 to somewhere around 18,000-19,000. Average herd sizes continue climbing. Processing investment keeps flowing toward larger, more efficient facilities.
These trends existed before the FMMO changes. But policy-driven margin compression is accelerating decisions that might otherwise have taken longer to unfold. That’s not necessarily good or bad—consolidation has been the story of American agriculture for a century—but it does mean that individual operators need to make honest assessments of their own situations.
This Week: Three Moves to Make Now
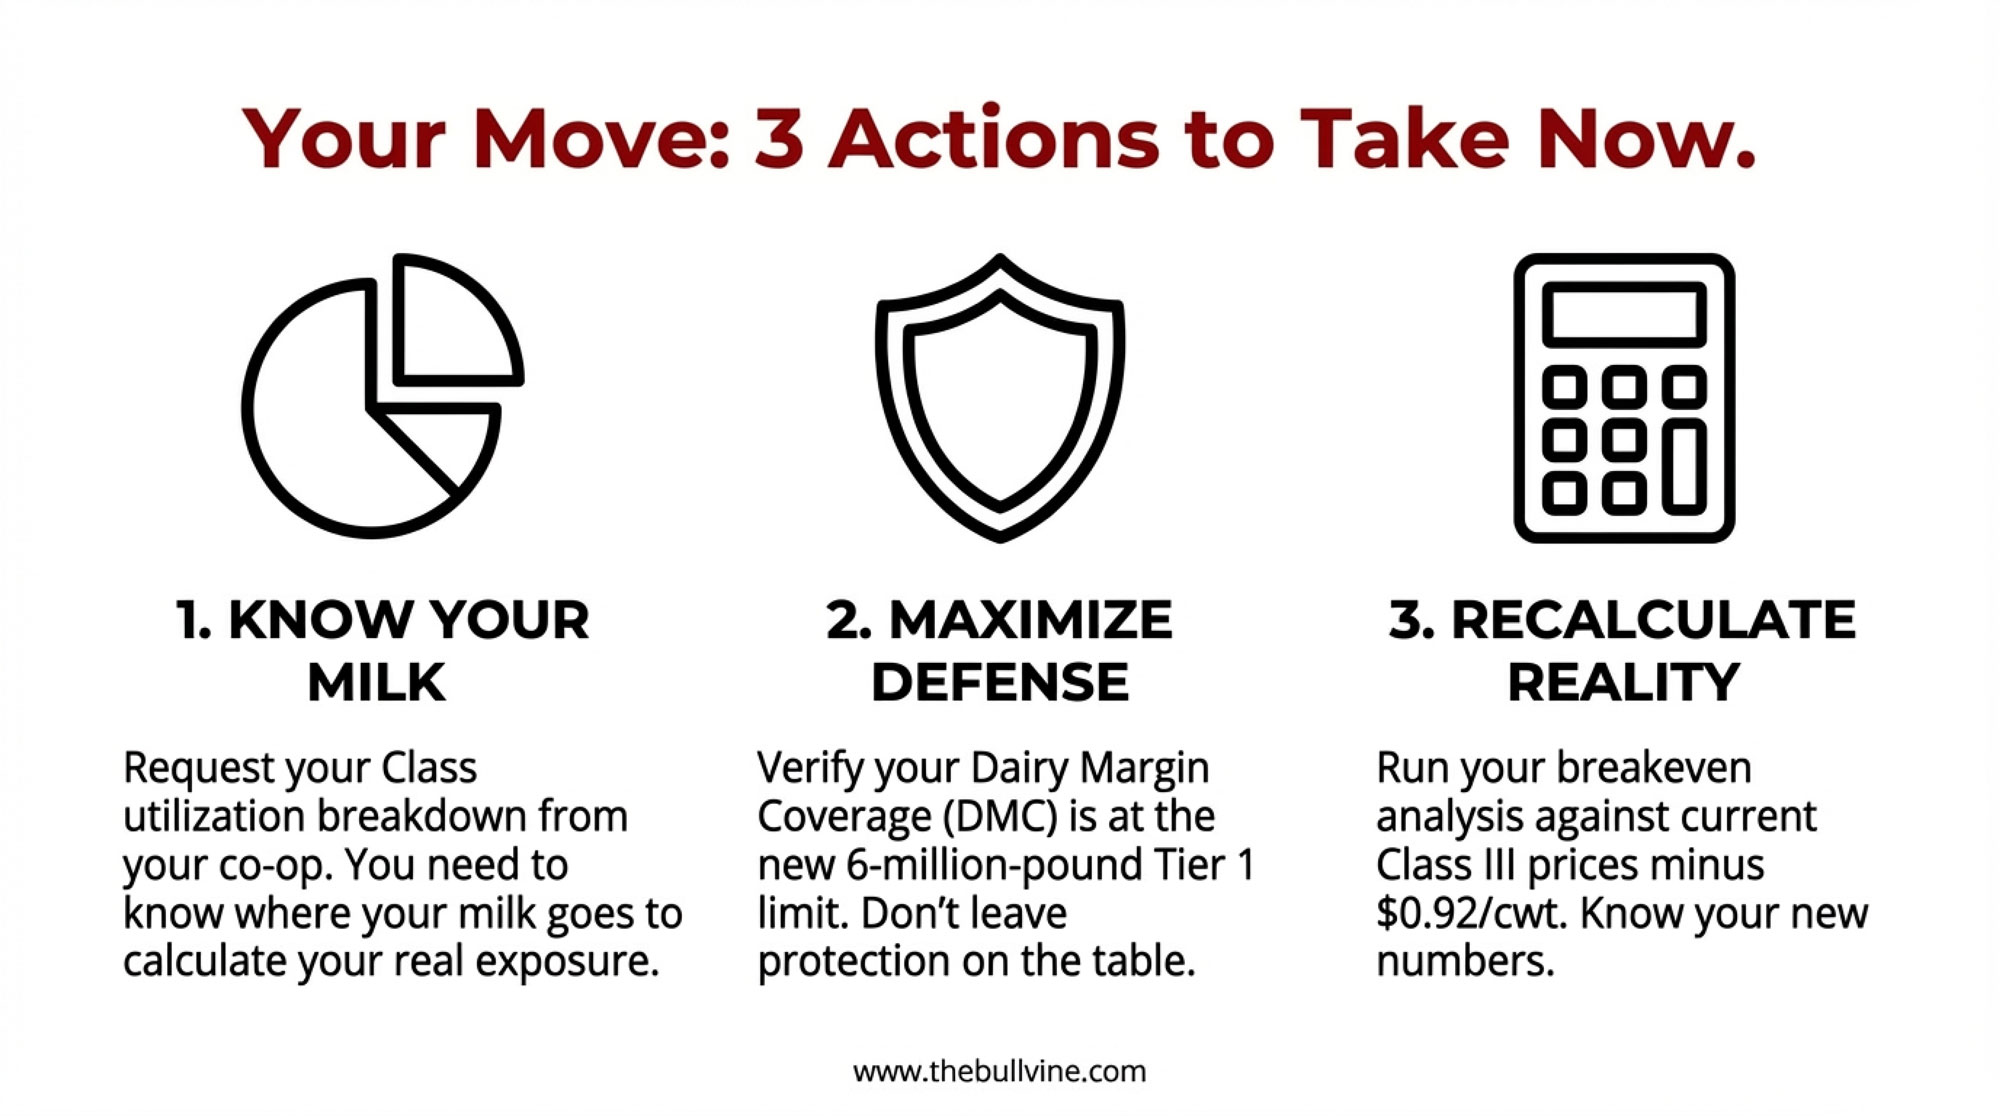
- Request your Class utilization breakdown from your cooperative. You need to know where your milk actually goes before you can calculate your real exposure.
- Review your DMC coverage level. With Tier 1 now covering up to 6 million pounds, make sure you’re not leaving protection on the table.
- Run the numbers on your current cost of production. Not last year’s numbers—this year’s, with current feed costs, labor, and overhead. Then compare that against Class III prices minus $0.92.
The Bottom Line
The 2025 FMMO reforms represent a meaningful shift in dairy economics. The impact on individual operations varies considerably based on scale, efficiency, market access, and financial position.
What doesn’t vary is the need to understand where your operation actually stands. Not where you hope it is. Not where it was last year. Where it is right now—with $0.85-0.92 less per hundredweight baked into every milk check for the foreseeable future.
That understanding is where every good decision starts.
KEY TAKEAWAYS
What Happened:
- $337 million vanished from milk checks in 90 days—markets held steady; FMMO formulas didn’t
- Class III took the biggest hit: -92¢/cwt from the make allowance increases effective June 1, 2025
- Regional damage: Upper Midwest -$64M | Northeast -$62M | California -$55M
- The $100M timing gap: USDA implemented producer costs on June 1; producer benefits waited until December 1
Your Move:
- Calculate your exposure now: annual cwt × $0.85 = your Class III loss. Policy fixes won’t reach checks until 2028—your positioning decisions can’t wait.
Editor’s Note: Data in this article comes from USDA Agricultural Marketing Service announcements, American Farm Bureau Federation analysis, farm business summary data from university extension services, and Federal Order pool statistics. Regional and farm-level impacts vary based on specific circumstances. In an upcoming investigation, we’ll examine how farmer-owned cooperatives navigated the FMMO hearing process and whether member interests were adequately represented. We welcome producer feedback at editor@thebullvine.com
Complete references and supporting documentation are available upon request by contacting the editorial team at editor@thebullvine.com.
Learn More
- Dairy Tech ROI: The Questions That Separate $50K Wins from $200K Mistakes – Secure a measurable return on every tech dollar by cutting through vendor hype. This breakdown arms you with a ruthless framework to ensure automation investments actually expand your margins instead of just adding complexity.
- The $11 Billion Reality Check: Why Dairy Processors Are Banking on Fewer, Bigger Farms – Gain a strategic roadmap for navigating the $11 billion processing surge. This analysis exposes the high-stakes game where exclusive contracts are replacing the open pool, revealing how to lock in your farm’s future.
- Squeezed Out? A 12-Month Decision Guide for 300-1,000 Cow Dairies – Modernize your herd’s profitability by pivoting from volume to protein. This guide delivers a 12-month blueprint for mid-sized operations to realign their genetics before today’s breeding decisions become obsolete in a shifting market.
 Join the Revolution!
 Join the Revolution!
Join over 30,000 successful dairy professionals who rely on Bullvine Weekly for their competitive edge. Delivered directly to your inbox each week, our exclusive industry insights help you make smarter decisions while saving precious hours every week. Never miss critical updates on milk production trends, breakthrough technologies, and profit-boosting strategies that top producers are already implementing. Subscribe now to transform your dairy operation’s efficiency and profitability—your future success is just one click away.


