


Milk prices are up, but the world’s awash in milk. Have you actually run the 2026 risk math on your own herd yet?
Executive Summary: Early‑2026 dairy markets finally show some life, with GDT and CME prices moving higher, but global milk production is still expanding in the US, EU, New Zealand, and South America. That leaves us in a classic “relief rally” sitting on top of a wall of milk, as USDA forecasts more US output in 2026 and European and South American exports keep pressure on world prices. Cheaper feed has helped, yet many herds remain just one dollar per hundredweight away from losing—or gaining—six‑figure income, especially at 400–600 cows. This feature turns that big‑picture tension into simple margin math and walks you through what to do next: how much milk to lock in, how to rethink your cull list, and why components and fresh cow management matter more than ever. It doesn’t promise a magic fix; instead, it gives owners and managers a realistic playbook to de‑risk 2026 while keeping long‑term genetics and herd strategy in mind. If you want to stop guessing and start making deliberate moves in this rally, this is the article you read before your next marketing and herd meeting.

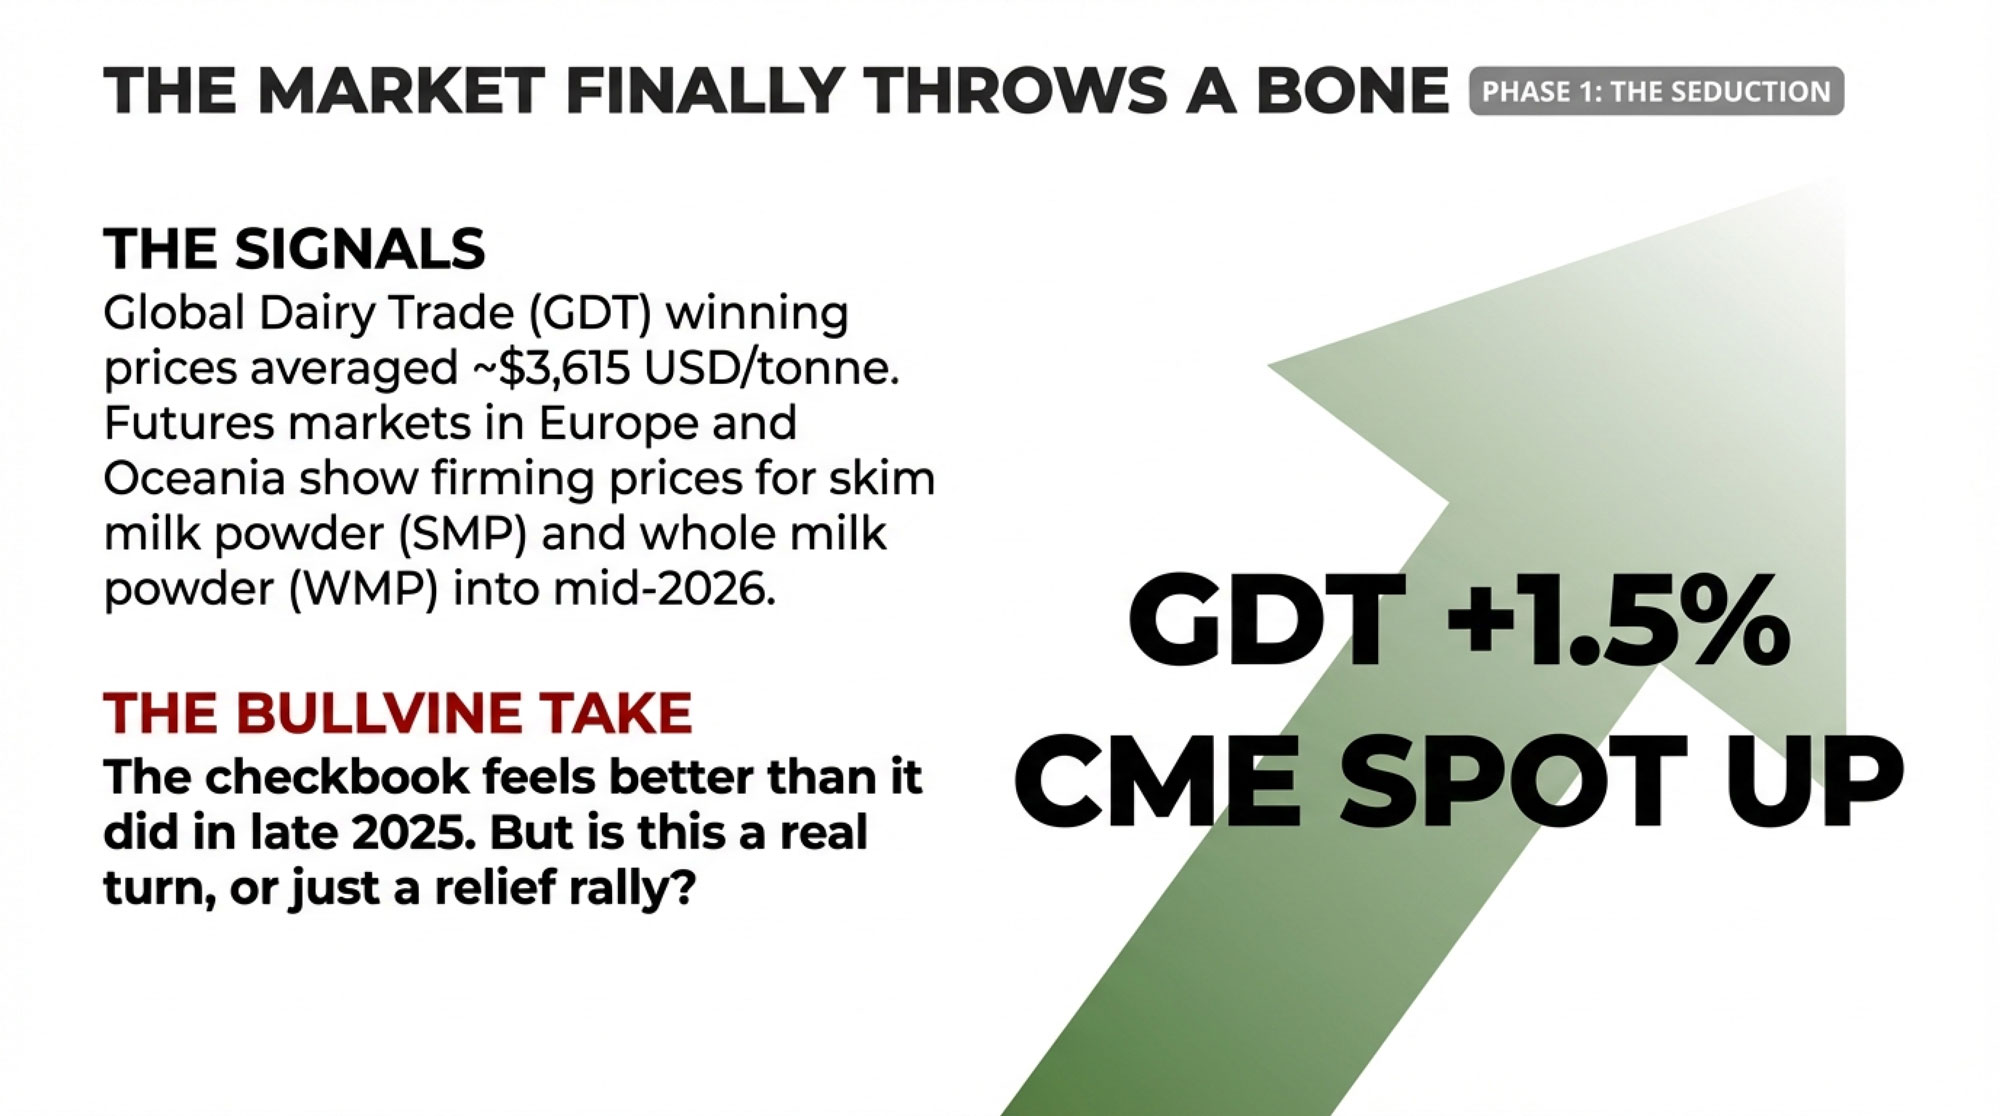
You know that feeling when the market finally throws you a bone, and you’re not sure whether to trust it? That’s exactly where dairy is sitting as we get into 2026.
The Global Dairy Trade (GDT) index has just put together back‑to‑back gains. At the January 20, 2026, auction, market reports from Trading Economics show the GDT Price Index up 1.5%, with the average winning price around 3,615 US dollars per tonne, building on a 6.3% jump at the previous event. CME spot prices have turned green as well, with recent coverage highlighting higher butter, nonfat dry milk, and cheddar block values compared to late 2025.
| Region | Jan 2025 | Apr 2025 | Jul 2025 | Oct 2025 | Jan 2026 (Forecast) | Apr 2026 (Forecast) | Jul 2026 (Forecast) | Oct 2026 (Forecast) |
|---|---|---|---|---|---|---|---|---|
| US | 19,200 | 19,600 | 20,100 | 20,400 | 20,700 | 21,000 | 21,400 | 21,600 |
| EU | 8,100 | 8,200 | 8,300 | 8,250 | 8,300 | 8,350 | 8,400 | 8,380 |
| New Zealand | 2,800 | 2,950 | 2,750 | 2,600 | 2,680 | 2,850 | 2,900 | 2,750 |
| South America | 1,400 | 1,450 | 1,480 | 1,510 | 1,550 | 1,600 | 1,630 | 1,660 |
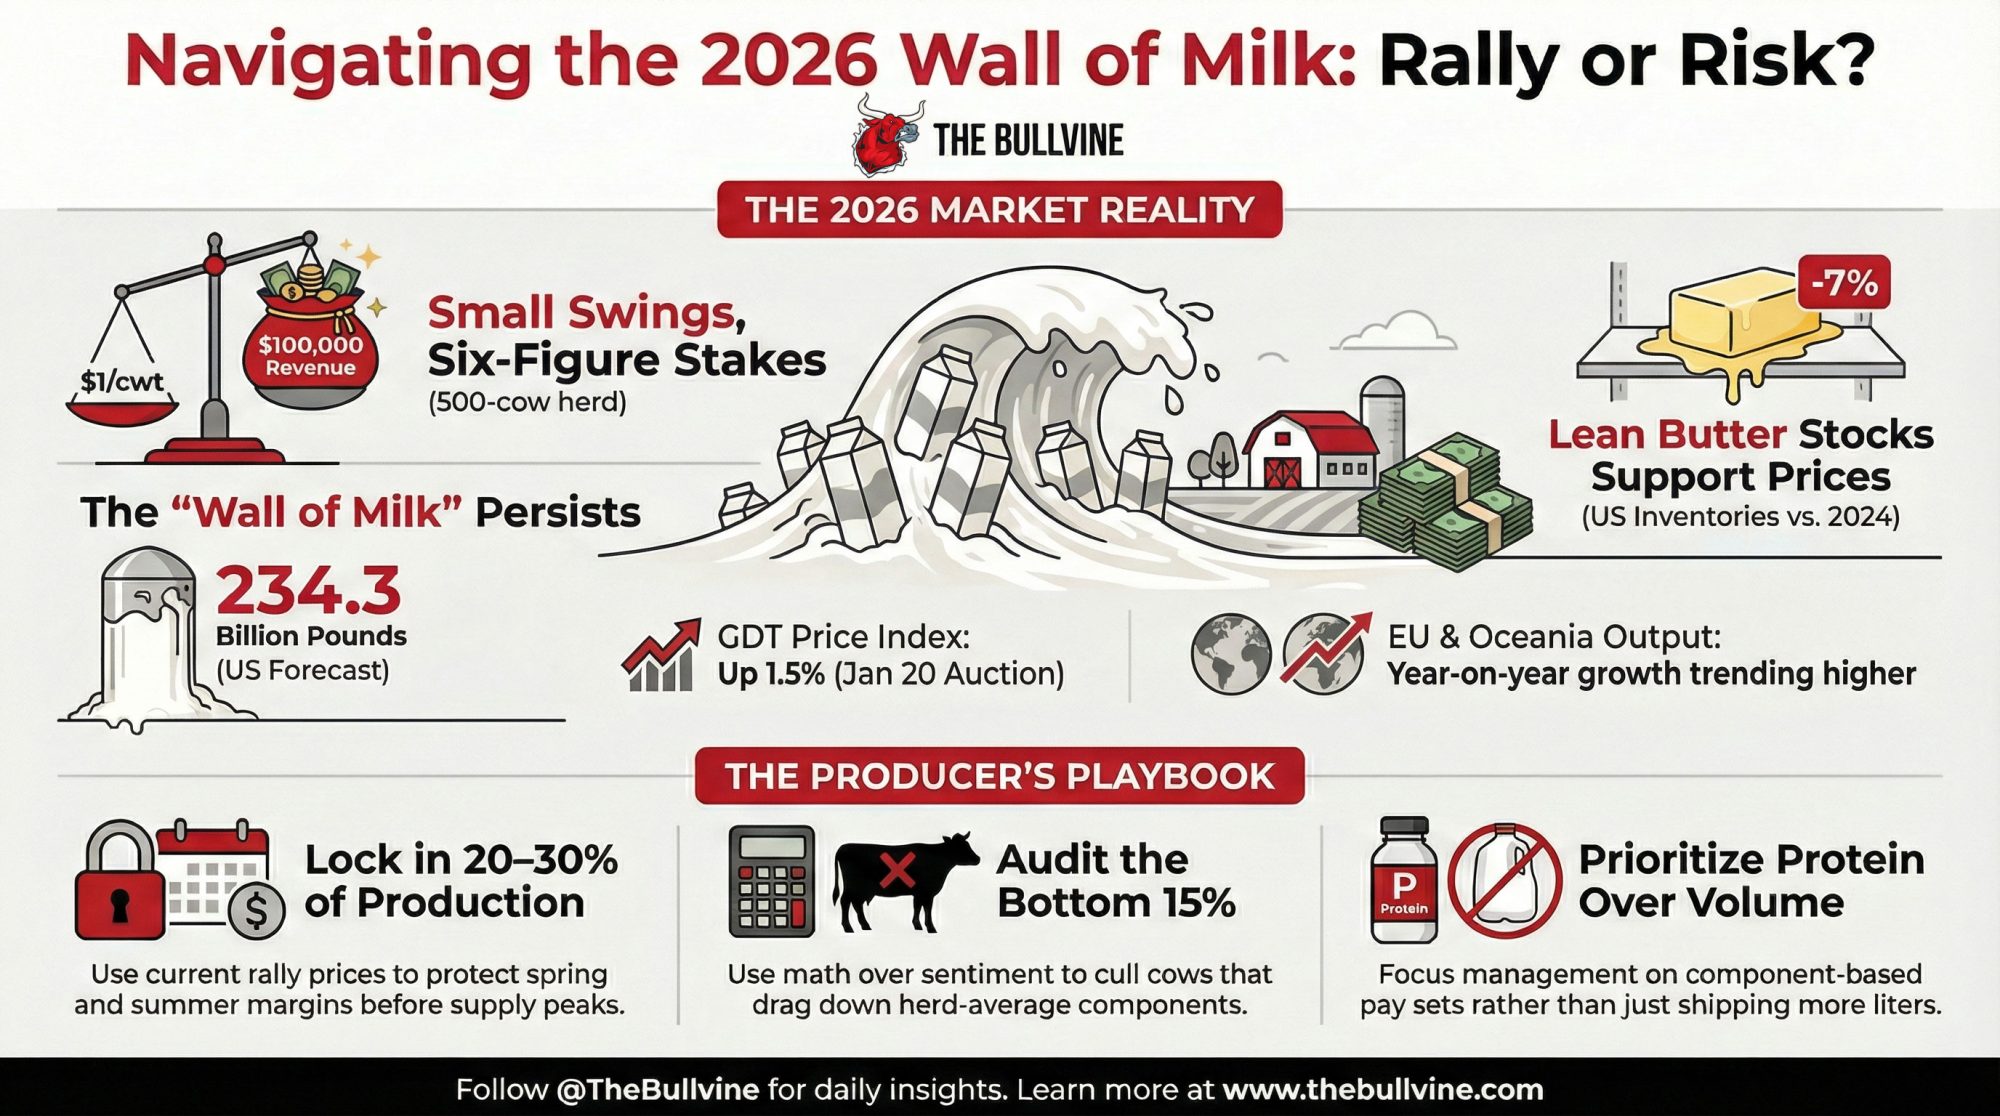
What’s interesting here is that this little rally is showing up while both USDA and global analysts are still talking about milk supply outpacing demand through at least early 2026. USDA’s January outlook, as reported by Dairy Star, puts 2026 US milk production at about 234.3 billion pounds—roughly 1.4% above 2025. A summary of global conditions bluntly warned that milk supply is set to outpace demand in early 2026, echoing similar concerns in other industry outlooks.
So the real question a lot of you are quietly asking—whether it’s in a freestall in Wisconsin or a tie‑stall barn in Quebec—is simple: is this a real turn, or just a dead‑cat bounce in a still‑oversupplied world?

Let’s frame the stakes. On a 500‑cow herd, a one‑dollar‑per‑hundredweight swing in milk price moves annual revenue by roughly 100,000 dollars. That simple math comes straight from basic revenue calculations: price times hundredweight sold. It’s the kind of back‑of‑the‑envelope number that dairy economists and extension folks often use when they talk about income risk per herd. That’s why getting this call even roughly right matters a lot more than just the color on your market screen.
A Quick Snapshot Of Where We’re At

Looking at the latest numbers:
At that January 20 GDT event, official summaries show whole milk powder up about 1%, skim milk powder up roughly 2.2%, butter gaining about 2.1%, and anhydrous milkfat (AMF) up around 3%. Total volume sold was just under 28,000 tonnes, with more than 160 bidders active. That’s a decent mix of product strength and participation.
On the supply side, USDA and industry outlets like Dairy Star report that US milk output has been trending higher into late 2025, and the 2026 production forecast of 234.3 billion pounds confirms that they expect more, not less, milk in the system. Coverage of Europe and Oceania points to year‑on‑year growth in milk collections in many key exporting regions, too.
And then there’s storage. Reports that at the end of 2025, butter stocks sat around 199.3 million pounds in US cold storage—roughly 7% lower than a year earlier—but cheese inventories were higher than mid‑year levels, reflecting strong production but also resilient export demand.
So yes, prices are better than they were in late 2025. But the wall of milk hasn’t magically disappeared.

| Product | Late 2025 Low | Jan 20, 2026 (GDT) | 2024 Average | % Gain (Late 2025 → Jan 2026) |
|---|---|---|---|---|
| Butter ($/tonne) | 3,400 | 3,670 | 4,200 | +7.9% |
| Skim Milk Powder ($/tonne) | 2,100 | 2,150 | 2,850 | +2.4% |
| Cheddar ($/lb) | 1.62 | 1.68 | 1.95 | +3.7% |
GDT’s “Less Product, Higher Price” Moment
What farmers are finding is that the tone at GDT finally feels different than it did in the second half of 2025. A Cheese Reporter summary notes that the January 20 auction saw the GDT Price Index rise 1.5%, with fats and powders mostly stronger. Earlier coverage flagged a shift in late 2025 toward fewer products offered at auction, which often puts upward pressure on prices even if underlying demand is only steady.
Here’s what I think is worth noting: this isn’t just buyers suddenly waking up hungry. Put it plainly in a feature called “Global Dairy Trade: Less Product, Higher Price”—exporters have been trimming offer volumes and tightening how much skim they dry into powders. That supply‑side adjustment is a big part of what’s lifting GDT, alongside stable—rather than booming—demand.
Rabobank’s global dairy commentary, summarized in several industry interviews and articles, has been consistent: they see global supply still running slightly ahead of demand through at least mid‑2026, particularly in the US and EU, which limits the upside of these early‑year price moves. So the rally is real, but it’s growing on a pretty thin root system.
Futures: Hope With A Side Of Caution
If you look at how people are betting with real money, European and Singapore futures markets tell a similar story. Reporting in Dairy Global and other trade outlets notes that SMP and WMP strips on European and Oceania exchanges have firmed several percent for the first half of 2026, while butter values have been slower to move or even softened slightly in some contract periods.
To me, this development suggests two things at once:
- Markets are willing to pay a bit more for powder and fat into mid‑2026 than they were in late 2025.
- At the same time, the more muted response in butter curves underscores that traders don’t believe the oversupply problem is solved.
For those of you whose milk cheques are influenced by European or Oceania references—either directly or through export pools—those curves are an early warning light. They’re signaling opportunity, but they are not signaling “party like it’s 2014.”
Europe: Cheaper Butter, Plenty Of Milk
Looking at this trend in Europe, price and volume aren’t exactly moving in the same direction.
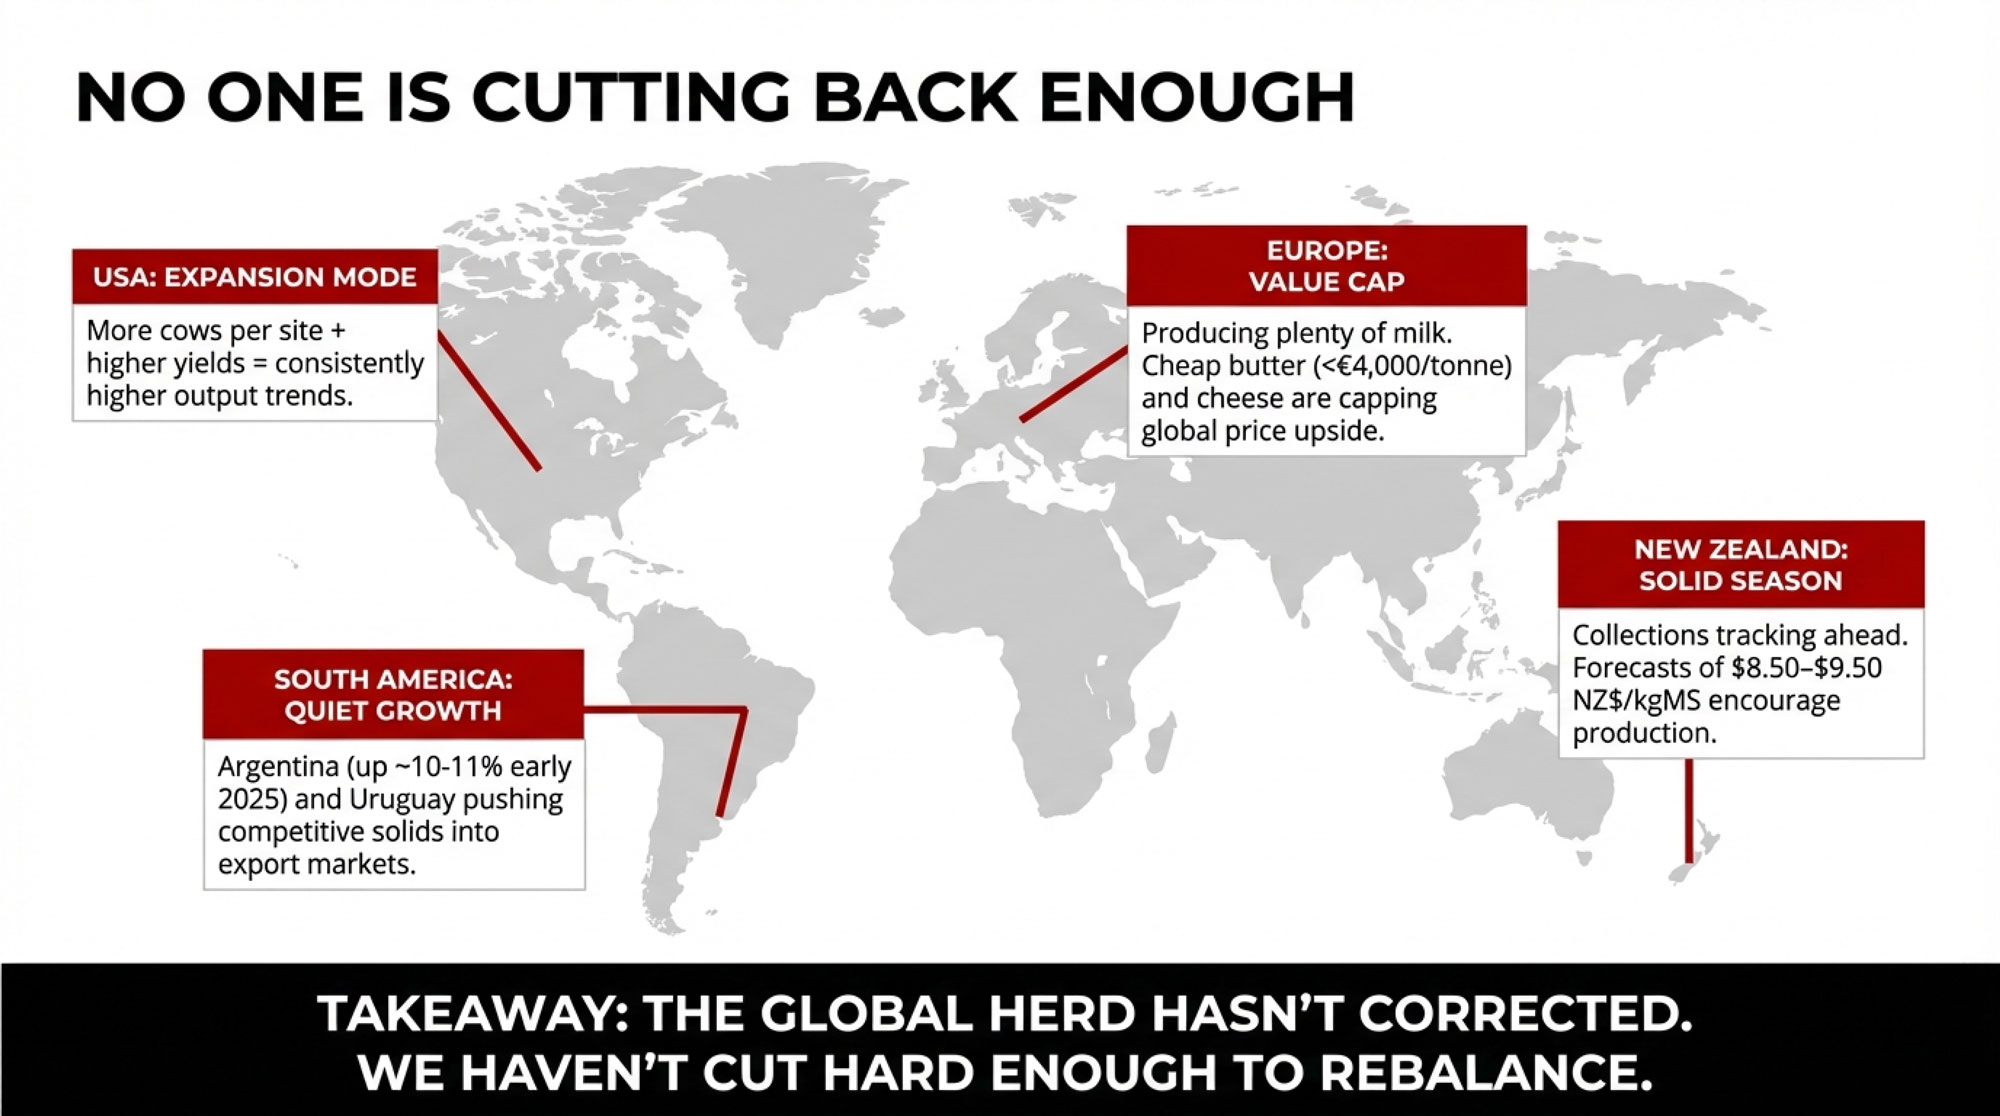
Reports show that European butter prices were heading toward or even dipping below 4,000 euros per tonne as 2025 wound down and 2026 began, a sharp drop from the higher levels seen a year earlier. Skim milk powder prices have stabilized somewhat from their lows but remain notably lower than 2024 values. Cheese values in Europe—cheddar, gouda, and mozzarella—have also been trading at discounts to year‑ago levels, according to EU market summaries and price transmission studies on the UK dairy market.
On the volume side, AHDB and EU‑focused market reports show that milk deliveries across Western Europe, including key producers like the Netherlands and the UK, have been running ahead of 2024 levels, helped by relatively favorable weather and stable herd sizes. An AHDB beef market update also notes a forecast of tighter Irish cattle numbers down the road, which reflects some structural shifts, but doesn’t suggest a dramatic collapse in dairy cow numbers in the short term.
In plain terms, Europe is still putting a lot of milk through butter and cheese plants even as prices have eased. That cheap European cheese and butter is exactly the kind of competition that caps how far US and Oceania values can go before buyers in import regions switch to a different origin.
US, NZ, South America, Australia: Where The Milk Is Coming From
United States: More Cows, More Milk
On the US side, USDA and market summaries make it pretty clear: milk production has been trending higher into 2025, and the 2026 forecast of 234.3 billion pounds reflects an expectation of continued growth. Coverage of monthly production reports show repeated year‑over‑year gains in milk output through late 2025.
It’s worth noting that USDA commentary captured in pieces like “USDA Expects More Cows, More Milk, More Dairy Products” points to both herd expansion and strong yield per cow as drivers of that growth. That aligns with what many of us have seen visiting freestalls in the Midwest—more cows per site, better genetics and management, and higher pounds.
At the same time, milk supply is on track to outpace demand in early 2026, which suggests that, collectively, we haven’t cut hard enough to rebalance. Cull cow data and packer commentary through 2024 suggest slaughter has not spiked the way it did in some earlier margin squeezes, in part because strong beef prices have helped cash flow and encouraged some herds to hang on to marginal cows a bit longer.
From what I’ve seen sitting at kitchen tables in Wisconsin and New York, it’s that emotional tug—“give her one more lactation”—that often keeps the bottom of the herd fatter than the balance sheet can support.
New Zealand: Solid Season, Tight Margins
Down in the New Zealand market, trend coverage shows that national milk collections were running a couple of percent ahead of the previous season as 2025 wrapped up, with both volume and milk solids up year-on-year.
At the same time, Fonterra has updated its 2025/26 farmgate milk price forecast range more than once. In a September 2025 agribusiness note, Rabobank’s Australia/New Zealand team referenced Fonterra’s mid‑range forecast near 9.00 NZ$/kgMS after some adjustments. Reuters and other market outlets have also reported a revised forecast band around 8.50–9.50 NZ$/kgMS in late 2025.
What producers are finding in pasture‑based systems—whether that’s Canterbury or Taranaki—is that this mix of slightly higher production and a decent but not spectacular payout puts more pressure on butterfat performance, pasture utilisation, and fresh cow management. University of Waikato and DairyNZ extension pieces have shown that smart grouping, effective transition period management, and mitigating heat stress can increase milk solids per hectare without massive capital investment.
South America: Quiet But Growing
In South America, Argentina is a good example of a region that’s not huge on its own but matters at the margins. A 2025 summary from Tridge, based on Argentina’s official dairy statistics, shows milk production up roughly 10–11% in early 2025 compared with the same period a year earlier, with especially strong growth in March. Dairy Global has similarly reported improved performance in Argentina’s dairy sector, driven by better margins and stronger management.
Uruguay has been posting sustained increases in milk production as pasture conditions improved and prices encouraged expansion. All of that adds another flow of competitively priced solids into the world powder and cheese markets.
Australia: Modest Recovery, No Surge
Australia, as Rabobank and FCC’s dairy outlook work emphasize, has not recovered to its historical production peaks. Years of drought, high water costs, and herd reduction have shrunk the base. Current forecasts see only modest growth into 2026—more of a crawl upward than a surge.
Australia still matters in certain niches, especially for some cheese and ingredient trade into Asia, but it’s no longer large enough to be the swing producer that rebalances the global market on its own.
China: Resilient Demand, But Not A Bottomless Sink
No matter where you milk cows, China is still a critical piece of your milk cheque.
Reports show that China has cut back on some categories of dairy imports in recent years, especially lower-value powders, as domestic production increased, but has continued to bring in substantial volumes of butter, cheese, whey, and other high‑value products. A 2023 study on China’s milk and import markets in Cogent Economics & Finance also showed that rising imports of milk powders and dairy ingredients have significant impacts on domestic price dynamics, underlining how intertwined China is with world dairy markets.
USDA and AHDB estimates place Chinese raw milk production in the low‑40‑million‑tonne range in recent years—up sharply from a decade ago as they’ve invested heavily in domestic herd expansion and modernisation. So China remains a big, important buyer, but it’s no longer the bottomless sink it once seemed when domestic production was far smaller.
On the policy side, industry news through 2024–2025 has highlighted growing trade friction between China and several trading partners, including the EU, across a range of ag products. Some coverage has raised the possibility of additional duties on certain dairy categories, although precise tariff levels and timing remain uncertain. If those duties materialize, buyers may pivot more toward Oceania, the US, and South America, while EU exporters push more cheese and fats into other markets.
For producers under quota in Ontario or Quebec, the take‑home isn’t “ship more litres because China’s there.” It’s to keep a close eye on butterfat and protein tests, over‑quota penalties, transport charges, and any changes to pooling as processors juggle export and domestic opportunities in response to this shifting trade landscape.
US Spot Markets: Butter Leads, Powders Catch Up
Back in Chicago, CME spot markets finally gave producers something positive to look at in early 2026. Market watchers reported that butter moved sharply higher in early January, with nonfat dry milk and cheddar blocks also gaining ground from late‑2025 lows.
Cold storage coverage shows that at the end of 2025, US butter stocks sat around 199.3 million pounds, about 7% lower than in December 2024. That’s not an emergency, but it does mean the butter pipeline isn’t bloated. When stocks are relatively lean, a bit of extra domestic retail demand or export buying can push prices around in a hurry.
On the powder side, US production data indicate that nonfat dry milk and skim milk powder output has been somewhat lighter than in some past years, as more skim is diverted into cheese and higher‑value protein products. That tighter dryer balance is one of the reasons NDM can rise even as national milk production grows.
Cheese stocks, according to the same cold storage reports, ended 2025 higher than mid‑year levels but not at record extremes. Solid US cheese exports to markets like Mexico have helped offset softer domestic foodservice demand. So cheese isn’t tight, but it’s not disastrously long either.
Margins: Cheaper Feed, But Not Enough Milk Price
Here’s where things get uncomfortable.
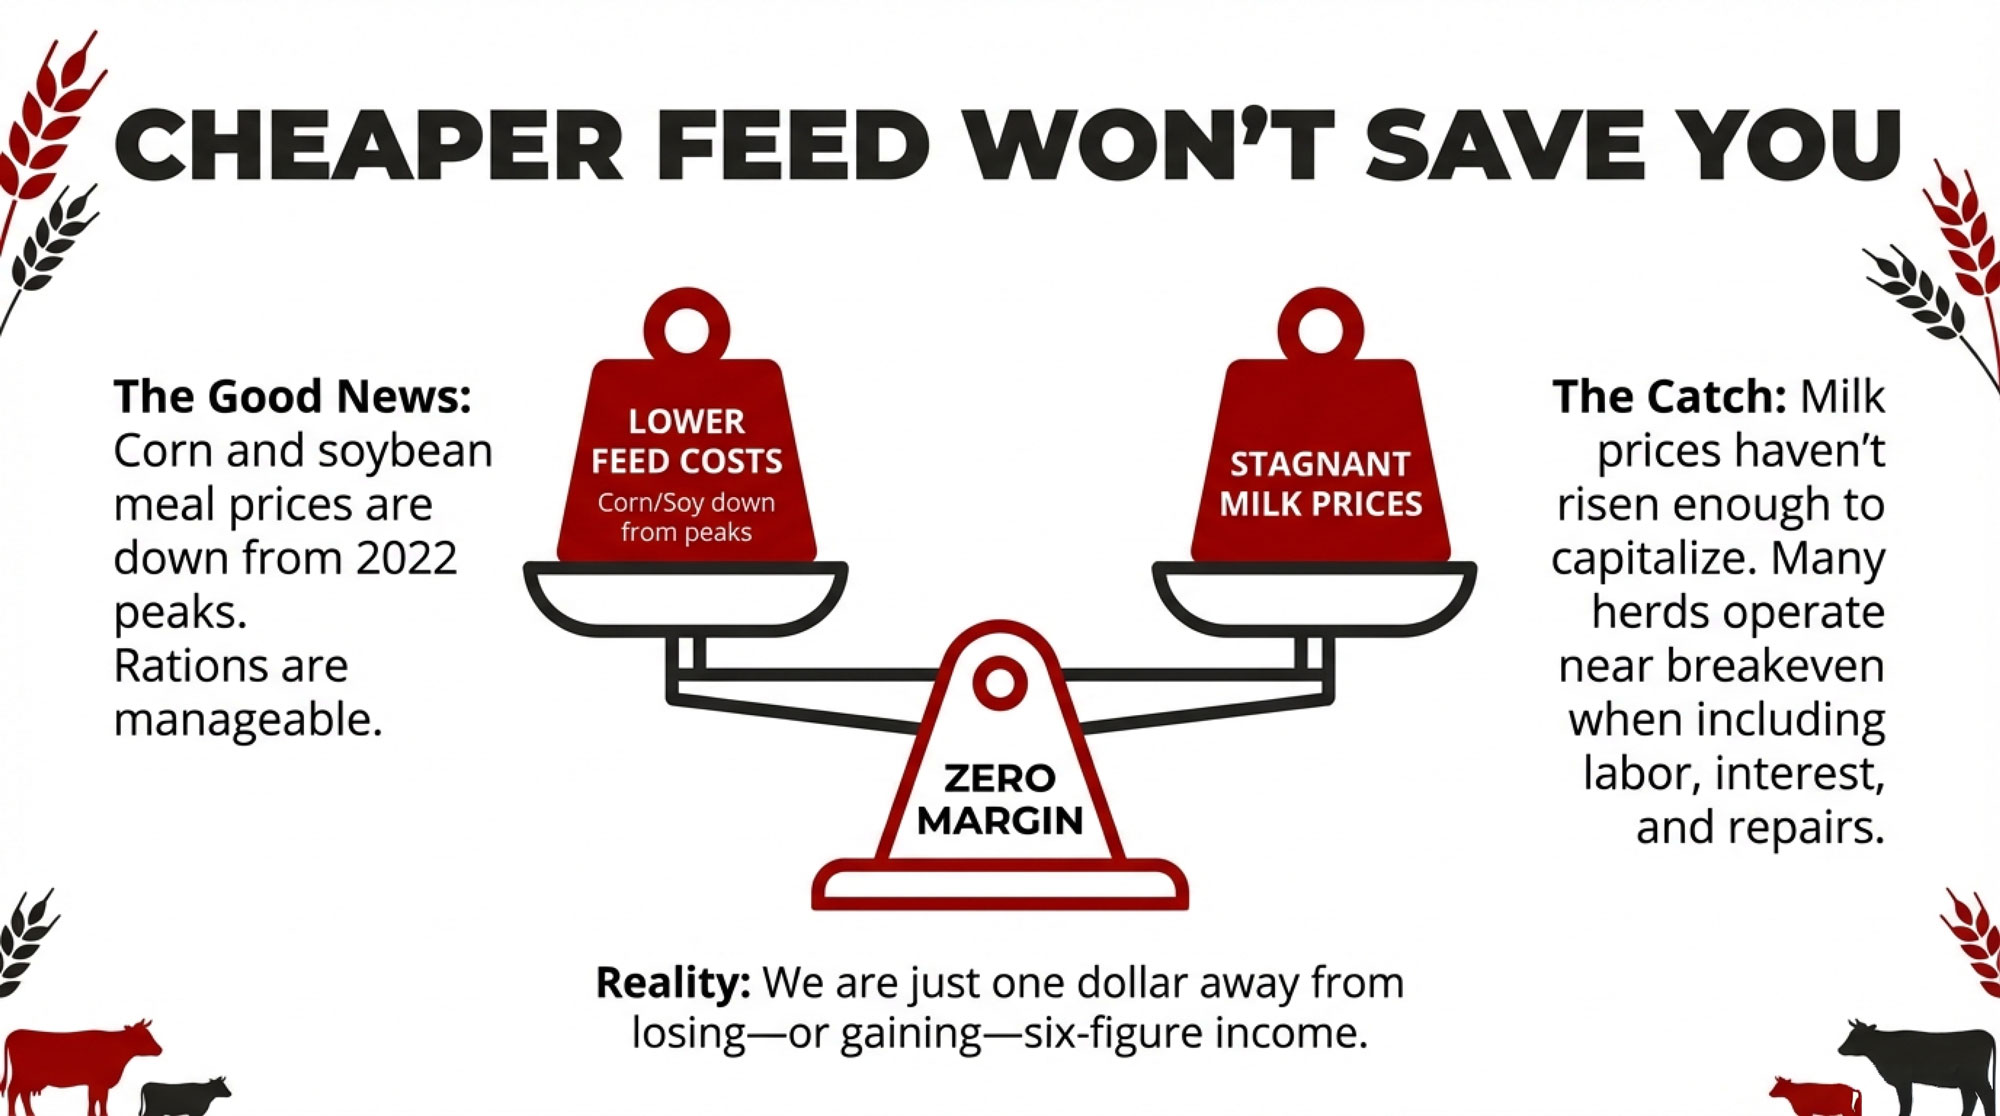
Feed costs are, thankfully, not where they were in 2021–2022. Corn and soybean meal prices have come off their peaks, a trend highlighted in several 2023–2025 dairy outlooks from FCC. Many of you in the Midwest have told me that ration costs feel “manageable again” compared to a couple of years ago.
The problem is that milk prices haven’t risen enough to turn those cheaper inputs into healthy margins for most operations. FCC’s dairy sector outlook and US‑focused extensions of that thinking suggest that many herds are still operating near breakeven once full costs—labor, interest, repairs, and a reasonable return on capital—are factored in. USDA projections point to all‑milk prices in 2026 that are better than the worst of 2023 but still not generous.
To make that more concrete, let’s walk through some simple example of math. Take a 200‑cow freestall averaging 24,000 pounds per cow. That’s 4.8 million pounds, or 48,000 hundredweight, of milk sold. At 18.50 dollars per hundredweight, you’re looking at about 888,000 dollars in milk revenue. If your true cost is 19.00—including feed, labor, interest, repairs, and basic reinvestment—that turns into roughly a 24,000‑dollar loss before family labor or any return on equity.
Now scale that up to 500 cows, and a one‑dollar‑per‑hundredweight gap can easily translate into a six‑figure swing in annual income. That’s the kind of gap you don’t fix by squeezing another kilo of milk out of the bottom tail of the herd.
Margin risk remains real even as headline prices improve. That’s why risk tools like Dairy Margin Coverage (for smaller US herds), Dairy Revenue Protection, and forward contracting are still front‑of‑mind in a lot of conversations with producers and advisors.
| Herd Size | Milk Price | Annual Milk Output (lbs) | Gross Revenue |
|---|---|---|---|
| 200 cows @ 24k lbs/cow | — | — | — |
| — | $17.50/cwt | 4,800,000 | $840,000 |
| — | $18.50/cwt | 4,800,000 | $888,000 |
| — | $19.50/cwt | 4,800,000 | $936,000 |
| 350 cows @ 24.5k lbs/cow | — | — | — |
| — | $17.50/cwt | 8,575,000 | $1,500,625 |
| — | $18.50/cwt | 8,575,000 | $1,586,375 |
| — | $19.50/cwt | 8,575,000 | $1,672,125 |
| 500 cows @ 25k lbs/cow | — | — | — |
| — | $17.50/cwt | 12,500,000 | $2,187,500 |
| — | $18.50/cwt | 12,500,000 | $2,312,500 |
| — | $19.50/cwt | 12,500,000 | $2,437,500 |
The Playbook: How To Use This Rally Before It Turns On You
So what do you actually do with all of this? Let’s get practical.
1. Use The Rally To Take Some Risk Off The Table
Right now, you’ve got:
- A couple of GDT events are showing higher prices across key commodities.
- CME spot markets that have climbed off their lows in butter, NDM, and cheddar.
- A global outlook from the USDA are still warning that supply could outpace demand in early to mid-2026.
So instead of asking “how high can this go?”, the more profitable question might be “how much of my risk can I reasonably take off the table here?”

That often looks like:
- Sitting down with your buyer or risk advisor and discussing whether to lock in 20–30% of your expected spring and summer milk at today’s levels if the basis works for you. This is the kind of partial coverage that FCC and extension economists often recommend when margins are fragile but not catastrophic.
- If your milk cheque is heavily influenced by Class IV, using this stronger butter and NDM environment to revisit DRP coverage or processor contracts that give you some downside protection.
- For quota herds, watching over‑quota penalties and transport charges just as closely as headline pay price, since those can erase the benefit of chasing a rally with extra volume.
The goal isn’t to guess the top. It’s to make sure you won’t be exposed if this turns out to be a bounce, not a bull run.
2. Be Brutally Honest About Your Herd List
I’ve noticed that in just about every downcycle, there’s a point where the spreadsheets say “ship some cows,” but the heart says “she’s been good to us, one more lactation.” That’s human. But the current margin environment doesn’t have a lot of room for sentiment at the very bottom of the list.

Analysts tracking slaughter and coverage from beef and dairy outlets suggest that culling has been lighter than some past squeezes, even as milk output keeps growing. That’s exactly the behavior that makes supply‑demand imbalances linger.
| Metric | 2023 (Normal Cycle) | 2025 (Actual) | 2026 (Supply-Balanced Target) |
|---|---|---|---|
| Starting Inventory (Jan) | 9.35M | 9.42M | 9.42M |
| Cows Needed for Production | 9.10M | 9.20M | 8.95M |
| Surplus (Over-herd) | 0.25M | 0.22M | 0.47M |
| Actual Culls (year) | 0.18M | 0.15M | — |
| Culls Needed (Supply Balance) | 0.20M | 0.27M | 0.47M |
| Culling Shortfall | -0.02M | -0.12M | — |
So it’s worth sitting down with your vet, nutritionist, or trusted advisor and asking some pointed questions:
- Which cows actually generate a positive margin once we charge them for feed, labor, stall space, and the opportunity cost of not having a younger cow in that spot?
- Which fresh cows aren’t hitting their targets for milk and components, even with good fresh cow management in transition?
- Is the bottom 10–15% of the herd dragging down average butterfat and protein enough to cost you more in lost premiums than they bring in on gross volume?
A 2024 systematic review in the journal Dairy on milk quality and economic sustainability underscored how subclinical mastitis, lameness, and other health issues hit both yield and component quality, and how strongly that feeds into farm profitability. Another 2024 paper on mastitis risk modeling reinforced the importance of key transition-period management to prevent costly hits. You don’t need those papers to tell you what you already know—but they confirm that this isn’t just a “nice to have” detail. It’s real money.
Every system—tie‑stall, freestall, robotic milking setups, dry lot systems—will make different decisions about which cows stay and which ones go. But the global picture shows that, at a macro level, we’ve collectively kept more cows than the market wants.
| Bulk Tank Profile | Butterfat % | Protein % | Monthly Milk Cheque (Est. 300-cow, 72k lbs/month) |
|---|---|---|---|
| Below Average | 3.5% | 2.85% | $18,720 |
| Average (Regional Benchmark) | 3.7% | 3.0% | $19,440 |
| Above Average | 3.9% | 3.15% | $20,808 |
| Premium (Top 15%) | 4.1% | 3.25% | $22,176 |
| Bulk Tank Profile | Monthly $ vs. Average | Annual $ vs. Average |
|---|---|---|
| Below Average | -$720 | -$8,640/year |
| Average | $0 | $0 |
| Above Average | +$1,368 | +$16,416/year |
| Premium | +$2,736 | +$32,832/year |
3. Follow The Protein Story, Not Just Butter Headlines
Butter tends to get all the attention. But what’s been growing for years is demand for dairy protein—whey, milk protein, and specialty fractions—both in sports nutrition and in the healthy aging markets. Reviews on protein markets and functional dairy ingredients, along with industry investment in membrane and fractionation facilities, confirm that trend.

For your farm, that usually shows up in three ways:
- Component‑based payment structures that put more dollars on protein and fat, not simply volume. That evolution has been documented in price transmission research on the UK and other markets, as well as in economic analyses of milk quality.
- Genomic proofs and breeding strategies that place more emphasis on components, health, and fertility traits (Net Merit, Pro$, LPI-type indexes) that better reflect long‑term profitability than just raw milk yield.
- The realisation that diseases like subclinical mastitis and lameness don’t just nick your bulk tank—they hit the more valuable parts of the cheque.
What I’ve found is that one of the most useful reality checks is simply tracking kilograms or pounds of protein sold per cow per day and comparing that to extension or milk board benchmarks for your region. If you’re below the pack, the fix isn’t always “buy more expensive feed.” Sometimes it’s cow comfort, stall design, milking routine, or getting more aggressive about removing chronic low‑component cows from the herd.
So…Is This Rally Real Or Not?
Here’s my straight answer.
The rally is real in the sense that prices at GDT, CME, and on the futures boards are higher than they were in the second half of 2025. What’s encouraging is that demand, especially for higher‑value fats and proteins, has held up reasonably well despite all the economic noise.
At the same time, USDA and most media are all singing from roughly the same choirbook on one big point: unless something changes, milk supply is likely to outpace demand into early‑to‑mid 2026. That doesn’t mean disaster, but it does mean the room for error is small.
From where I sit, this looks and feels like a relief rally, not the start of a multi‑year bull run. That doesn’t make it any less useful—if you use it.
In the last few cycles—2009, 2016, 2020—the herds that came out stronger weren’t the ones that magically picked the top of the market. They were the ones that:
- Used every rally to take a bit of price risk off the table.
- Used every downturn to get more honest about their cow list, cost structure, and genetics strategy.
As we head into spring flush, your job isn’t to predict the exact GDT index three months from now. It’s to make sure you’re not naked if this bounce runs out of steam.
That means knowing your breakeven to the penny. It means deciding how much milk you’re willing to lock in if the market gives you a shot. And it means making a conscious decision on herd size and culling based on math and long‑term strategy, not habit or pride.
The wall of milk is still there. But the market is at least starting to respect good product again. You can’t control what Europe does, or how many containers China books this quarter. You can control how exposed your farm is if this rally turns out to be shorter than we’d all like.
And in 2026, that might be the most profitable decision you make.
Key Takeaways
- Rally is real, but fragile: GDT and CME prices are up in early 2026, yet global milk supply keeps growing—analysts call this a relief rally sitting on a wall of milk.
- Supply isn’t slowing: USDA forecasts US milk output up 1.4% in 2026; EU, NZ, and South America are all still adding volume to world markets.
- Margins are razor-thin: A 1 dollar per cwt swing moves roughly 100,000 dollars on a 500-cow herd—there’s almost no room for error.
- De-risk now, not later: Lock in 20–30% of expected production, revisit Class IV coverage, and audit your cull list before spring flush hits.
- Components beat volume: Shift breeding and management toward protein and butterfat performance—that’s where processor money is heading long-term.
Complete references and supporting documentation are available upon request by contacting the editorial team at editor@thebullvine.com.
Learn More
- Profitability Over Pride: Why the Bottom 10% of Your Herd is Killing Your Margin – Gain immediate cash flow protection by applying a ruthless framework to identify the “passengers” in your freestall. This guide exposes the hidden costs of sentiment and delivers a step-by-step protocol to stabilize your bottom line.
- The 2030 Global Dairy Outlook: Structural Shifts Every Producer Must Anticipate – Reveals the seismic shifts in trade policy and consumer habits redrawing the global map. This analysis equips you to position your operation for the next decade by aligning production with emerging high-value export streams.
- Precision Breeding: Using Genomics to Hard-Wire Your Paycheck for Component Premiums – Breaks down how the industry’s most profitable herds use precision genomics to bypass “white water” production. It reveals the sire selection methods that bake higher fat and protein tests directly into your herd’s future DNA.
 The Sunday Read Dairy Professionals Don’t Skip.
 The Sunday Read Dairy Professionals Don’t Skip.
Every week, thousands of producers, breeders, and industry insiders open Bullvine Weekly for genetics insights, market shifts, and profit strategies they won’t find anywhere else. One email. Five minutes. Smarter decisions all week.


