


Clearly, low milk prices have created challenges on dairy farms the past few years. Despite the struggle, dairymen and women have continued to deliver higher-quality milk to the marketplace nearly every year. This is perhaps one of dairy’s best-kept secrets, and it’s high time the story is broadcasted far and wide.
Superior milk quality is indicated when a herd has a low somatic cell count (SCC), which demonstrates the herd has (nearly) all healthy cows with normally-healthy mammary systems. Reduced somatic cell counts deliver improved shelf life for dairy beverages.
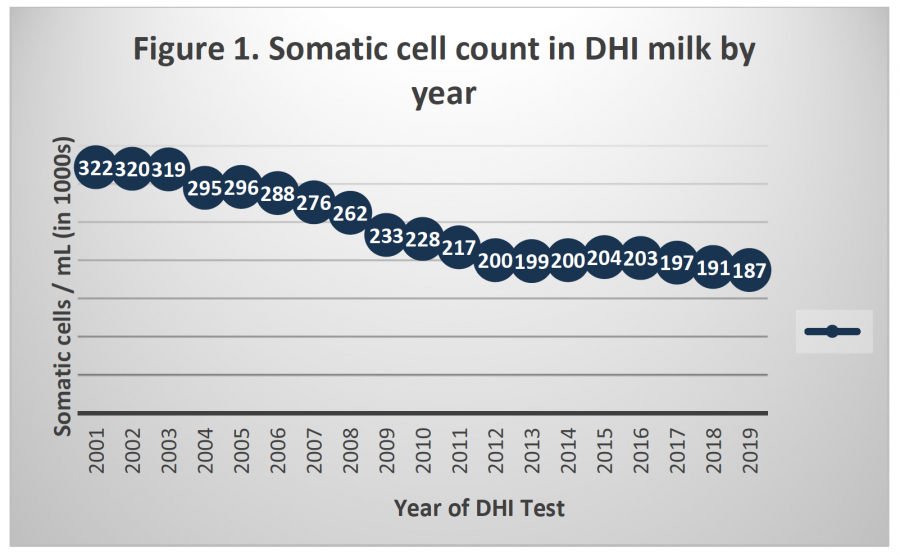
Review the improvements in SCC since the year 2000 in herds enrolled in the Dairy Herd Improvement (DHI) program (Figure 1), which reflects nearly half of all cows in the U.S. In 2001, U.S. milk had 322,000 somatic cells per milliliter. By 2013, a phenomenal reduction had been achieved, improving to 199,000 somatic cells per milliliter. Even though there was a slight uptick in 2014 and 2015, SCC has continued to decline in each of the last four years. Milk SCC decreased again this past year, from 191,000 cells per milliliter in 2018 to 187,000 cells in 2019. Further details can be found in the report, S omatic cell counts of milk from Dairy Herd Improvement herds during 2019.
Milk quality is just one example of the commitment of U.S. dairy farmers to continuous improvement. To achieve this improvement in somatic cell count, dairy producers have been diligent to provide a clean, well-maintained environment and best possible care to cows. Producers have also been able to selectively breed for improved milk quality, with the genetic evaluation for somatic cell score available since 1984. Considerable credit should also go to the milk processing companies who provided a premium or credit to producers for supplying low SCC milk, supporting increased cheese yield from the product. Also starting in 2000, pricing milk based on SCC was mandated in five of the 10 federal milk marketing orders.
Lower SCC is not the only improvement in U.S. milk quality … the amount of solids in the milk has been increasing as well over the last decade. Consumers of milk (whole, low-fat, skim milk) and creams are receiving more protein as a result. Figure 2 shows the change in protein percentage since 2009. An increase in the protein means a related increase in the solids-not-fat percentage. The increase in solids-not-fat has been documented to indicate higher preference for these fluid products during consumer testing. Other advantages include improved texture to ice cream and improved processing efficiency in the manufacture of most other dairy products.
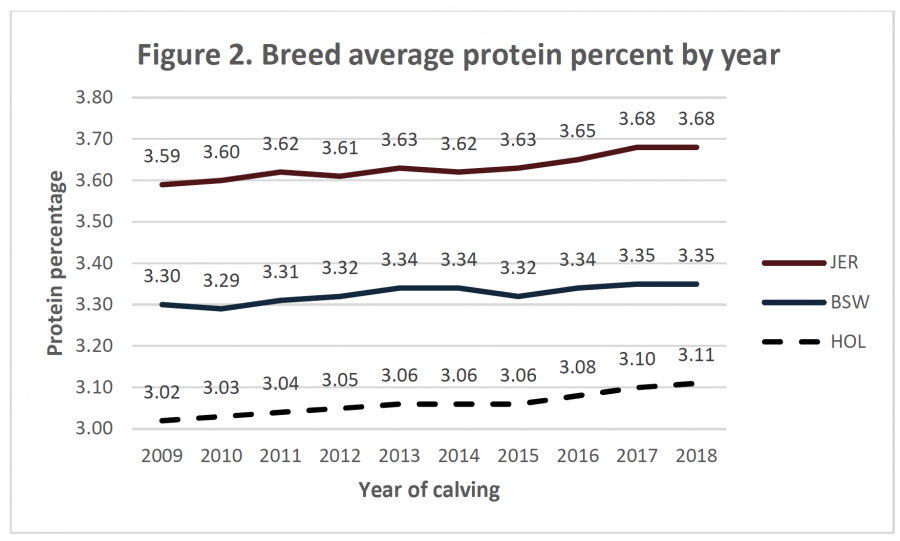
Figure 2 shows gains across years in the protein percentages for Brown Swiss (BSW), Holsteins (HOL) and Jerseys (JER). Three other breeds with smaller populations (Ayrshire, Guernsey, and Milking Shorthorn) are not presented in Figure 2, although they also had similar gains in percentages to the three breeds shown.
Although the increases in protein (Figure 2) may not appear as dramatic the somatic cell count improvements (Figure 1), these incremental improvements have tremendous total impact. For example, protein percentage increased for Holsteins from 3.02 to 3.11 percent over the 10-year period. Protein percentage for Jersey went from 3.59 to 3.68 percent. These changes represented a 3.0 and 2.5 percent increase in the protein concentration, respectively, which results in approximately 200 million pounds of extra milk protein carried in the annual U.S. production. Higher components lower the proportion of water in the milk and improve processing efficiencies, particularly in cheese production.
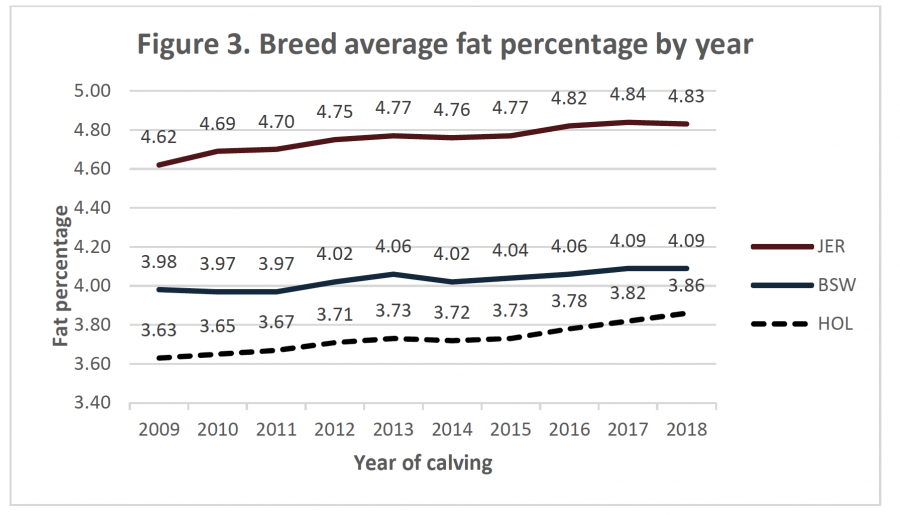
Fat percentage, another primary component in milk, changed as well over the past 10 years. Because fat content is normally standardized in fluid milk, it is not (naturally) influencing consumer preferences. Figure 3 shows the 10-year results of producers breeding for and/or feeding for higher milk fat percentage. Fat percentage climbed for Holsteins from 3.63 to 3.86 percent across the 10 years. Jersey fat percentage went from 4.62 to 4.83 percent. Theserepresent 6.3 and 4.5 percent higher fat concentration, respectively, and thus will result in nearly half-billion pounds of extra milk fat from the same volume of milk annually. Regardless of the numerous pricing systems used in the U.S., almost all milk processing companies compensate producers for any extra milk fat delivered.
The bottom line: Every year dairy producers are providing more desirable milk and contributing to improved efficiency in the production of cheese and other manufactured dairy products. Dairy producers deserve a huge THANK YOU from milk buyers for continuing to provide a higher-quality dairy product each year.


