Archive for Lifetime Profit Index

Total Merit Indexes: Are they helping or hurting?

If you haven’t worked in a trade show booth or attended a cattle show recently, you could very well be missing important genetic improvement discussions. Discussion about which traits breeders feel are at an acceptable level and which ones need to be improved. I suspect that few of you have worked a trade show booth but I can tell you, from front line experience, that bottom line focused breeders are not shy about saying that today’s dairy cattle are not functional enough, don’t get pregnant easily (may conceive but not retain)  and require too much worker time. Contrast that with the spectators at shows that talk about their ideal cow being tall, lean, tight uddered, deep ribbed and wide rumped.  Often front and center in all the discussions is which total merit index to use. Is it TPI, JPI, NM$, LPI, RZG, BW, TMI, NVI or another? Is any one total merit index capable of meeting the needs of all breeders?

Who is #1?

Every breeder or owner wants to have the #1 cow or bull. And back twenty to thirty years ago many bull owners bragged about having the #1. All-be-it they had the number one for Milk, Fat %, Fat Yield, Type or whatever. For the average breeder it was very  confusing. Which should they think was the #1 bull? In order to assist breeders, breed societies and genetic evaluation centers started publishing total merit indexes for bulls. Those indexes combined the production and type genetic indexes. It was reasoned that having a ranking system that combined all the traits was much superior to single trait marketing and selection.

Index Achievements & Short Falls

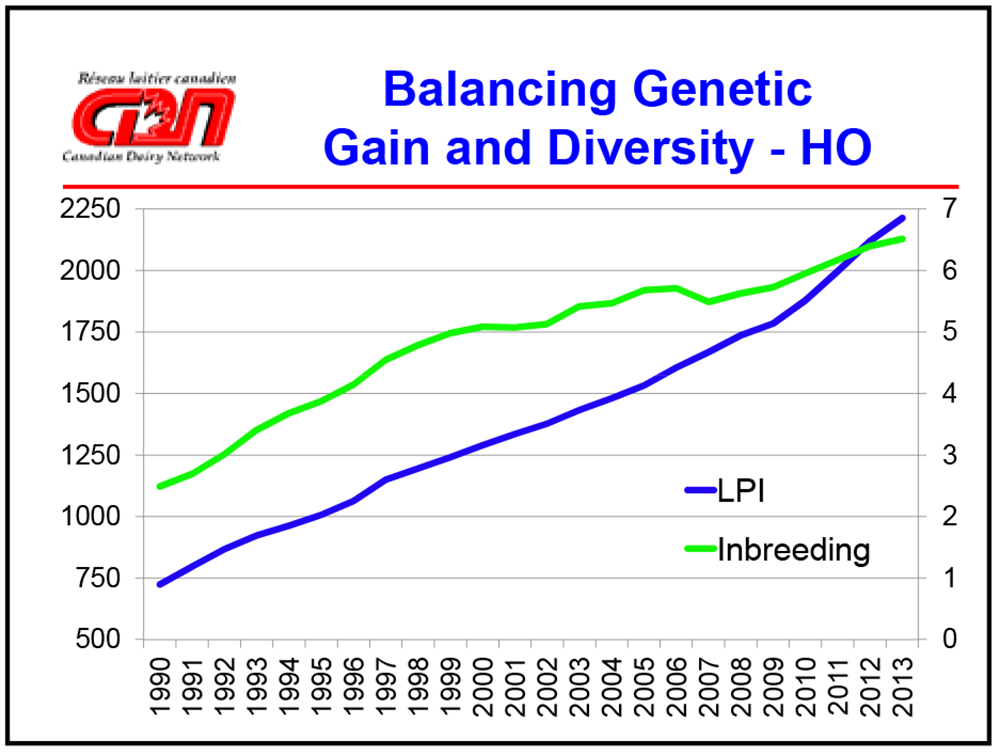
Recently CDN published the following genetic trends for Canadian Holsteins and Jerseys.

lpi & component improvement holstein canada

lpi & component improvement jersey canada

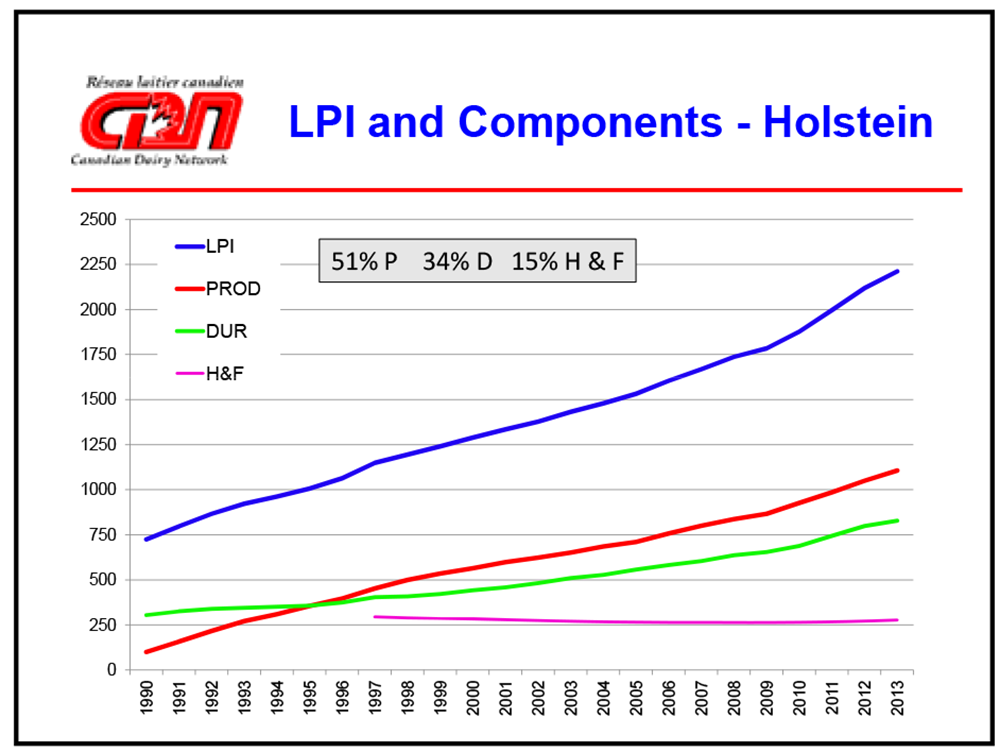
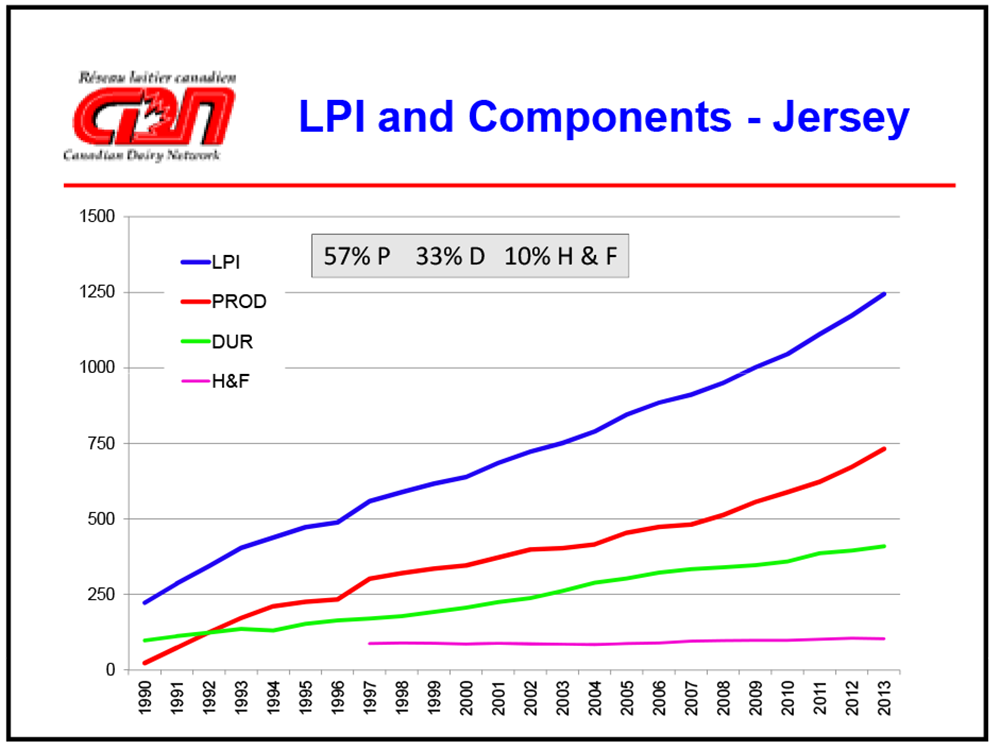
The average increase in LPI for both breeds is 65 LPI points per year. Undoubtedly this annual gain is more than would have been achieved without having the LPI to use for sorting animals. These gains are based on increases in both production and durability (conformation). But note that no gains have been made for health and fertility (H&F) in the past fifteen years.

Index Worship – Gone Too Far?

Having only one number to remember on an animal can be good but there can also be drawbacks to using only one number. These limitations include:

  • Everyone talks about the top ten TPI sires but in fact between #1 (Massey) and #20 (Goose) there are only 122 points. That is almost like getting 99% compare to 95% on a test. Not much difference. So drill down and know the facts. Indexes for these twenty bulls range from 42 to 93 lbs for fat yield and from 0.98 to 3.42 for Udder Composite.
  • Mating a high TPI bull to a high TPI cow without regard to where the bull and cow are strong or weak can lead to disaster.
  • Buying only on the TPI, even though the pedigree person announces that “this heifer is #1”, does not guarantee that you are buying the best animal for the traits important to you.

In fact we could very well have reached the point where we are limiting the advancement we will make in our herds because we do not look at all the genetic indexes for an animal. Instead of using TPI to sort out the top animals and then studying the strengths and limitations of an animal, we only consider the TPI. If you wonder about that The Bullvine suggests that you study the top TPI heifers looking at both their TPI and fertility (DPR) indexes. You will find many top heifers that have a negative DPR index. Is not reproduction the #1 reason cows are culled?

Which Index for You?

The key word in this title is YOU. What business are you in – the business of breeding and marketing of breeding stock or the business of milk production? After you make that important first decision, you are in a position to decide on which total merit index you should use.

It is important to think in terms of what you want your herd to be genetically in the future when selecting a total merit index to use. Traits beyond production and type are becoming more important to breeders. The following ICAR published table shows the relative trait emphasis for seven  leading total merit indexes and the average for all total merit indexes from seventeen countries.

Relative Trait Emphasis in Total Merit Indexes*

RANKNAME# OF DAUGHTERSPTATUdder CompF&L CompBody CompDairy CompStature
1BRAEDALE GOLDWYN553.032.592.561.932.033.1
2REGANCREST ELTON DURHAM-ET212.472.312.131.71.982.13
3KHW KITE ADVENT-RED-ET192.532.241.62.041.652.41
4REGANCREST DUNDEE-ET182.062.180.751.291.551.18
5GEN-MARK STMATIC SANCHEZ143.072.172.443.342.833.91
6WILCOXVIEW JASPER-ET112.891.940.732.562.523.22
7ERBACRES DAMION83.22.223.172.832.722.76
7MAPLE-DOWNS-I G W ATWOOD-ET84.163.413.463.442.974.31
9PICSTON SHOTTLE-ET62.661.971.792.422.32.71
9ROYLANE JORDAN-ET62.071.940.321.532.061.93

* Reported by J Chesnais & Associates at 2012 ICAR Meeting (Ireland)

As you develop your breeding and business plans for the future, the following points may be useful to consider:

  • If you do not sell animals for breeding purposes, having type at a high weighting in your total index may not be your best business decision. NM$ may be a better index for you.
  • In ten years will you be a breeder or a milk producer? Choose either the breeder index (i.e. TPI or LPI) or the milk producer index (i.e. NM$).
  • If you do not show cattle or sell cattle to showmen, then PL (Productive Life) or HL (Herd Life) rather than PTAT or CONF should be an important part of your total merit index.
  • Including and giving significant weighting to traits such as fertility, longevity, calving ability, milking speed and mastitis resistance in the total merit indexes will be the way of the future for breeders focused on milk production.

The Bullvine Bottom Line

Total merit indexes are designed to rank animals according a set formula. After sorting out the top bulls on a total merit basis, breeders should use corrective mating to match the bulls with the cows in their herd. Not using genetic indexes denies you the opportunity to make significant advancements both genetically and from a profit perspective. Are total merit indexes helping or hurting breeders? It depends on knowing your genetic needs and using the index that focuses attention on your most important traits. No total merit index will best serve all breeders. Use the index that suits your plans (Read more:Fact vs. Fantasy: A Realistic Approach to Sire Selection, What’s the plan? and Genomics at Work – August 2013)


The Dairy Breeders No BS Guide to Genomics


Not sure what all this hype about genomics is all about?

Want to learn what it is and what it means to your breeding program?

Download this free guide.


Canadian Genetic Evaluation System: Who’s Leading? Who’s Following? Who’s A Few Bulls Short of a Proof Run?

Are you anxious about where dairy genetics are heading? How are you affected by the impact of genomics? Do you have concerns about health and fertility? What about the over-riding pressure to be profitable in a dairy genetics marketplace that sometimes resembles a global roller coaster of competing proof runs and bull lists?

Last week, I attended the Open Industry Session presented by CDN on behalf of the Genetic Evaluation Board.  I went into the meeting feeling interested and invulnerable because, after all, what you don’t know can’t hurt you. Right? But I soon learned I was wrong and not just because I was “a pair of genes short of a geneticist”.

DAIRY INDUSTRY TODAY: In the Running OR Run of the Mill?

On the plus side the Open Industry Session provides an opportunity for the manager and staff of CDN to demonstrate how they are fulfilling their mandate to fine tune genetic evaluations. It’s exciting to catch the enthusiasm for making genetic progress.  As pointed out throughout the day, a key measure of that progress is whether the science, the research and the results can be translated into on-farm applications for management, breeding and profitability.

Take A Genetic Bite Out of Mastitis

Mastitis is at the top of the list of 8 diseases that have an economic impact on dairy herds. Identifying genetic markers could have a significant effect on dairy profitability.  As with any index the quality of the data is the game changer here. Since 2007 40% of Canadian breeders have mastitis recorded. Prior to 2007 there is “ZERO” data. The good news behind those stats is that it is possible to build an index using correlated data from SCS and Type indexes.  In fact it was reported that Reliability gains were significant from using a multivariate model combined with historical data. The new genetic evaluation for Mastitis Resistance incorporates three predictors – Somatic Cell Score, Udder Depth and Fore Udder Attachment – as well as recorded mastitis, Body Condition Score and several other measurements associated with somatic cell count.  It reduces complexity by having one index that puts all the data together. This approach results in an evaluation that explains as much as 72% of the genetic variation in Mastitis Resistance and increases the accuracy of genetic evaluations provided by CDN.

disease frequencies

GENOMICS: The Fast and the Curious

Simplified estimation of DGVs allows CDN to move forward to more frequent releases of genomic evaluations for genotyped heifers and young bulls. Couldn’t help but sense the attention when BVD said, “We could release and update on a weekly basis.” The logistics appear to be fairly simple. “DNA genotyping labs would need to move to “continuous” genotyping for dairy animals.” VanDoormaal feels that at least moving information turnover from monthly to weekly (roughly from the current 6 weeks to 2 weeks) expands the opportunity for better decision making.

Bulls, Bias and Barriers

Genetic evaluations depend on data.  Huge volumes of data.  And not only is that data collected in 30 different countries but also with different methods, weighting and formulae. This means that bias is present and must be accounted for.  Canada has made extra effort to ensure that young bulls are not over-inflated relative to PT (progeny tested) bulls. Interbull GMACE can only recognize our GPA’s if we participate.  Italy, UK Canada and USA all plan to participate.

One of the most interesting opportunities for those at the industry session is seeing graphs demonstrating challenges, opportunities and actual genetic progress.

balancing genetic gain and diversity

impact of inbreeding on lpi and components

recessives trends - holstein

recessives trends - rw and polled

Take-home insights included:

  • 150 LPI points of genetic improvement represents $23.5 million dollars.
  • Graph representing within herd re-ranking of heifers with genomics. (There have been both high profile and large commercial herds regularly genotyping all heifers every year!)
  • With the right indexes and the right data it is ultimately possible to quantify the dollar value of right decisions vs. wrong decisions on heifers to keep as replacements.
  • Especially as regards inbreeding, dairy breeders are not paying enough attention to inbreeding. Therefore including it in the formula is a step forward. There isn’t significant loss in genetic progress but there is going to be population gain in having outcrossing taking place.
  • Adjusting Mendelian Sampling, by using only cow indexes based on male ancestors, can detect biased cow evaluations and thus determine the ones that are outliers (i.e. deviate excessively from Pedigree Index).

Each one of these breakthroughs represents tools that can be applied to improved profitability for the industry.

Canadian LPI:  The Less Stretched Index

Trying to boil down 1000s of hours of computerized “fine tuning” and “tweaking” into an easily understood Open Industry Session is a challenge for both presenters and audience.  With all the progress represented by the “new and improved” indexes the prime focus of the industry is to find the solution to bias in bull proofs.  “When we encourage industry participation, we hope dairy breeders care enough and are confident enough to stand up and try to make things change.”

Twenty years of a dynamic LPI has shown to be a great process.  That trajectory increased substantially with genomics. Now CDN is examining the best options for update to the LPI formula.  Two good questions were raised:

  1. “Are we going to lead with LPI or are we going to follow?”
  2. “Is there going to be breeder buy in to revised trait emphasis in the LPI?”

“Barking up the wrong fee!”  and “Who is responsible for this Hot Mess?”

Everyone attending the Open Industry Session requires dairy profitability for their daily survival whether that happens in a barn, an office, research lab, or at an editor’s desk. That is probably why ears perked up when the $7500 per bull fee for genetic evaluation results was raised … again!  It is a contentious issue for those A.I. organizations and some breeders who feel that they freely provide the information which becomes available to 30 countries. Therefore it should be available back to them.  Some feel the cost is too high. Others are concerned that too much or not enough information is disclosed. This oft-recurring and touchy issue makes its way to every open meeting where it is consistently deflected with the answer, “Fees are a policy decision not a genetics issue!”  Well then if this is an “open” session. Who sets the policy?  Who sets the fees? Who collects the money?  What is it used for?  If three out of four of these questions have the same answer, then let’s get to the table and make the decision and then live with it!

THE LANGUAGE OF PROFITABILITY!  Bulling for Dollars!

The meeting started seeing dollar signs again, after another perceptive question was raised, “If LPI is Lifetime Profit Index where does the Profitability come in?”  It was agreed that the aim is the profitable cow and we could do a lot better job of expressing the profitability value in dollars which is a language everyone understands.  That led to an “Aha!” moment!  It doesn’t matter how clear and accurate our calculations are, if they don’t translate well into the commerce side of the marketplace.  The key word here is “translate”. For those working in the global marketplace, language is another hurdle to overcome.   A few examples of how hard it currently is and how easily it could be done and it seems that multi-language translations of GEB / CDN publications is in the future.

The Bullvine Bottom Line

The Open Industry Session literally opens the doors to the future. We know what we want.  We know that time is passing.  We have the information and the means.  The final key is that dairy breeders, scientists and board members must have the will to move forward. Together? Are we dedicated to progress or just the perception of progress? The challenge is to figure out the answers and thereby shorten the distance between the future and the present.  Otherwise… A lot sooner than we think… we could end up on the outside looking in:  “Just a few great bulls short of a proof run!”


The Dairy Breeders No BS Guide to Genomics


Not sure what all this hype about genomics is all about?

Want to learn what it is and what it means to your breeding program?

Download this free guide.


Canadian LPI Rescaling Explained (April 2013)

Understanding and correctly using genetic indexes is important to breeders who derive a significant portion of their profit from dairy cattle breeding decisions. Major changes in the expression of indexes do not occur frequently but when they do occur it can be a time of confusion and perhaps lack of trust. The Canadian total index, LPI, has been used for over twenty years by Canadian breeders, as well as by breeders from other countries who source genetic material from Canada. When changes occur in the LPI indexing system, as is the case just now in April 2013, it is important that the reasons for the changes and the results be understood and incorporated into breeders’ decision processes.

Why Change?

For some time now the LPI values, especially for Holsteins, have been increasing quickly for all animals but it has been most noticeable for animals that have genomic evaluations. Breeders questioned how these young animals with indexes that are about 65% reliable can be significantly superior to recently proven top end bulls and active cows with their own performance values. As most breeders refer to the absolute LPI number, significant differences between the leaders on the various listings left doubt in accuracy in breeders’ minds. For breeders who think is bottom line terms and do not follow the LPI numbers closely, comment were often heard about the fact that numbers are numbers but it is annual cow profit that pays the bills, expands the business and sends the kids to college. Point being that the LPI difference between animals over-stated the net dollar difference between animals. These questions, comments and concerns were heard loud and clear by the CDN’s Genetic Evaluation Board so it studied the matter and took action.

LPI Scaling

The extreme range (-3500 to +3500) in Canadian Holstein LPI values had many drawbacks. It assigned most older long-lived profitable cows a negative value thereby telling a story that was not true and limiting the saleability of their subsequent generation. It assigned values that indicated significant differences between animals when the actual dollar differences were not that large. And due to the scaling effect for animals at the very top of the breed it gave values far exceeding the actual differences.  This latter point was especially true for bulls and heifers with only parent averages and genomic evaluations.

While studying possible solutions, CDN noted that in other major dairy breeding countries the scale for their total merit index is much much smaller than Canada’s 7000 point range. CDN decided to adopt a publication methodology for the LPI similar to what the TPI™ has used for many years. That involves calculating a value and adding a ‘constant’ to it.

New LPIs

Effective April 09, 2013  the new LPI formula is ½ Previously calculated LPI  + Constant.

cdnfigure1

Note that the highest progeny proven sires do not change in value.

currentvsnewlpi

Note that the range in values of Holstein LPIs is now much more similar, although slightly more, than the range for  Holstein TPI™

Sire LPIs

It is important to note that this re-scaling of LPI does not re-rank animals. But it does bring the progeny proven sires and genomically evaluated young bulls much closer in their values.

toplpigenomicsiresdec2012

It is important to remember that LPI is the Canadian system for ranking animals according the weights assigned to the numerous genetic indexes of important for lifetime profit. For Holsteins the weights at 51% Production, 34% Durability and 15% Health and fertility while for Jerseys those weightings are 57%, 33% and 10% respectively. Breeders wanting to place more or less emphasis on the various can calculate their own rankings using  the CDN calculator available at www.cdn.ca or going the Bulvine’s bull listings for alternative ranking systems (Read more: Bullvine Performance Index (BPI) – Top Sires December 2012).

Using Genetic Indexes

Indexes are a very constructive tool to genetically breed better animals for the future. As genetics is less than half of the reasons animal differ in profitability, much depends on breeders to not only produce the animals that will be profitable but also to feed and manage them.  Some suggested ground rules to follow when making sire or heifer selections are:

  • Use LPI, TPI™ or Net Merit are you primary list reduction tool for sires or herd replacements
  • Always check out the index values for the traits important to you (i.e. protein, fat, feet & legs, udders, SCS, fertility,..). Eliminate animals from the list that do not meet your requirements.
  • A quick way to eliminate animals is to use % RK (percentile rank).
  • Animals below 75% RK for any yield or conformation traits will likely leave progeny that reduce your profit.
  • Animals below 60% RK for health and fertility traits will not move your herd ahead for these traits of emerging importance.

The Bullvine Bottom Line

Even though the method of expressing genetic indexes may differ from trait to trait or country to country, it is always important to have a plan on what you want to improve genetically  in your herd and then to select the sires or replacement females that will produce the results. The re-scaling of the LPI values will come closer to the actual dollars amount animals return in their lifetime profit and will more accurately compare older and younger animals. By all means keep your genetics current and on target to your needs. It is best to throw out the semen from low indexing bulls. Buy high ranking genetics. It always pays big dividends.


Get original “Bullvine” content sent straight to your email inbox for free.


Send this to a friend