


New production, inventory, and export data is now available. Warning – some of these charts may be offensive!
As covered in prior posts, the linkage between the cheese price and the Class III milk price is firm. As goes cheese, so goes Class III milk. If the price of butter goes up, that can be good for producers only if they can produce more butterfat than they used to. The price of butter has very little influence on the Class III price, which uses standardized component levels.
The charts below show how out-of-balance production, inventories, exports are for cheese, butter, and nonfat dry milk.
Cheese production is way above any normal growth pattern for consumer and export demand (Chart I).
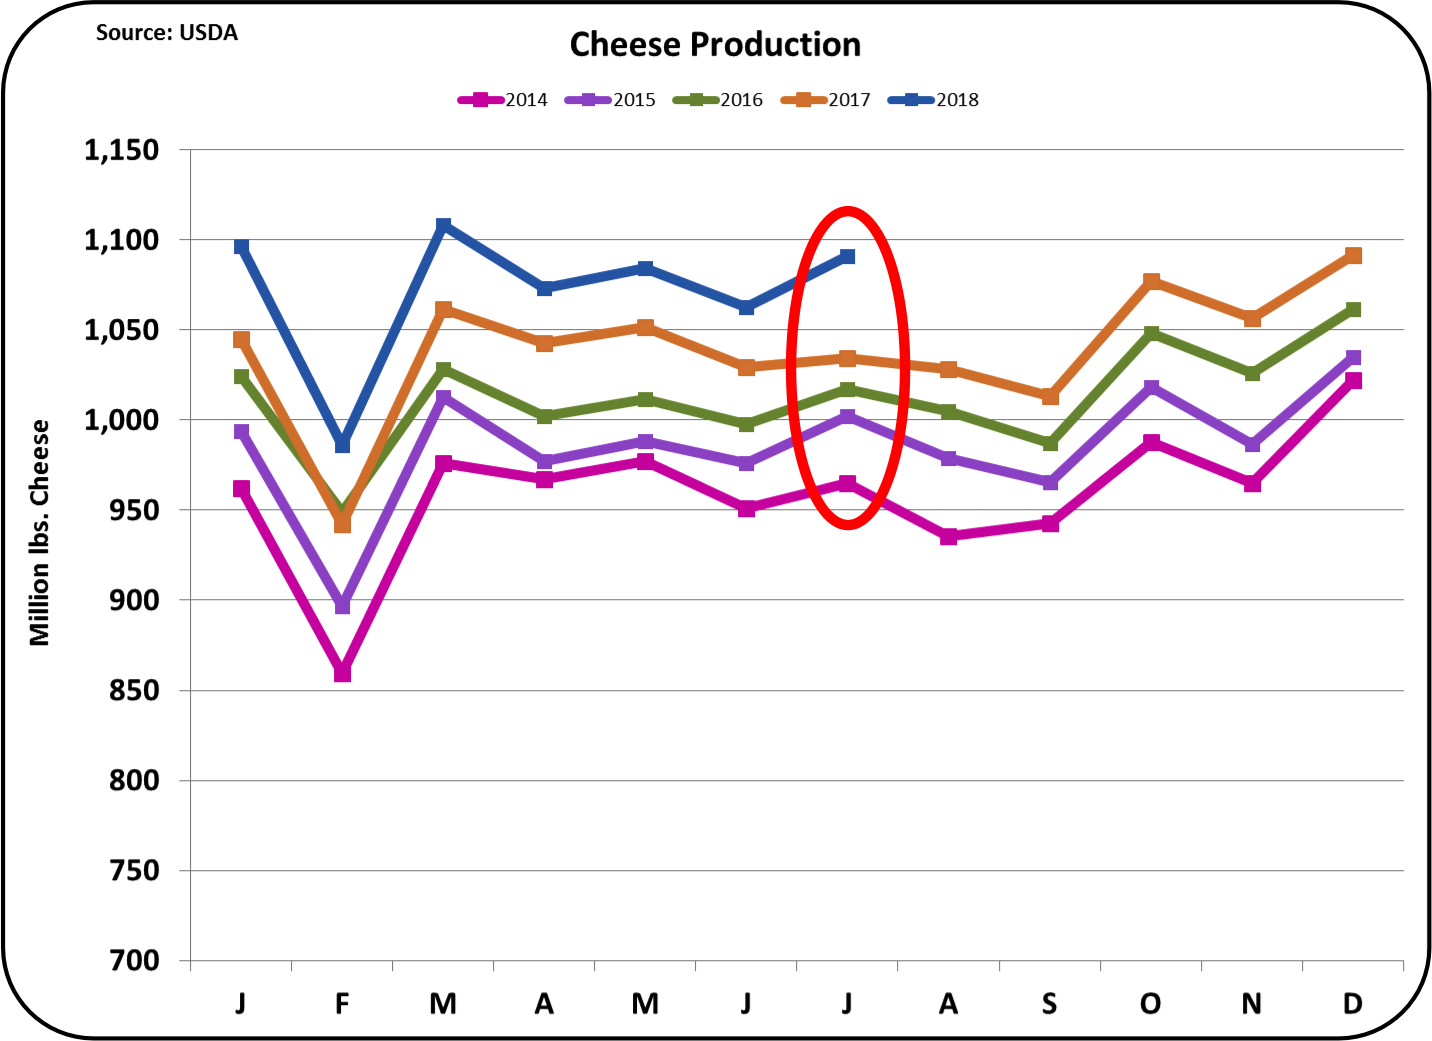 |
| Chart I – Cheese Production |
Cheese inventories are running extremely high (Chart II). The very high inventories have been building for almost two years. The inventories are well above what is needed for the normal demand growth, which is shown via the chart trend line.
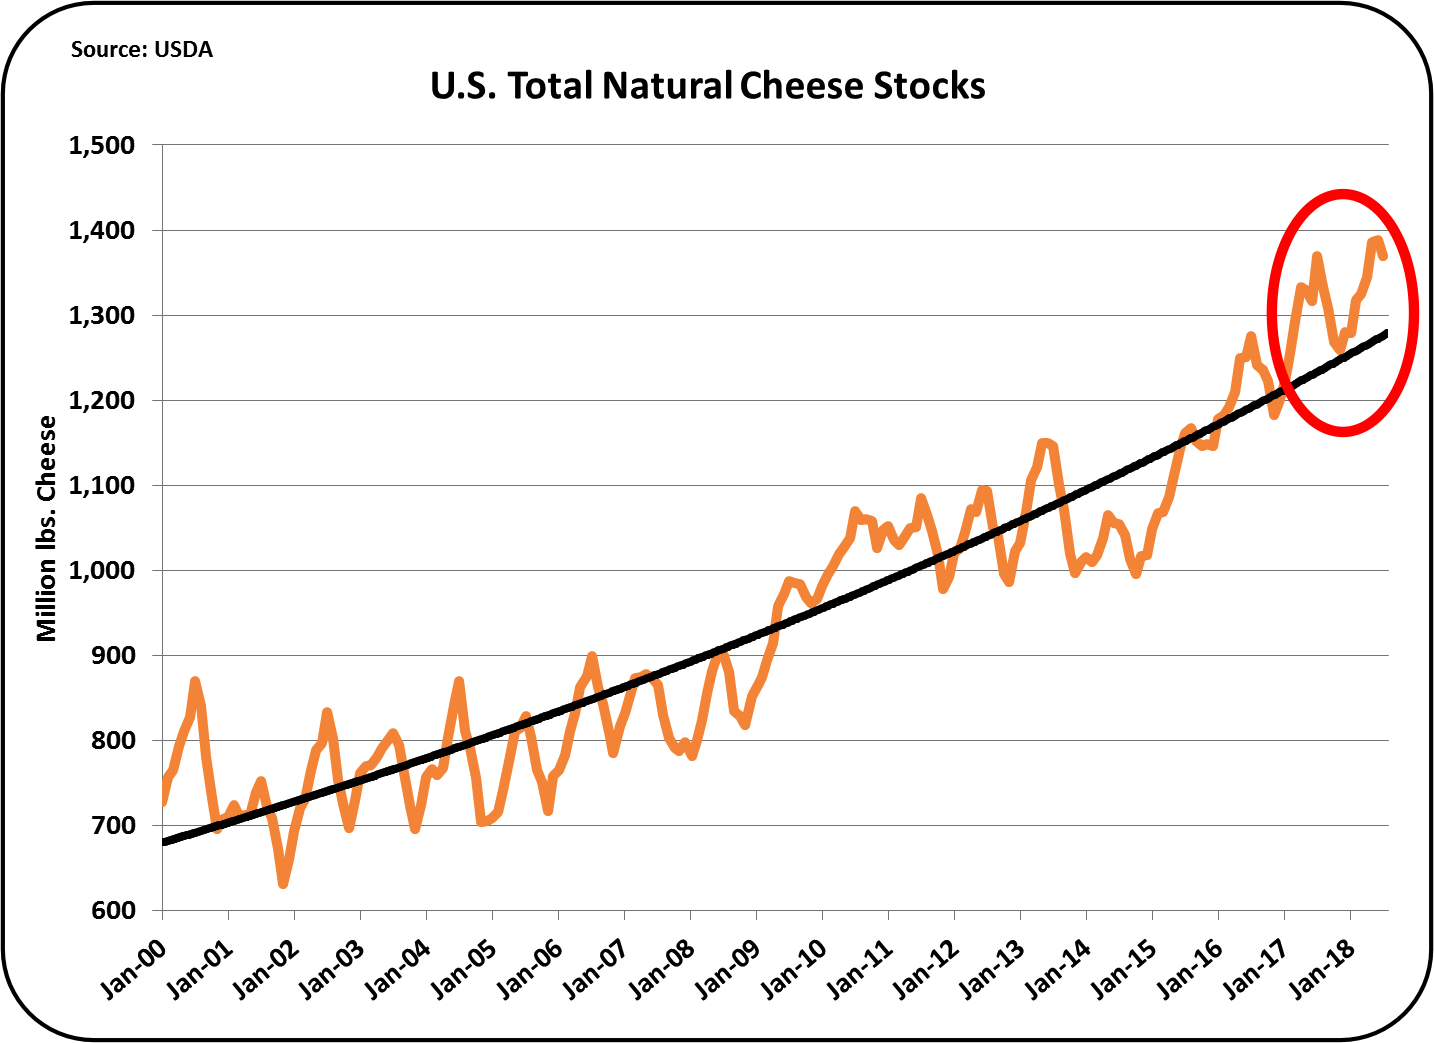 |
| Chart II – Cheese Inventory |
Exports of cheese (Chart III) are not showing any growth at all. While there is lots of hype about increasing exports, when it comes to cheese, there is no growth in exports.
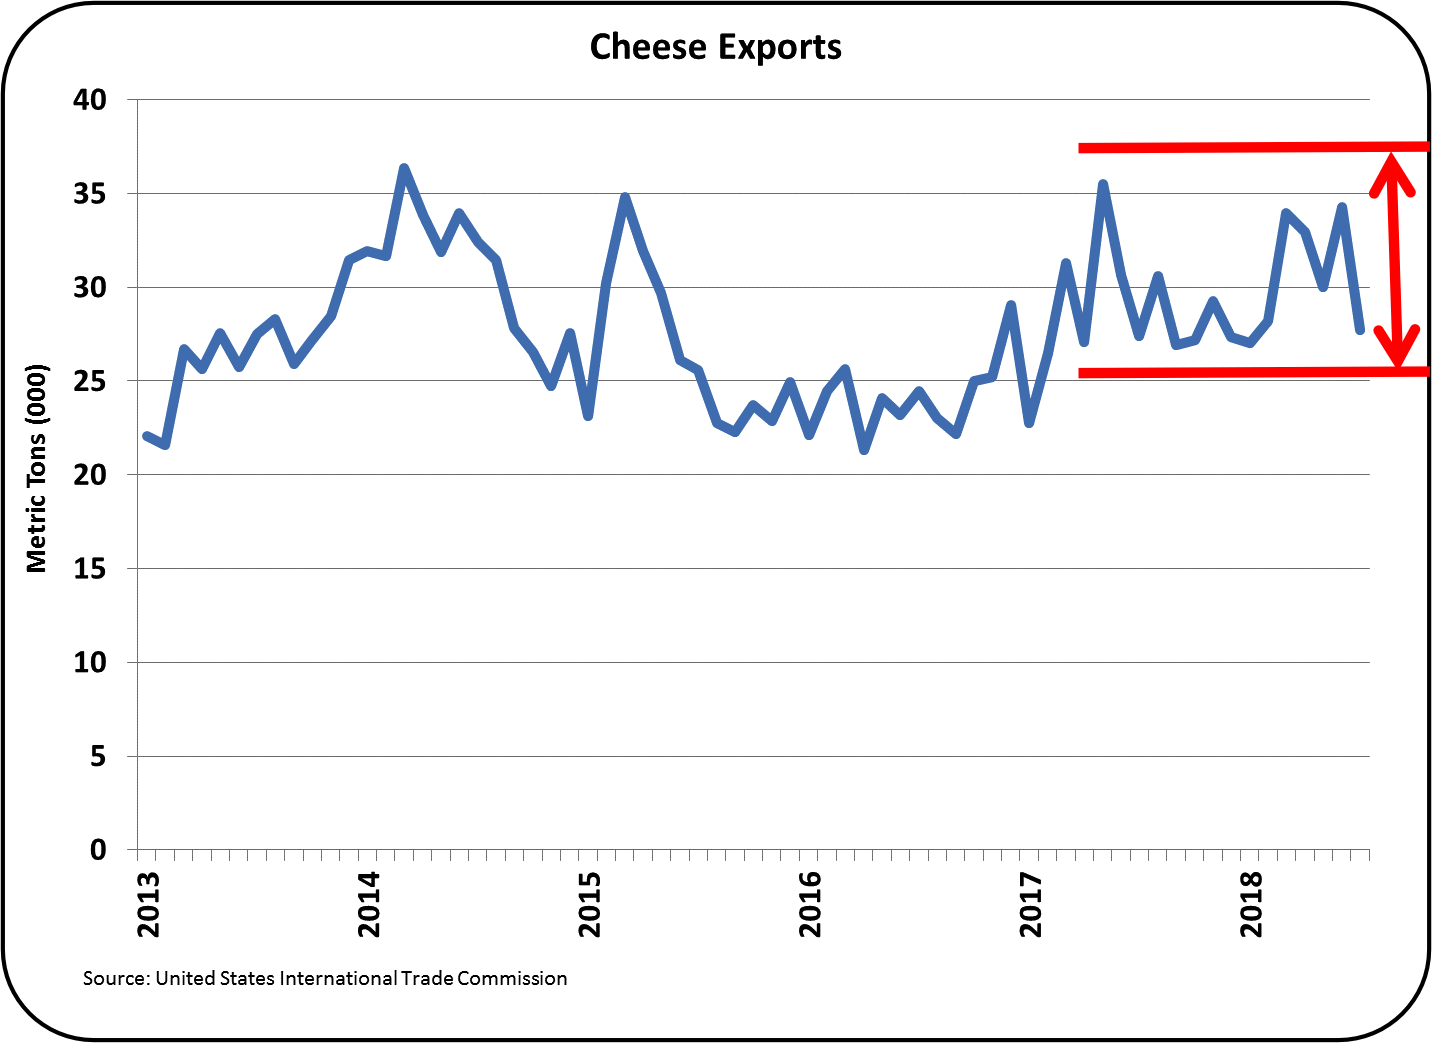 |
| Chart III – Cheese Exports |
Is cheese a good place to hide excess milk production? It can be held for a while, but the end result is high inventories and low prices. While there is news in the press about the impact of Mexican tariffs on cheese, what we are looking at is a long-term issue, not something that just happened in the last few months.
Predictably, the price of cheese is low and getting lower.
 |
| Chart IV – Cheese Prices |
When we look at nonfat dry milk/skimmed milk powder (NDM/SMP), the pictures are a little different, but show some of the same patterns. The charts again show production well above the normal growth line. This is probably caused by the demand for butter. Excess NDM/SMP is more of a by-product than a co-product.
 |
| Chart V – NDM/SMP Production |
When we look at stocks of NDM/SMP, it is very easy to see levels well above the norms.
 |
| Chart VI – NDM/SMP Inventory |
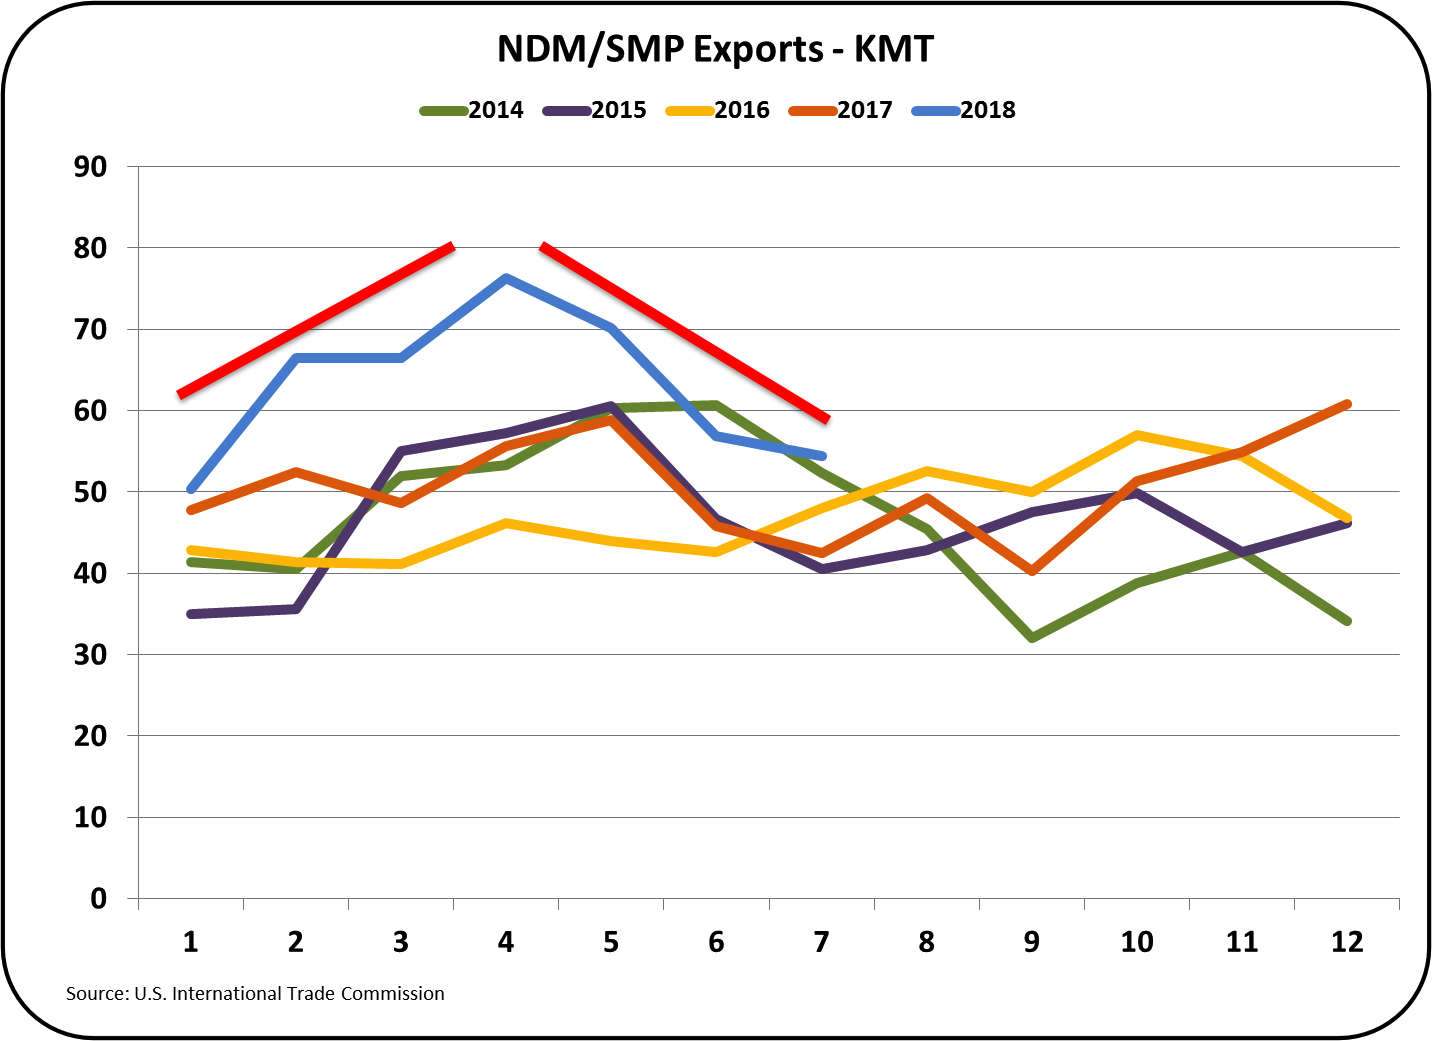 |
| Chart VII – NDM/SMP Exports |
 |
| Chart VIII – NDM/SMP Prices |
Butter analytics have a strange but very different profile. Butter domestic consumption is growing at a current rate of 2.6% per year. But production is not growing at all. Chart IX below shows no growth in the last seven years.
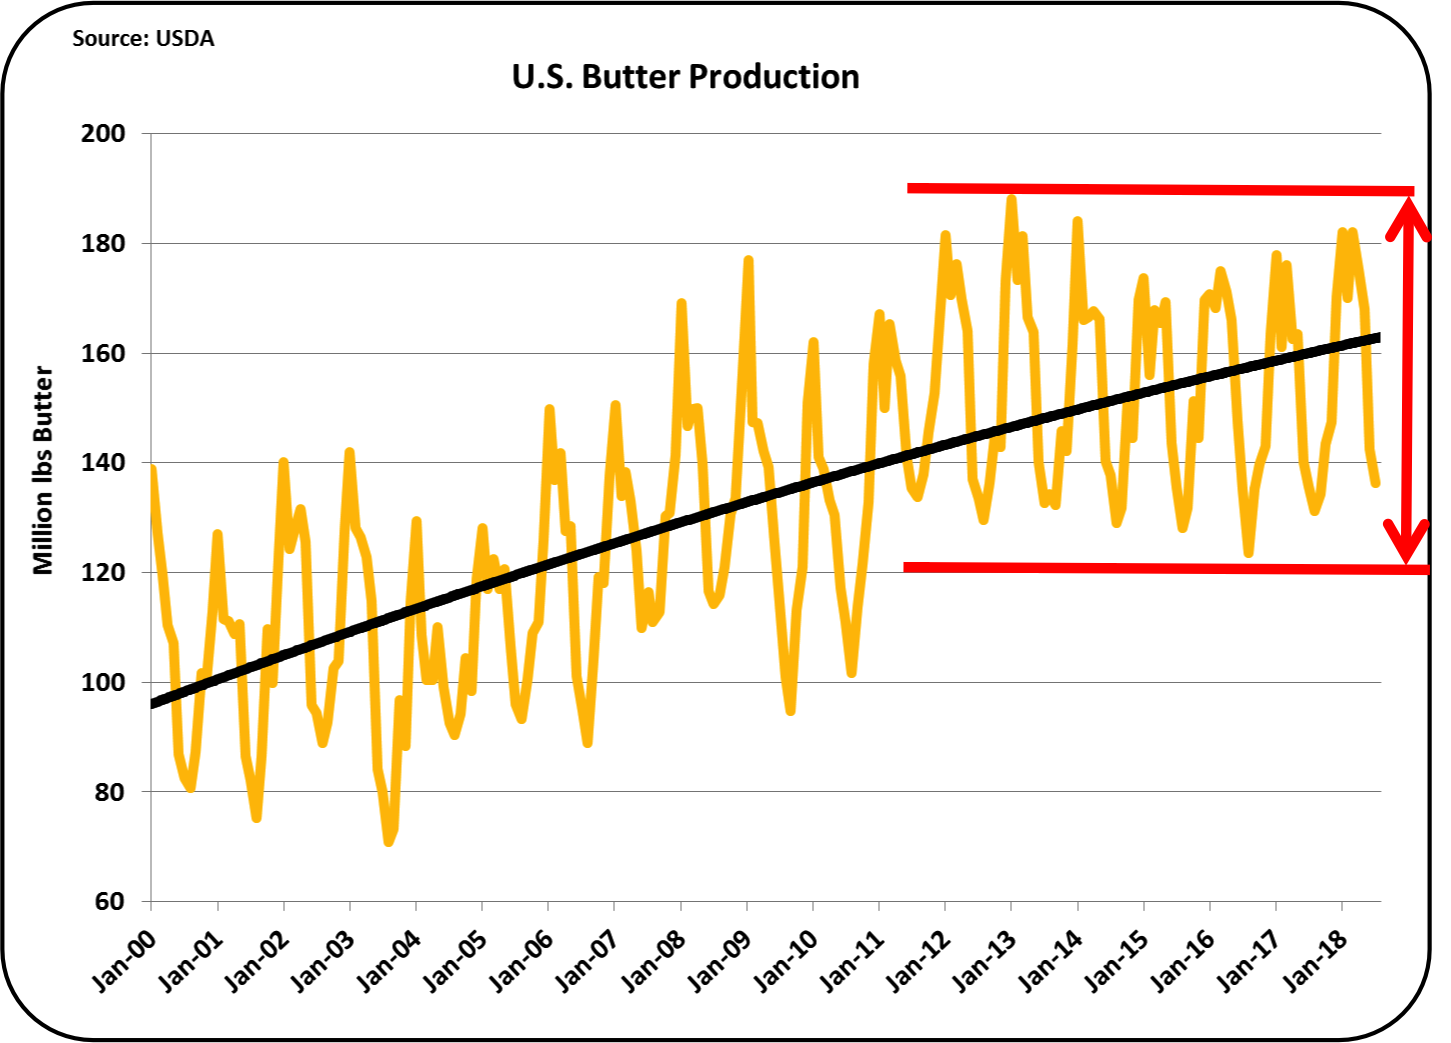 |
| Chart IX – Butter Production |
In spite of consumer growth in butter consumption, inventories are currently at or below the levels of the prior two years.
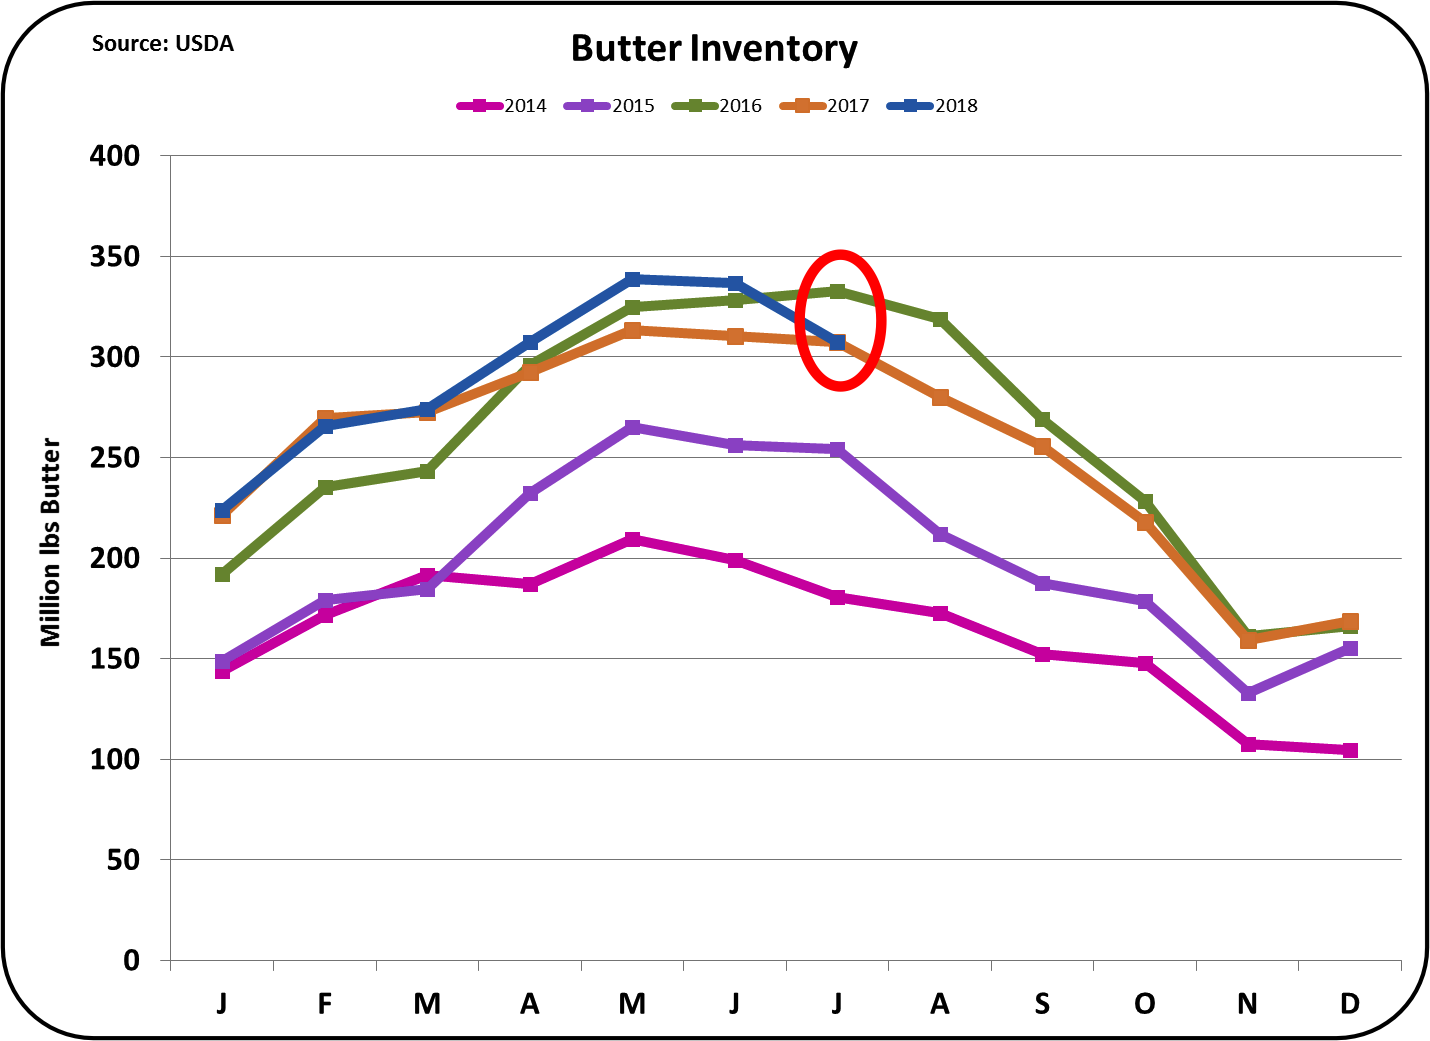 |
| Chart X – Butter Inventory |
Exports of butter are growing. YTD in the first half of 2017, 2.7% of butter production was exported. That has risen to 4.5% in 2018, a dramatic increase. But at 4.5% butter exports have the lowest export rate of any major dairy export item. What is being exported is going mostly to Canada with a significant volume also being exported to Mexico.
 |
| Chart XI – Butter Exports |
 |
| Chart XII – Butter Prices |
In summary, we have too much cheese, too much NDM/SMP, and not enough butter. These inventories in turn result in low Class III milk prices, low milk protein prices, and high butterfat prices.
The mix of too much NDM/SMP and too little butter is certainly a contrarian problem that will continue. Both products come from the same Class IV milk and you can’t have one without the other. That may currently be limiting butter churning.
The over supply of cheese is probably being forced by the oversupply of milk. The supply of milk is not dropping, but sooner or later, it will have to drop. Once it drops, inventories will begin to drop and only then will the Class III milk price improve.
Source: MilkPrice


