


“Fall Inspirations” by Erin Goodling
Just like the subdued, muted fall foliage, milk prices remain low, but started an upward trend. Class III and Class IV futures predict a Pennsylvania All Milk Price in the $18-$19/cwt range for the first half of 2019. Those ranges still fall below the average breakeven for 2018 cash flow plan evaluations completed by the Penn State Extension Dairy Business Management team. The Pennsylvania All Milk Price predictions may be optimistic. Historic differences between Class III and Pennsylvania All Milk Price ranged between $2-3/cwt. However, the last two months that difference has been $1-1.50/cwt. It could be feasible to see an All Milk Price in the $17-$18/cwt range in the first half of 2019.
Feed costs were lower this month than previous. It is hard to predict where feed prices will be in the next few months given harvest delays and quality issues. This continued tight and low milk margin requires producers to monitor their breakeven cost of production and look at opportunities to reduce expenses while maintaining or improving income.
Looking at the big picture, during September, the U.S. dairy cow herd was 13,000 head less than in September 2017. However, national milk production was up 1.5 percent from September 2017 because of increases in milk productivity (USDA). Because of low milk prices, the earning potential of dairy cows decreases, which is reflected in the cow prices. The average price of dairy cows fell by 24% ($380 per cow) year-over-year (LMIC).
The following graph shows how dramatically things have changed over the past five years. The green color boxes show the gross milk prices, the red boxes show the breakeven prices that are basically the prices that are needed to cover the cost of production, and the gray boxes are the difference between milk and breakeven prices, which can be considered as cash surplus per unit of milk. It is important to note that regardless of year, there is greater variation in break even costs than milk price across farms, providing individual farms varying levels of opportunity to evaluate and potential reduce their costs.
Based on our sample of nearly 100 annual actual cash flow plan analyses, more than 50% of dairy farmers reported cash surpluses in 2013 (i.e., gross milk prices above their break even cost). In 2014, while the production costs were reported to be higher than 2013, the increase in gross milk prices compensated for the increase in the production costs and more than 75% of dairy farmers in our sample reported gross benefits. However, the picture reversed in 2016 where the gross milk prices were below their average levels in 2014 and 2015 in such a way that producers could not benefit from lower costs of production. More than 75% of dairy farmers in our sample reported cash losses. In 2016, the increase in the costs of production, accompanied with flat gross milk prices made a dire situation even worse. Almost all of the dairy producers in our sample reported losses in 2016. While the situation got slightly better in 2017 due to a small increases in the gross milk price and lower production costs, more than 50% of dairy farmers in our sample reported cash losses.
Figure 1: Pennsylvania Year End Actual Gross Milk Price, Breakeven, and Milk Price Minus Breakeven
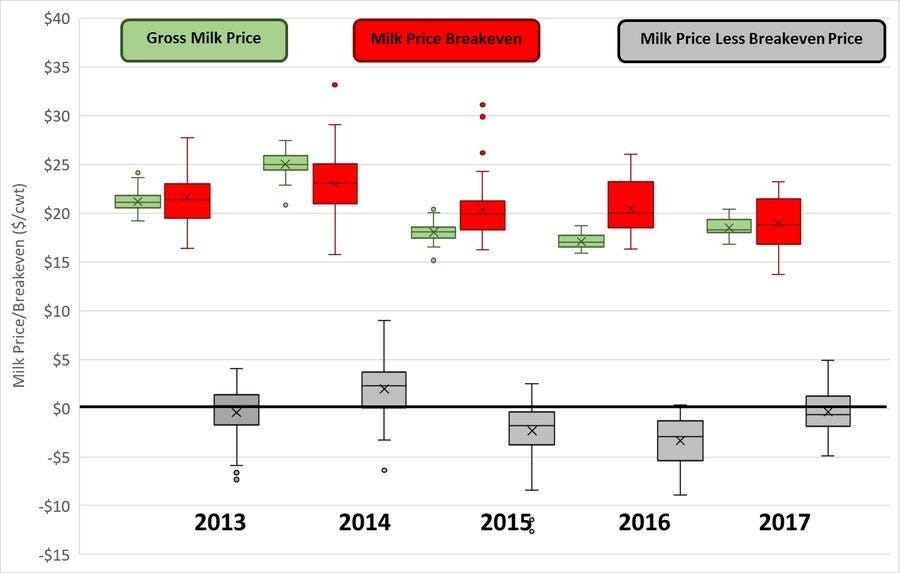
(Beck, Ishler, Goodling, 2018).
Income over Feed Cost, Margin, and All Milk Price Trends
Table 1: 12 month Pennsylvania and U.S. All Milk Income, Feed Cost, Income over Feed Cost ($/milk cow/day)
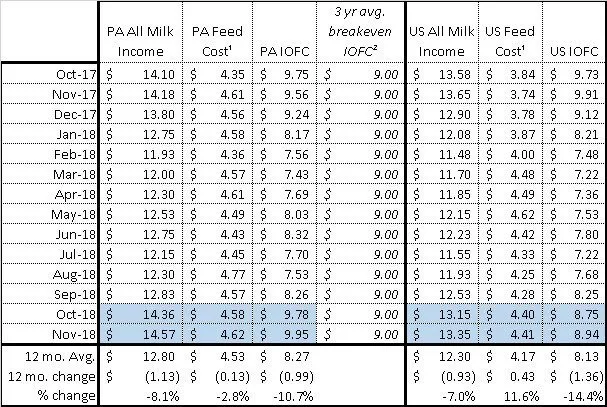
¹Based on corn, alfalfa hay, and soybean meal equivalents to produce 75 lbs. of milk (Bailey & Ishler, 2007)
²The 3 year average actual IOFC breakeven in Pennsylvania from 2014-2016 was $9.00 ± $1.67 ($/milk cow/day) (Beck, Ishler, Goodling, 2018).
Table 2: 12 month Pennsylvania and U.S. All Milk Price, Feed Cost, Milk Margin ($/cwt for lactating cows)
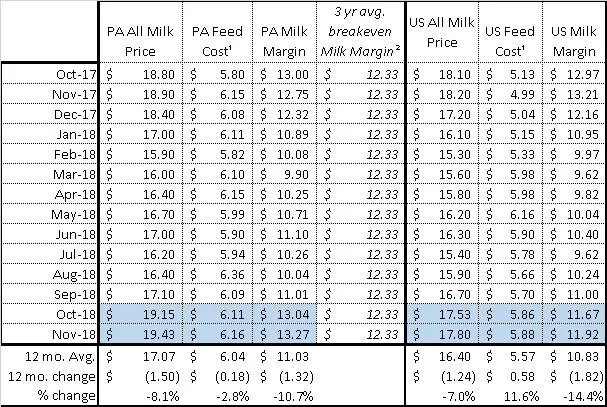
¹Based on corn, alfalfa hay, and soybean meal equivalents to produce 75 lbs. of milk (Bailey & Ishler, 2007)
²The 3 year average actual Milk Margin breakeven in Pennsylvania from 2015-2017 was $12.33 ± $2.29 ($/cwt) (Beck, Ishler, Goodling, 2018).
Figure 2: 12 month Pennsylvania Milk Income and Income over Feed Cost ($/milk cow/day)
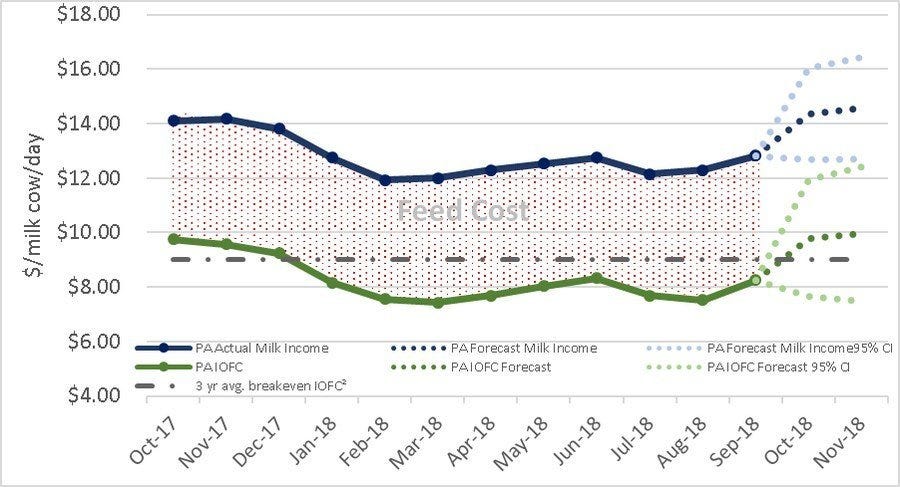
²The 3 year average actual IOFC breakeven in Pennsylvania from 2015-2017 was $9.00 ± $1.67 ($/milk cow/day) (Beck, Ishler, Goodling, 2018).
Figure 3: 24 month Actual and Predicted* Class III, Class IV, and Pennsylvania All Milk Price ($/cwt)
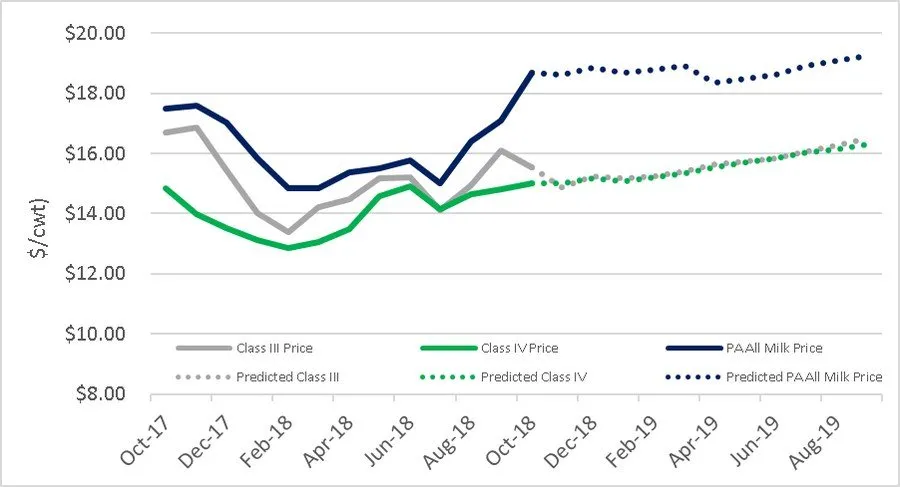
*Predicted values based on Class III and Class IV futures regression (Gould, 2018).
Table 3: 24 month Actual and Predicted* Class III, Class IV, and Pennsylvania All Milk Price ($/cwt)
| Month | Class III Price | Class IV Price | PA All Milk Price |
|---|---|---|---|
| Oct-17 | $16.69 | $14.85 | $17.49 |
| Nov-17 | $16.88 | $13.99 | $17.61 |
| Dec-17 | $15.44 | $13.51 | $17.04 |
| Jan-18 | $14.00 | $13.13 | $15.83 |
| Feb-18 | $13.40 | $12.87 | $14.84 |
| Mar-18 | $14.22 | $13.04 | $14.85 |
| Apr-18 | $14.47 | $13.48 | $15.38 |
| May-18 | $15.18 | $14.57 | $15.49 |
| Jun-18 | $15.21 | $14.91 | $15.79 |
| Jul-18 | $14.10 | $14.14 | $15.01 |
| Aug-18 | $14.95 | $14.63 | $16.40 |
| Sep-18 | $16.09 | $14.81 | $17.10 |
| Oct-18 | $15.53 | $15.01 | $18.68 |
| Nov-18 | $14.88 | $15.02 | $18.61 |
| Dec-18 | $15.23 | $15.17 | $18.86 |
| Jan-19 | $15.19 | $15.06 | $18.69 |
| Feb-19 | $15.24 | $15.20 | $18.78 |
| Mar-19 | $15.40 | $15.33 | $18.92 |
| Apr-19 | $15.64 | $15.53 | $18.36 |
| May-19 | $15.73 | $15.71 | $18.49 |
| Jun-19 | $15.83 | $15.85 | $18.61 |
| Jul-19 | $16.08 | $16.02 | $18.92 |
| Aug-19 | $16.28 | $16.15 | $19.09 |
| Sep-19 | $16.49 | $16.30 | $19.26 |
*Italicized predicted values based on Class III and Class IV futures regression (Beck, Ishler, and Goodling 2018; Gould, 2018).
To look at feed costs and estimated income over feed costs at varying production levels by zip code, check out the Penn State Extension Dairy Team’s DairyCents or DairyCents Pro apps today.
Data sources for price data
- All Milk Price: Pennsylvania and U.S. All Milk Price (USDA National Ag Statistics Service, 2018)
- Current Class III and Class IV Price (USDA Ag Marketing Services, 2018)
- Predicted Class III, Class IV Price (Gould, 2018)
- Alfalfa Hay: Pennsylvania and U.S. monthly Alfalfa Hay Price (USDA National Ag Statistics Service, 2018)
- Corn Grain: Pennsylvania and U.S. monthly Corn Grain Price (USDA National Ag Statistics Service, 2018)
- Soybean Meal: Feed Price List (Ishler, 2018) and average of Decatur, Illinois Rail and Truck Soybean Meal, High Protein prices, National Feedstuffs (USDA Ag Marketing Services, 2018)
Source: extension.psu.edu


