


The cost to operate a dairy business is a critical component associated with generating profit. Profits are determined by quantity and quality of output, the prices received for output, and capital invested along with the costs to produce output. With many external factors impacting dairy farm financial performance in 2020 because of the pandemic, such as direct government payments, Class III and Class IV price variations, and milk production limitations from processors, understanding the costs to produce milk is important. Many of the different areas of cost are influenced internally and are under a higher degree of control of management, so the ability for a dairy to be successful in meeting goals over time is not solely dictated by external forces.
While milk income is the largest source of revenue on dairy farms, it is not the only source of revenue. Dairy cattle, calves, and crop revenue are other significant sources of revenue on the farm. There are also other sources, such as patronage, custom hire, fuel tax rebates, and government receipts. When reviewing costs on a dairy farm, costs can be adjusted for some of these other sources of revenue to report only those remaining costs that have to be covered by the sale of milk. Using the whole farm approach, the various nonmilk sources of revenue are subtracted from costs. The whole farm method assumes that accrual non-milk receipts equal the non-milk operating costs associated with generating the revenue and there was no profit. The resulting costs are those that must be covered by the sale of milk.
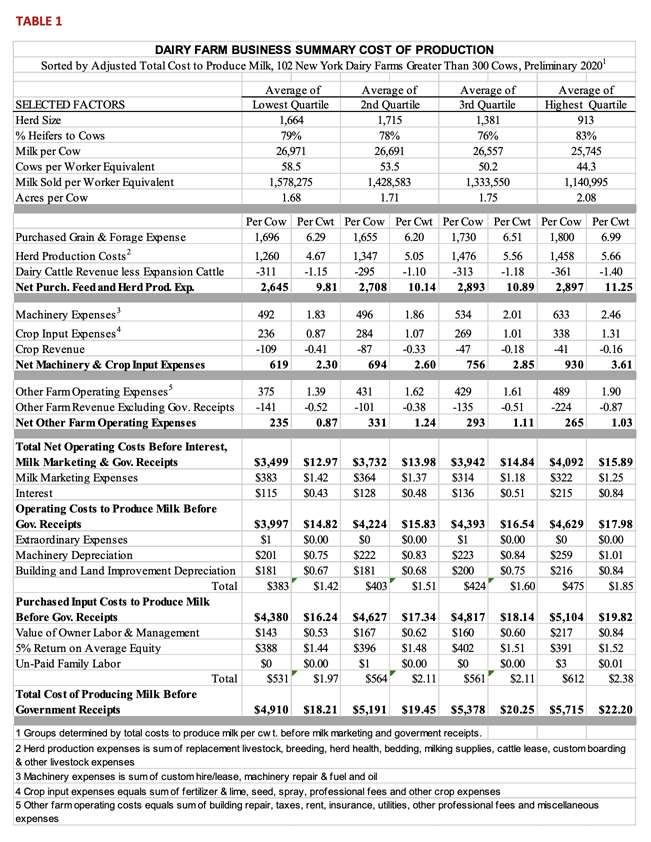
For the 2020 business year, cost information for 102 farms greater than 300 Cows in New York State were summarized within the Dairy Farm Business Summary and Analysis Program. Table 1 highlights costs by quartile, with the data sorted by Total Cost to Produce Milk before milk marketing expenses and government receipts were included. With the unique circumstances, last year milk marketing expenses and government receipts were not included when determining the quartiles. The lowest quartile represents the average of the farms with the lowest cost.
Purchased feed and herd production costs
The purchased grain and forage costs is the single largest expense on the farms. The lowest cost quartile averaged $6.29 per cwt, which was the second lowest cost of the quartiles, following the $6.20 per cwt for the second quartile. The highest cost farms averaged $6.99 per cwt. Milk production is a factor in the purchased grain and forage costs. The lowest cost quartile did average the highest milk production per cow, averaging 26,971 pounds per cow. Milk production per cow declines in each proceeding quartile, but the range from the lowest quartile of farms to the highest quartile of farms was only 1,126 pounds. With a smaller change in milk production, the cost per cow is more significant. The lowest two quartiles spent less than $1,700 per cow and made the highest production while the highest two groups spent over $1,700 and yet produced less milk.
Herd production costs are all the costs directly associated with care of the animals, including hired labor expenses. The herd production expenses ranged from $4.67 to $5.66 per cwt, with the expenses increasing from the lowest quartile of cost farms to the highest.
To calculate the net purchased feed and herd production expenses, the revenue associated with dairy cattle, heifers, and other livestock is subtracted from the total expense. This revenue is the sum of the cash sales, change in grown inventories, and change in account receivables associated with dairy cattle, heifers, and other livestock. The lowest cost quartile of farms had the second smallest revenue offset, with the two highest quartiles of farms averaging the highest revenue offset. The revenue offset ranged from $1.10 per cwt to $1.40 per cwt. The fourth quartile averaged the highest percent heifers to cows, so this could be one reason why they averaged the highest revenue. With the adjustment made, the lowest quartile of costs farms averaged $2,645 per cow for net purchased feed and herd production expenses. In each proceeding quartile the cost per cow increased, with the highest cost farms averaging $2,897 per cow. Not only did the lowest quartile farms average the lowest cost per cow, but they are also averaged the highest milk production per cow. On a per cwt. basis, the costs ranged from $9.51 to $11.25, or a difference of $1.74 per cwt.
Machinery and crop input expenses
Machinery expenses ranged from $492 per cow for the lowest quartile cost farms to $633 per cow for the highest quartile cost farms. Crop input costs ranged from $236 per cow to $338 per cow. One factor that can impact these costs is the tillable land that is worked. The tillable acres per cow increased from the lowest quartile of farms to the highest quartile, increasing from 1.68 acres per cow to 2.08 acres per cow.
The crop revenue offset ranged from $109 per cow for the lowest cost quartile of farms to $41 per cow for the highest cost quartile of farms. While the highest quartile of farms cropped the most acres per cow, they averaged the lowest revenue, which is comprised of crops sales plus change in grown inventory and change in account receivables. The growing conditions and impact of the drought to varying degrees across New York State would impact the crop revenue.
The lowest quartile of farms averaged $619 per cow for the net machinery and crop input costs, over $300 less per cow than the highest quartile of farms. This was a result of both spending the least per cow on the actual costs and having the largest income offset.
Other farm operating expenses, excluding interest and milk marketing expenses
The remaining operating expenses ranged from $375 per cow to $489 per cow. With different levels of leverage on farms, interest costs were excluded from this calculation. Milk marketing expense was also excluded as it is associated with the milk handler the farm contracts with, and it is more of an external cost that
the farm can’t influence during the year. The lowest cost farms also had the lowest cost per cow for other expenses and on a per cwt basis, the lowest cost farms averaged $1.39 per cwt. Other farm revenue, not including government receipts, ranged from $101 per cow to $224 per cow. The highest cost quartile averaged the highest other revenue per cow, followed by the lowest cost quartile. The net other farm operating costs ranged from $235 per cow to $331 per cow. The lowest net cost per cows was the lowest cost quartile of farms, followed by the highest cost quartile.
Total net operating costs before interest, milk marketing, and government receipts
By summing up the costs and revenues, we can determine the total net operating cost before interest, milk marketing, and government receipts. This represents the net costs that the farm manager has a greater ability to influence during the year. The lowest cost quartile of farms averaged $3,499 per cow, or $12.97 per cwt. While making the highest milk production per cow, they were the lowest cost per cow, averaging $233 per cow less than the second lowest quartile of farms. The highest quartile cost of farms averaged the highest cost per cow, with their costs being $593 higher per cow than the lowest group. While the highest cost, this group also average the lowest milk production per cow, leading to a cost per cwt. of $15.89, $2.29 higher than the lowest quartile of farms.
Importance of understanding costs
While management decisions are made and implemented over time, without understanding what is included in the costs to operate the farm, it may be difficult to know if the decisions are having the desired impact. Consistently using accurate financial records to calculate costs per cow and per hundredweight over time provides insight into how performance changes. Once changes or differences are identified, then the question “why?” can be asked. When looking at costs, it is also important to look at both production units and units of output (the per cow and per cwt). Is there an opportunity to spend less per cow on expenses that are not directly associated with milk production, or to utilize more efficiently those that are, leading to higher output and lower costs per hundredweight of milk sold?
Source: Cornell


