


The first genetic evaluation every calf born in Canada receives is their Parent Average (PA). This value estimates the future genetic abilities a calf has before any of its performance data is available, or data on a bull’s progeny. Now, with genomics, we can take a deeper look into the genetic merit of a young animal. When a young heifer is genotyped, we can take a peek into her DNA and see the actual characteristics she inherited from her parents. This allows us to have direct genetic data on the calf and be more confident in the calf’s genetic evaluation. Lactanet’s new Genomics Impact visualization tool gives you a visual representation of the impact that genomic testing had on a trait‐by‐trait basis for each genotyped female. But before we step through the main features of this new tool and how to use it, let’s review PA values and why they change with genomic testing.
What is the difference between PA and GPA?
The PA is simply the average of the genetic potential between the animal’s sire and dam. It considers that the calf receives 50% of its genetic potential from each parent.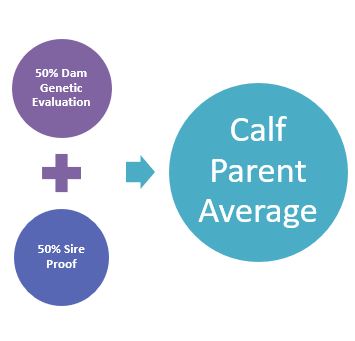 For example, if a calf’s sire has a proof of +2000 kg for milk yield and the dam has an index of +1000 kg, then we would expect the heifer to have a milk yield parent average of +1500 kg. This parent average gives us the best estimate until we have actual performance data on the heifer itself. While parent average values are accurate for representing the genetic merit, on average, of several daughters from a given mating, each conception has a different group of genes passed down to each heifer, even if the parentage is the exact same. So, while two heifers may have the same parent average, their true genetic potential and the causative genes that were passed down to them may be very different. Only in the case of natural identical twins, split embryos and clones would the resulting heifers be expected to have the exact same genetics.
In Figure 1 we see that two matings from two different sets of parents resulted in calves with the exact same PA. However, once the heifers are genotyped we can see the true potential of the genes that were passed down to them. In this scenario, heifer 1 received a more favourable combination of genes from its parents and the Genomic Parent Average (GPA) of the two heifers are no longer equal. This difference would likely be observed as the animal aged and their own performance data was included in genetic evaluations, however, with genotyping we don’t need to wait until the heifers are much older to see which one is of higher genetic value.
Visualizing the difference in genetic evaluation after genotyping
To improve the clarity of how genetic evaluations change after genotyping, Lactanet developed the Genomics Impact visualization tool that will appear as a separate tab on the Genetic Evaluation Summary page for Canadian-owned females once their genomic results are public. This new tool has been designed to give producers a visual representation of how the animal’s genetic evaluation has changed with genomics and also highlights the resulting improvement in reliability – so you can be confident with your genetic selection decisions.

Where can I find this tool?
Once a heifer is genotyped and the results are processed, a new tab called “Genomics Impact” will appear on the Genetic Evaluation Summary page. The “Genomics Impact” page for genotyped females includes:
- The official genomic evaluation for LPI, Pro$ and several major traits, which is consistent with the information on the animal’s Genetic Evaluation Summary page
- Visual comparison of the (standardized) changes from traditional evaluations to genomics for each trait
- The increase in reliability level that resulted from including genomics in the evaluation
Breakdown of key features
An example of the visualization tool is provided in Figure 2 with three key areas identified.
The user summary: This section offers users a quick description of the Genomic Impact tool and what it means in terms of your genetic decisions. This visual aid helps to compare how much your animal’s genetic evaluation has changed with genomic information included. Although the value of the genetic evaluation may increase or decrease, the reliability of the evaluation reflects the increased accuracy, which means that you can be more confident with your breeding decisions.

The change bar: The blue bars to the left (decrease) or right (increase) of the centre line represent the magnitude (and direction) of change in genetic evaluation for each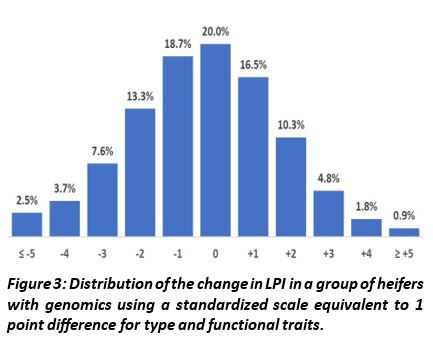 trait. Type and functional traits use a similar scale of expression with a standard deviation of 5 points. For this reason, the distribution of change in genetic evaluations with the inclusion of genomics can easily be displayed on a point-by-point basis. For most heifers, the change from Parent Average (PA) to Genomic Parent Average (GPA) is relatively small with ≈80% of Holstein heifers changing two points or less for conformation traits. For LPI, Pro$ and production traits, the visualization tool reflects the change with genomics expressed on a standardized scale so they can easily be compared across all traits displayed. This approach lets you see if the change in the evaluation with genomics is important or not on a trait-by-trait basis. Figure 3 shows the distribution of change in LPI with genomics for the Holstein breed after standardization to a scale equivalent to changes observed for type and functional traits. As you can see, less than 8% of heifers experience an LPI change that is equivalent to at least a 3-point increase for type and functional traits.
Reliability: With genomics we see a significant increase in reliability, especially in Holstein with the largest reference population but also in the Jersey, Ayrshire and Brown Swiss breeds. The size of the reference population grows as there are more genotyped progeny proven sires available and genotyped cows with performance data. The increase in reliability with genomic also depends on the amount of data already included in the heifer or cow’s genetic evaluation. For heifers, which only have a Parent Average value available, there is a greater reliability increase that results from genotyping. For cows, however, that already that their own lactation, classification or other performance data available, the observed increase in reliability from genomics will not be as large. The average gain in reliability due to genomics for each breed can be found here: https://lactanet.ca/en/average-gain-in-lpi-reliability-due-to-genomics/
Summary
The new Genomics Impact tool provides an easy-to-use visual representation of the change in genetic evaluation that resulted from including genomics and also provides the associated gain in reliability. As your heifer ages and both the PA and GPA change over time with the addition of more data being included, so will the genomics impact visualization tool – you’ll always be getting the most current information. While this tool is helpful to demonstrate how evaluations change with genomics, it should not be used to make selection or mating decisions. The official genomic evaluation for each trait is the best tool for such decisions regardless of whether the impact of including genomics was positive or negative.


